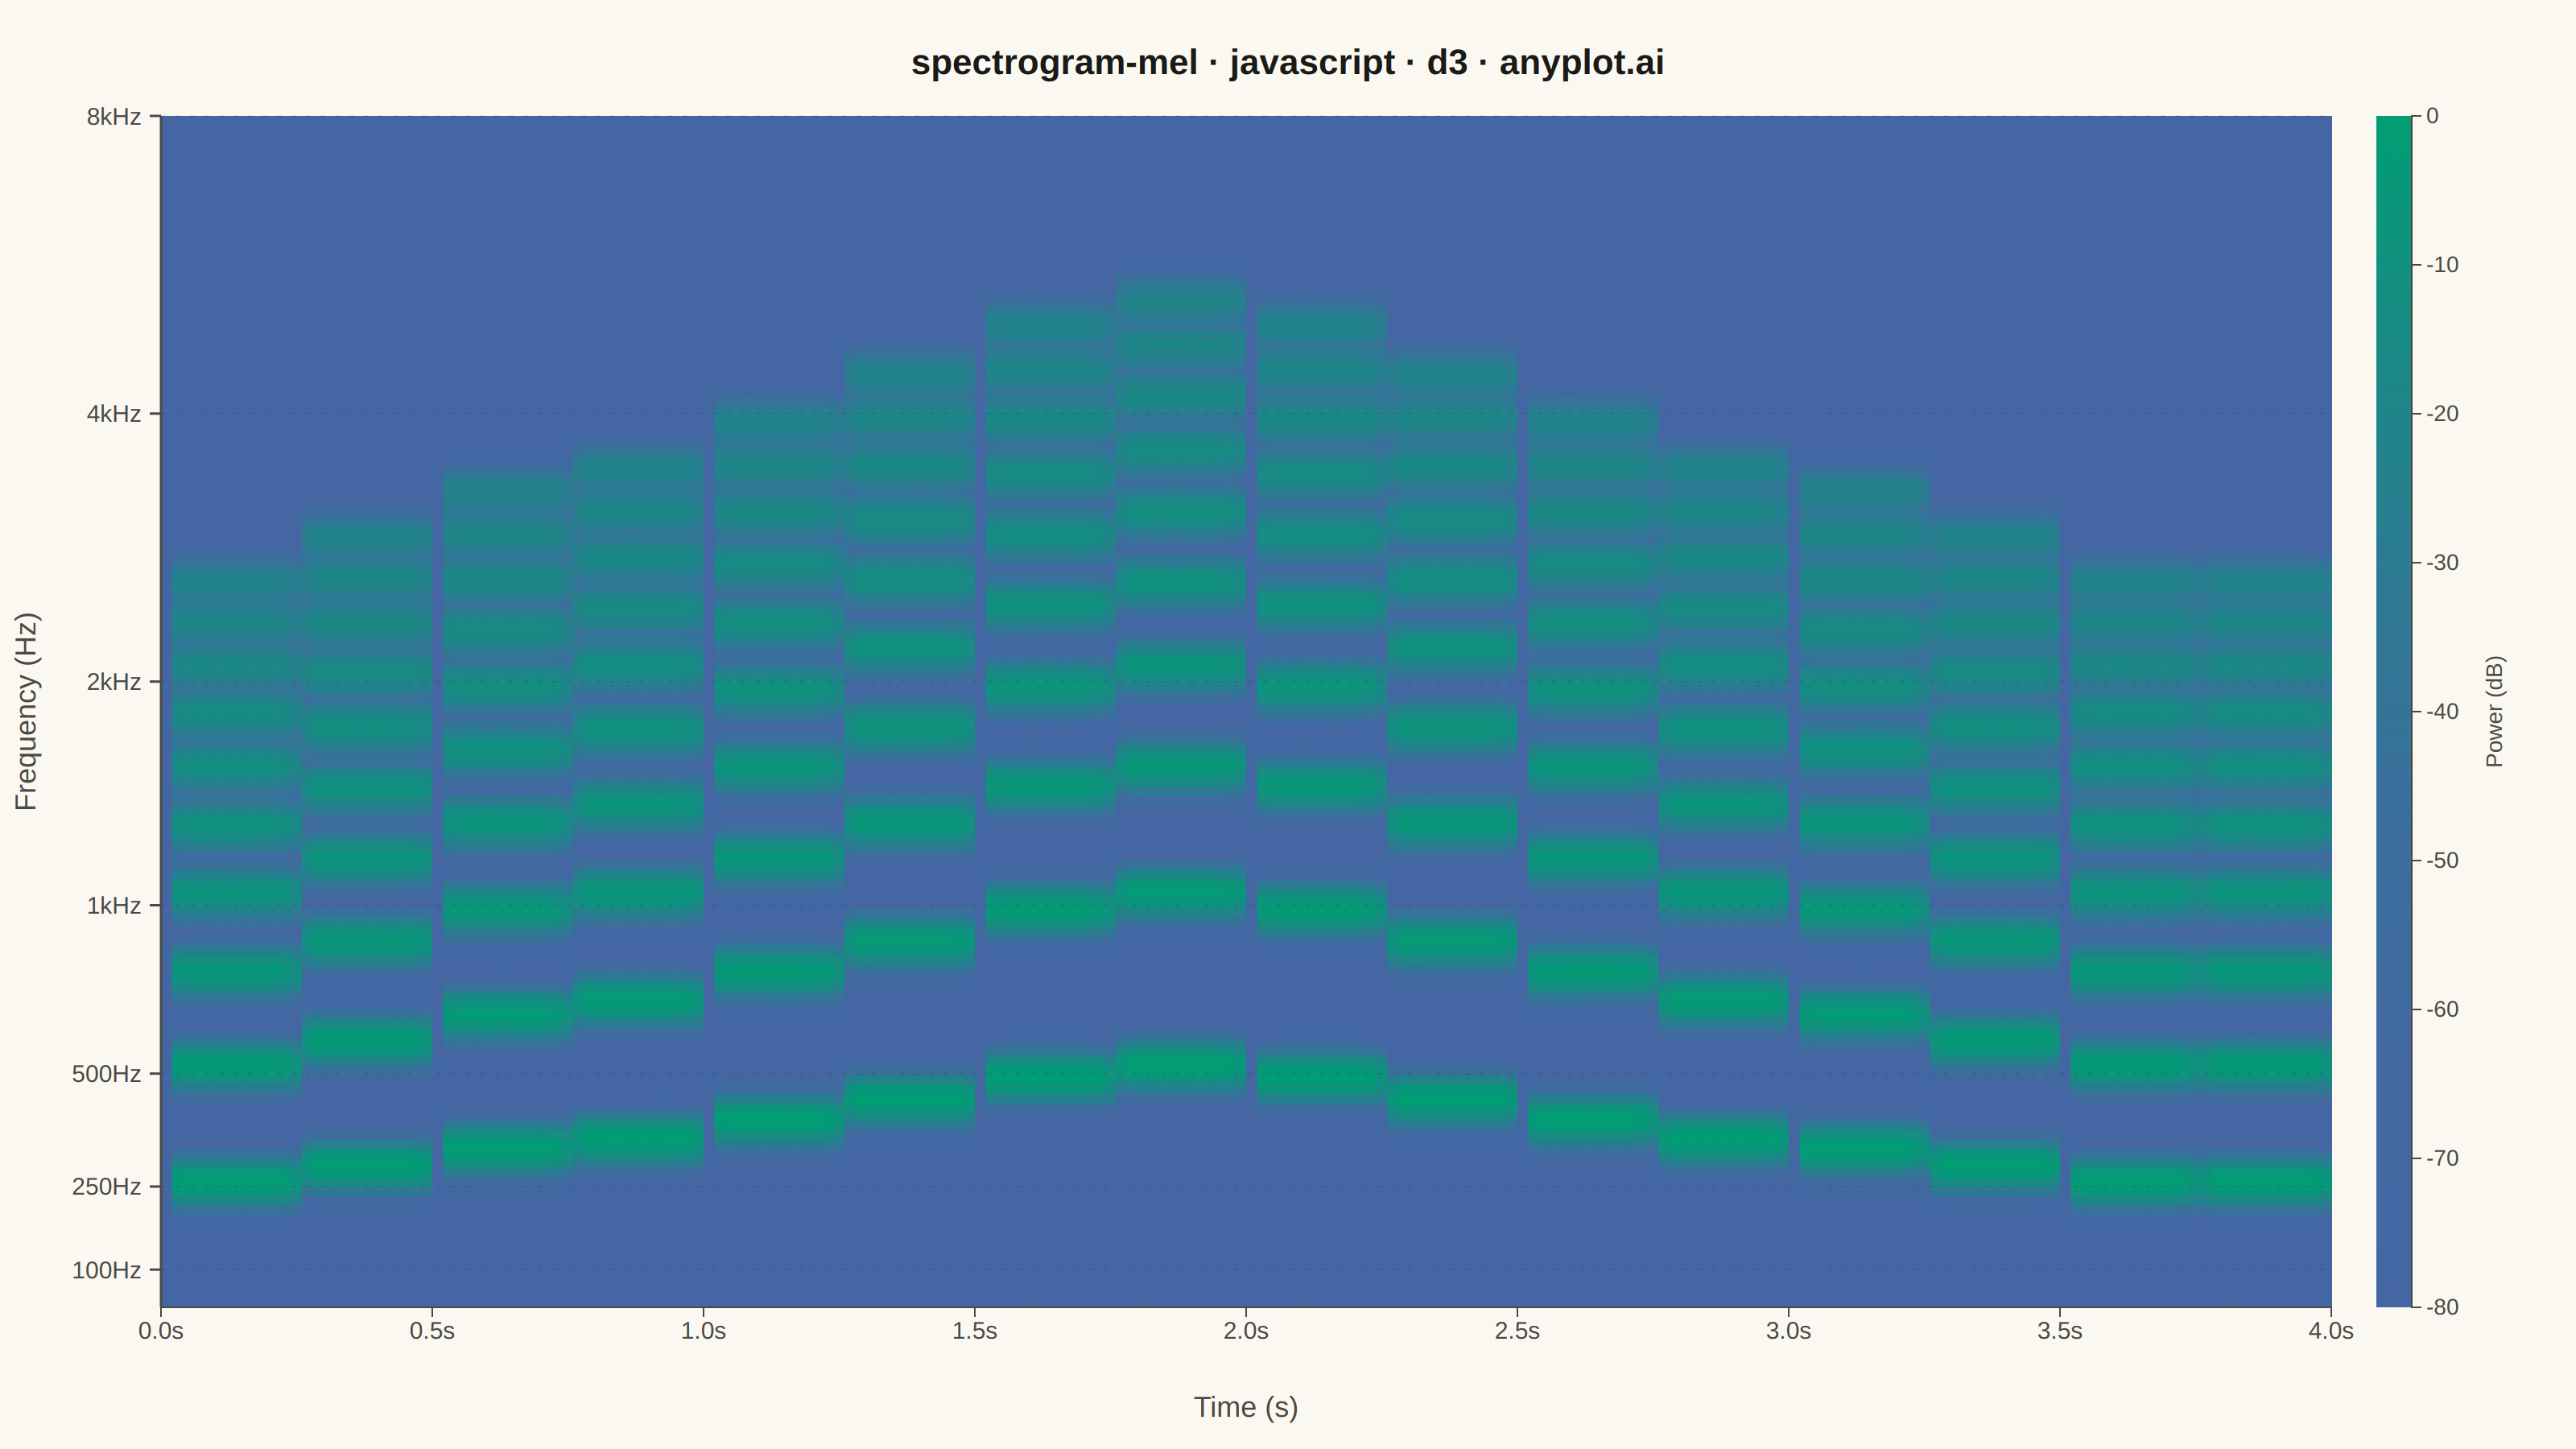
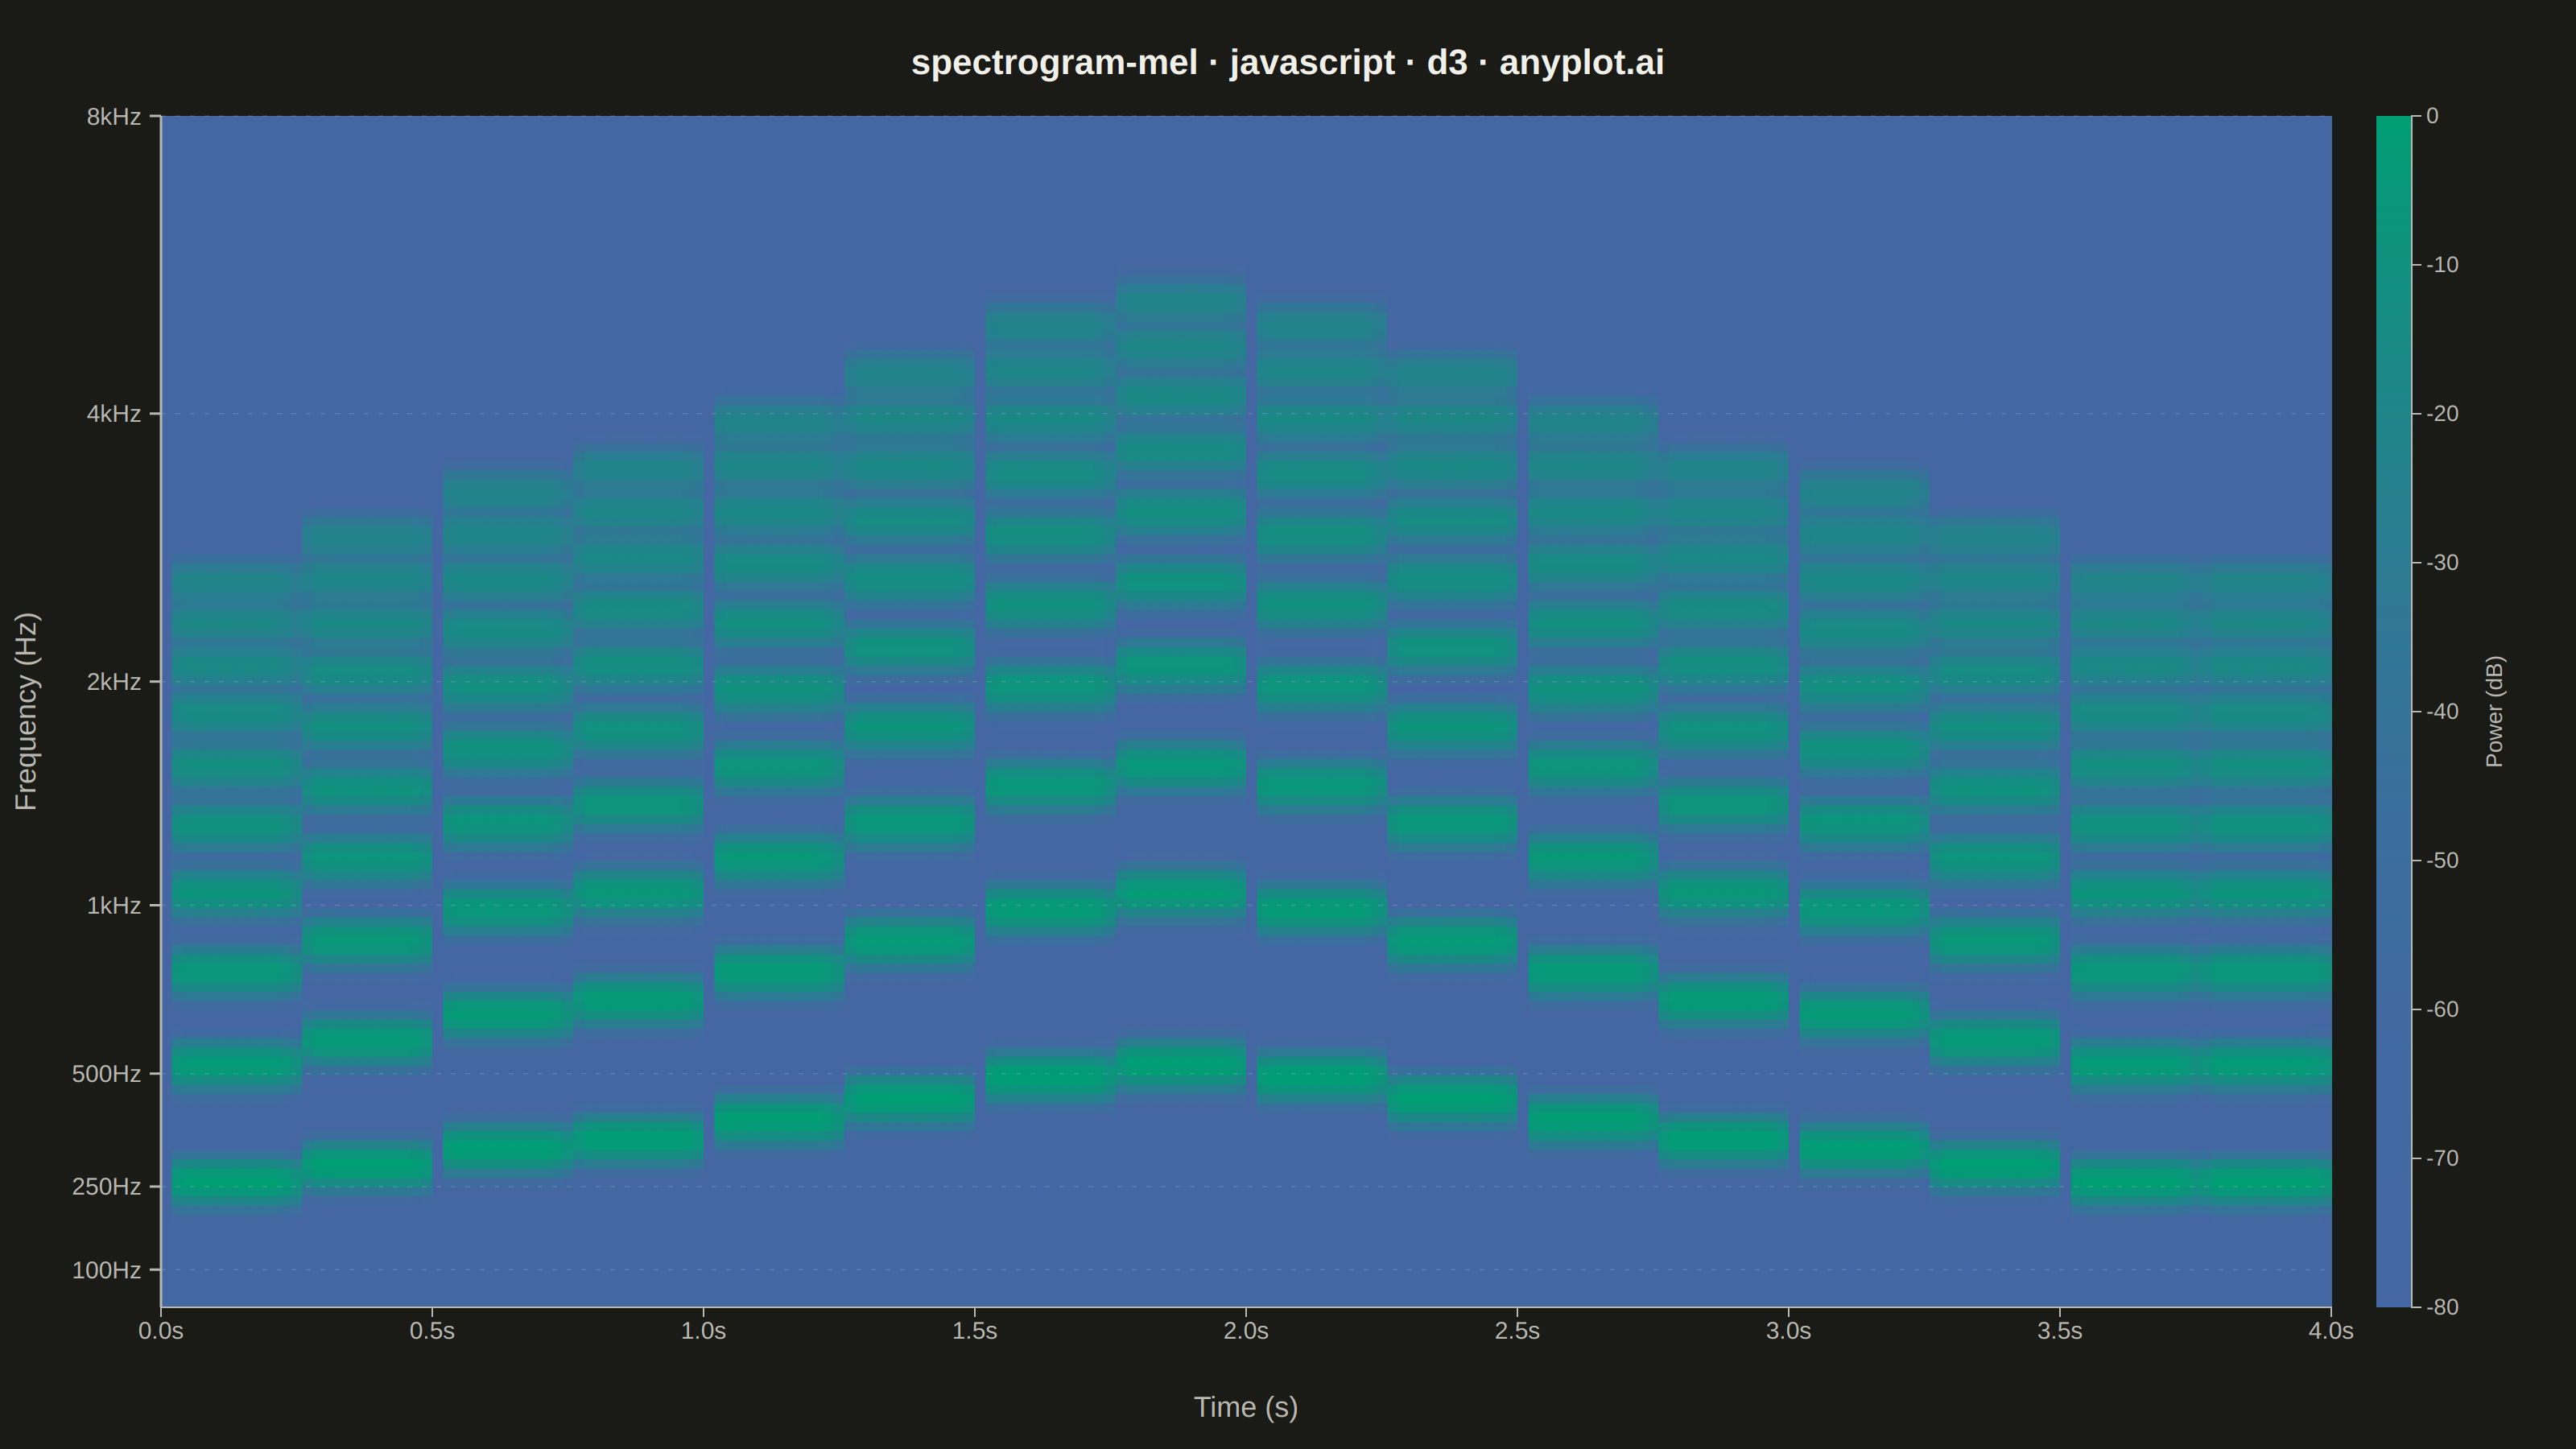
The same plot in 14 other libraries — JavaScript: Chart.js, Apache ECharts, Highcharts, MUI X Charts; Python: Altair, Bokeh, lets-plot, Matplotlib, Plotly, plotnine, Pygal, Seaborn; R: ggplot2; Julia: Makie.jl. Compare all 15 side by side: Mel-Spectrogram for Audio Analysis in Python, R, Julia and JavaScript.
A mel-spectrogram displaying the power spectrum of an audio signal with the frequency axis warped to the mel scale, which approximates human auditory perception. Unlike a standard spectrogram with a linear frequency axis, the mel-spectrogram compresses higher frequencies and expands lower frequencies, making perceptually similar sounds visually closer together. This is the foundational input representation for modern audio machine learning pipelines including speech recognition, speaker identification, and music information retrieval.
// anyplot.ai
// spectrogram-mel: Mel-Spectrogram for Audio Analysis
// Library: d3 7.9.0 | JavaScript 22.22.3
// Quality: 88/100 | Created: 2026-06-03

//# anyplot-orientation: landscape

const t = window.ANYPLOT_TOKENS;
const { width, height } = window.ANYPLOT_SIZE;

// --- Mel scale helpers ---
const hzToMel = hz => 2595 * Math.log10(1 + hz / 700);
const melToHz = mel => 700 * (Math.pow(10, mel / 2595) - 1);

// --- Parameters ---
const n_mels = 128;
const n_frames = 200;
const duration = 4.0;
const fmin = 40;
const fmax = 8000;
const mel_min = hzToMel(fmin);
const mel_max = hzToMel(fmax);

// Center frequency (Hz) of each mel bin
const mel_hz = Array.from({ length: n_mels }, (_, i) =>
  melToHz(mel_min + (mel_max - mel_min) * (i + 0.5) / n_mels)
);

// --- Synthesize mel spectrogram: C major scale ascending then descending ---
const notes = [
  261.6, 293.7, 329.6, 349.2, 392.0, 440.0, 493.9, 523.3,
  493.9, 440.0, 392.0, 349.2, 329.6, 293.7, 261.6, 261.6,
];
const fpn = n_frames / notes.length;

const spec = Array.from({ length: n_frames }, (_, f) => {
  const ni = Math.min(Math.floor(f / fpn), notes.length - 1);
  const fund = notes[ni];
  const phase = f / fpn - ni;
  const env = phase < 0.12 ? phase / 0.12 : phase > 0.80 ? (1 - phase) / 0.20 : 1.0;
  return Array.from({ length: n_mels }, (_, m) => {
    const hz = mel_hz[m];
    let power = 2e-8;
    for (let h = 1; h <= 10; h++) {
      const hf = fund * h;
      if (hf > fmax * 1.1) break;
      const bw = hf * 0.03 + 18;
      const dn = (hz - hf) / bw;
      power += env * Math.pow(0.60, h - 1) * Math.exp(-2 * dn * dn);
    }
    return Math.max(-80, Math.min(0, 10 * Math.log10(power)));
  });
});

// --- Layout ---
const margin = { top: 72, right: 152, bottom: 88, left: 100 };
const iw = width - margin.left - margin.right;
const ih = height - margin.top - margin.bottom;

// --- SVG mount ---
const svg = d3.select("#container").append("svg")
  .attr("width", width).attr("height", height);
const g = svg.append("g").attr("transform", `translate(${margin.left},${margin.top})`);

// --- Color scale: gamma-compressed, noise=dark(seq[1]), signal=bright(seq[0] green) ---
// Gamma > 1 pushes most noise-floor values to the dark end so harmonics stand out.
const dbGamma = 2.2;
const colorScale = db => {
  const norm = Math.max(0, Math.min(1, (db + 80) / 80));
  const tc = Math.pow(norm, dbGamma);
  return d3.interpolateRgb(t.seq[1], t.seq[0])(tc);
};

// --- Heatmap cells ---
const cw = iw / n_frames;
const ch = ih / n_mels;

const cells = [];
for (let f = 0; f < n_frames; f++) {
  for (let m = 0; m < n_mels; m++) {
    cells.push({ f, m, db: spec[f][m] });
  }
}

g.selectAll("rect.cell").data(cells).join("rect")
  .attr("class", "cell")
  .attr("x", d => d.f * cw)
  .attr("y", d => (n_mels - 1 - d.m) * ch)
  .attr("width", cw + 0.5)
  .attr("height", ch + 0.5)
  .attr("fill", d => colorScale(d.db));

// --- Key frequency helper ---
const keyHz = [100, 250, 500, 1000, 2000, 4000, 8000];
const hzToY = hz => {
  const frac = (hzToMel(Math.max(fmin, Math.min(fmax, hz))) - mel_min) / (mel_max - mel_min);
  return ih * (1 - frac);
};

// --- Subtle horizontal reference lines at key mel-band edges ---
keyHz.forEach(hz => {
  const y = hzToY(hz);
  if (y < 0 || y > ih) return;
  g.append("line")
    .attr("x1", 0).attr("y1", y).attr("x2", iw).attr("y2", y)
    .attr("stroke", t.grid).attr("stroke-width", 0.8)
    .attr("stroke-dasharray", "3,6");
});

// --- X axis: time ---
const xScale = d3.scaleLinear().domain([0, duration]).range([0, iw]);
const xAxis = g.append("g")
  .attr("transform", `translate(0,${ih})`)
  .call(d3.axisBottom(xScale).ticks(8).tickFormat(d => `${d.toFixed(1)}s`));
xAxis.selectAll("text").attr("fill", t.inkSoft).style("font-size", "15px");
xAxis.selectAll("line").attr("stroke", t.inkSoft);
xAxis.select(".domain").attr("stroke", t.inkSoft);

// --- Y axis: mel-scaled, custom Hz ticks ---
const yg = g.append("g");
keyHz.forEach(hz => {
  const y = hzToY(hz);
  if (y < 0 || y > ih) return;
  yg.append("line")
    .attr("x1", 0).attr("y1", y).attr("x2", -7).attr("y2", y)
    .attr("stroke", t.inkSoft).attr("stroke-width", 1.5);
  yg.append("text")
    .attr("x", -12).attr("y", y).attr("dy", "0.35em")
    .attr("text-anchor", "end")
    .attr("fill", t.inkSoft).style("font-size", "15px")
    .text(hz >= 1000 ? `${hz / 1000}kHz` : `${hz}Hz`);
});
yg.append("line")
  .attr("x1", 0).attr("y1", 0).attr("x2", 0).attr("y2", ih)
  .attr("stroke", t.inkSoft).attr("stroke-width", 1.5);

// --- Axis labels ---
g.append("text")
  .attr("x", iw / 2).attr("y", ih + 68)
  .attr("text-anchor", "middle").attr("fill", t.inkSoft)
  .style("font-size", "18px")
  .text("Time (s)");

svg.append("text")
  .attr("transform", "rotate(-90)")
  .attr("x", -(margin.top + ih / 2)).attr("y", 22)
  .attr("text-anchor", "middle").attr("fill", t.inkSoft)
  .style("font-size", "18px")
  .text("Frequency (Hz)");

// --- Colorbar: bottom = -80 dB (dark), top = 0 dB (bright green) ---
const cbX = margin.left + iw + 28;
const cbY = margin.top;
const cbW = 22;
const cbH = ih;

const defs = svg.append("defs");
const grad = defs.append("linearGradient").attr("id", "cb-grad")
  .attr("x1", "0%").attr("y1", "100%").attr("x2", "0%").attr("y2", "0%");
[0, 0.2, 0.4, 0.6, 0.8, 1.0].forEach(f => {
  grad.append("stop")
    .attr("offset", `${(f * 100).toFixed(0)}%`)
    .attr("stop-color", colorScale(-80 + 80 * f));
});

svg.append("rect")
  .attr("x", cbX).attr("y", cbY)
  .attr("width", cbW).attr("height", cbH)
  .attr("fill", "url(#cb-grad)");

const cbScale = d3.scaleLinear().domain([-80, 0]).range([cbH, 0]);
const cbAxis = svg.append("g")
  .attr("transform", `translate(${cbX + cbW},${cbY})`)
  .call(d3.axisRight(cbScale).ticks(6).tickFormat(d => `${d}`));
cbAxis.selectAll("text").attr("fill", t.inkSoft).style("font-size", "14px");
cbAxis.selectAll("line").attr("stroke", t.inkSoft);
cbAxis.select(".domain").attr("stroke", t.inkSoft);

svg.append("text")
  .attr("transform", "rotate(-90)")
  .attr("x", -(cbY + cbH / 2))
  .attr("y", cbX + cbW + 56)
  .attr("text-anchor", "middle")
  .attr("fill", t.inkSoft).style("font-size", "14px")
  .text("Power (dB)");

// --- Title ---
svg.append("text")
  .attr("x", width / 2).attr("y", 46)
  .attr("text-anchor", "middle")
  .attr("fill", t.ink)
  .style("font-size", "22px").style("font-weight", "600")
  .text("spectrogram-mel · javascript · d3 · anyplot.ai");
Runnable source as JSON, for any HTTP client: https://api.anyplot.ai/specs/spectrogram-mel/d3/code. Any spec id and library id listed in llms-full.txt fit the same URL shape; every URL below is complete and callable.
{
  "spec_id": "spectrogram-mel",
  "language": "javascript",
  "library": "d3",
  "page": "https://anyplot.ai/spectrogram-mel/javascript/d3",
  "hub": "https://anyplot.ai/spectrogram-mel",
  "code_json": "https://api.anyplot.ai/specs/spectrogram-mel/d3/code",
  "spec_json": "https://api.anyplot.ai/specs/spectrogram-mel",
  "render_light_png": "https://storage.googleapis.com/anyplot-images/plots/spectrogram-mel/javascript/d3/plot-light.png",
  "render_dark_png": "https://storage.googleapis.com/anyplot-images/plots/spectrogram-mel/javascript/d3/plot-dark.png",
  "interactive_light_html": "https://storage.googleapis.com/anyplot-images/plots/spectrogram-mel/javascript/d3/plot-light.html",
  "interactive_dark_html": "https://storage.googleapis.com/anyplot-images/plots/spectrogram-mel/javascript/d3/plot-dark.html",
  "quality_score": 88.0,
  "license": "MIT",
  "guide": "https://anyplot.ai/llms.txt"
}
Part of Mel-Spectrogram for Audio Analysis on anyplot.ai.