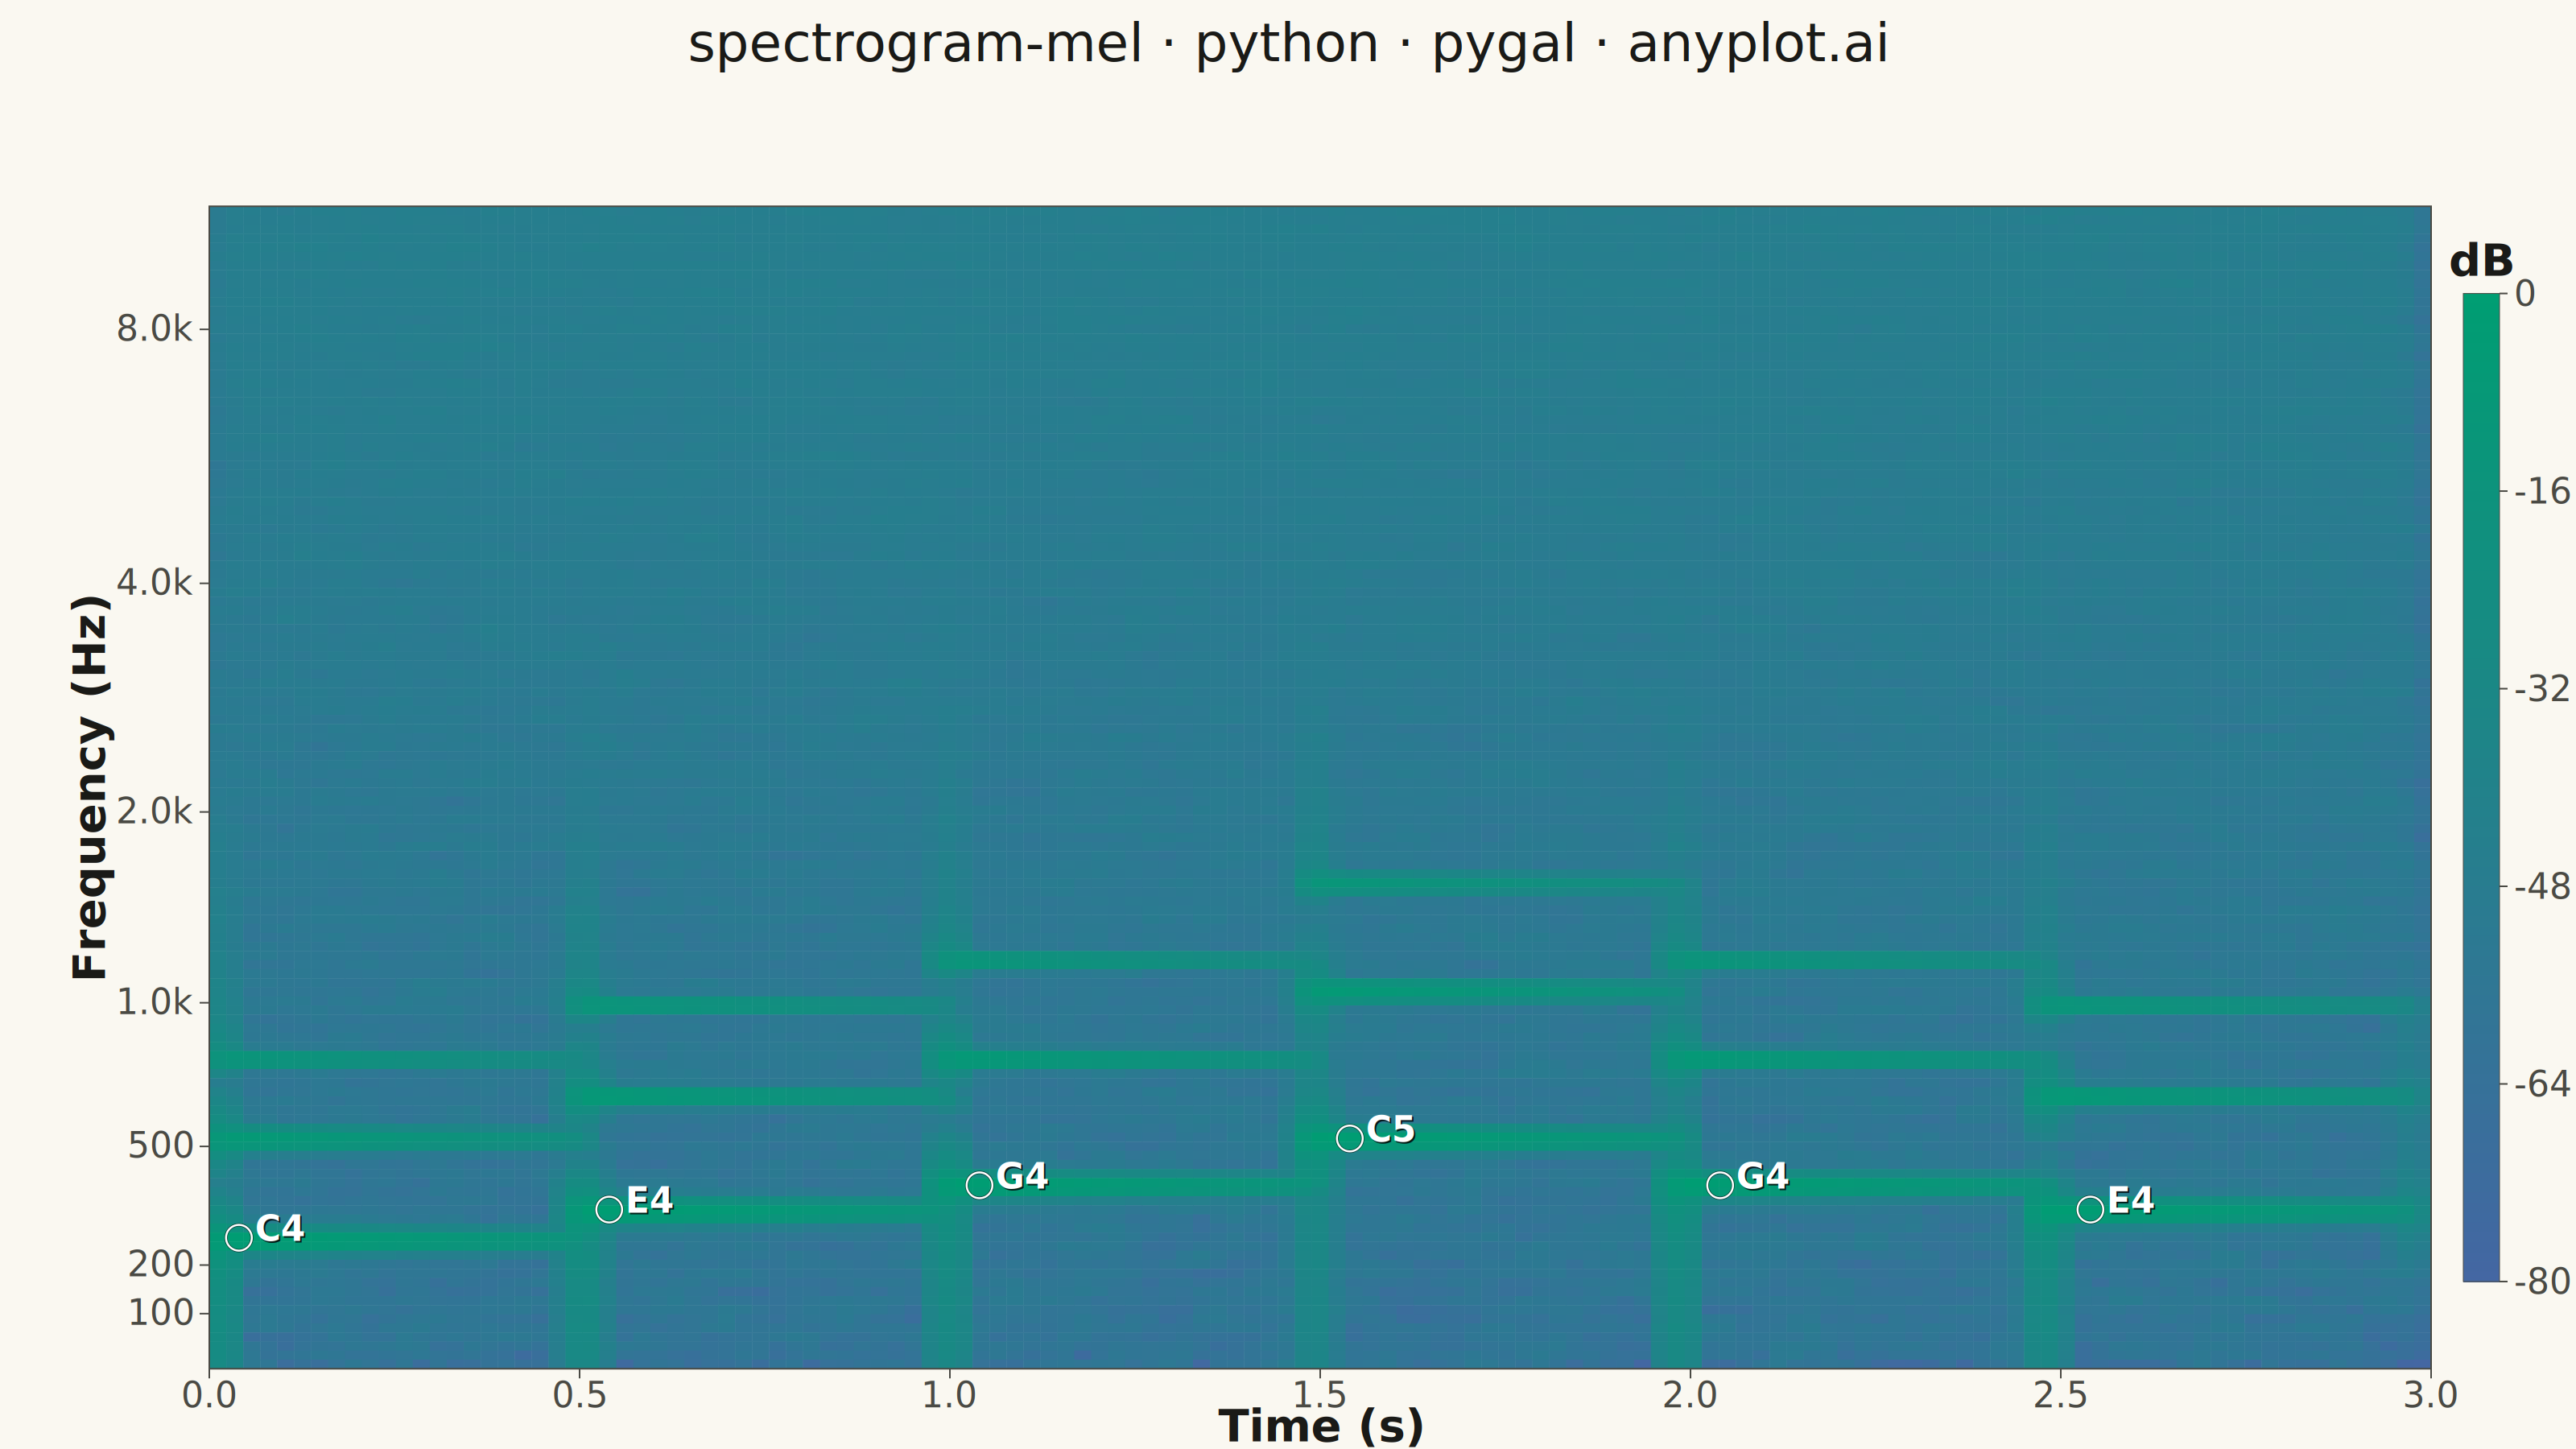
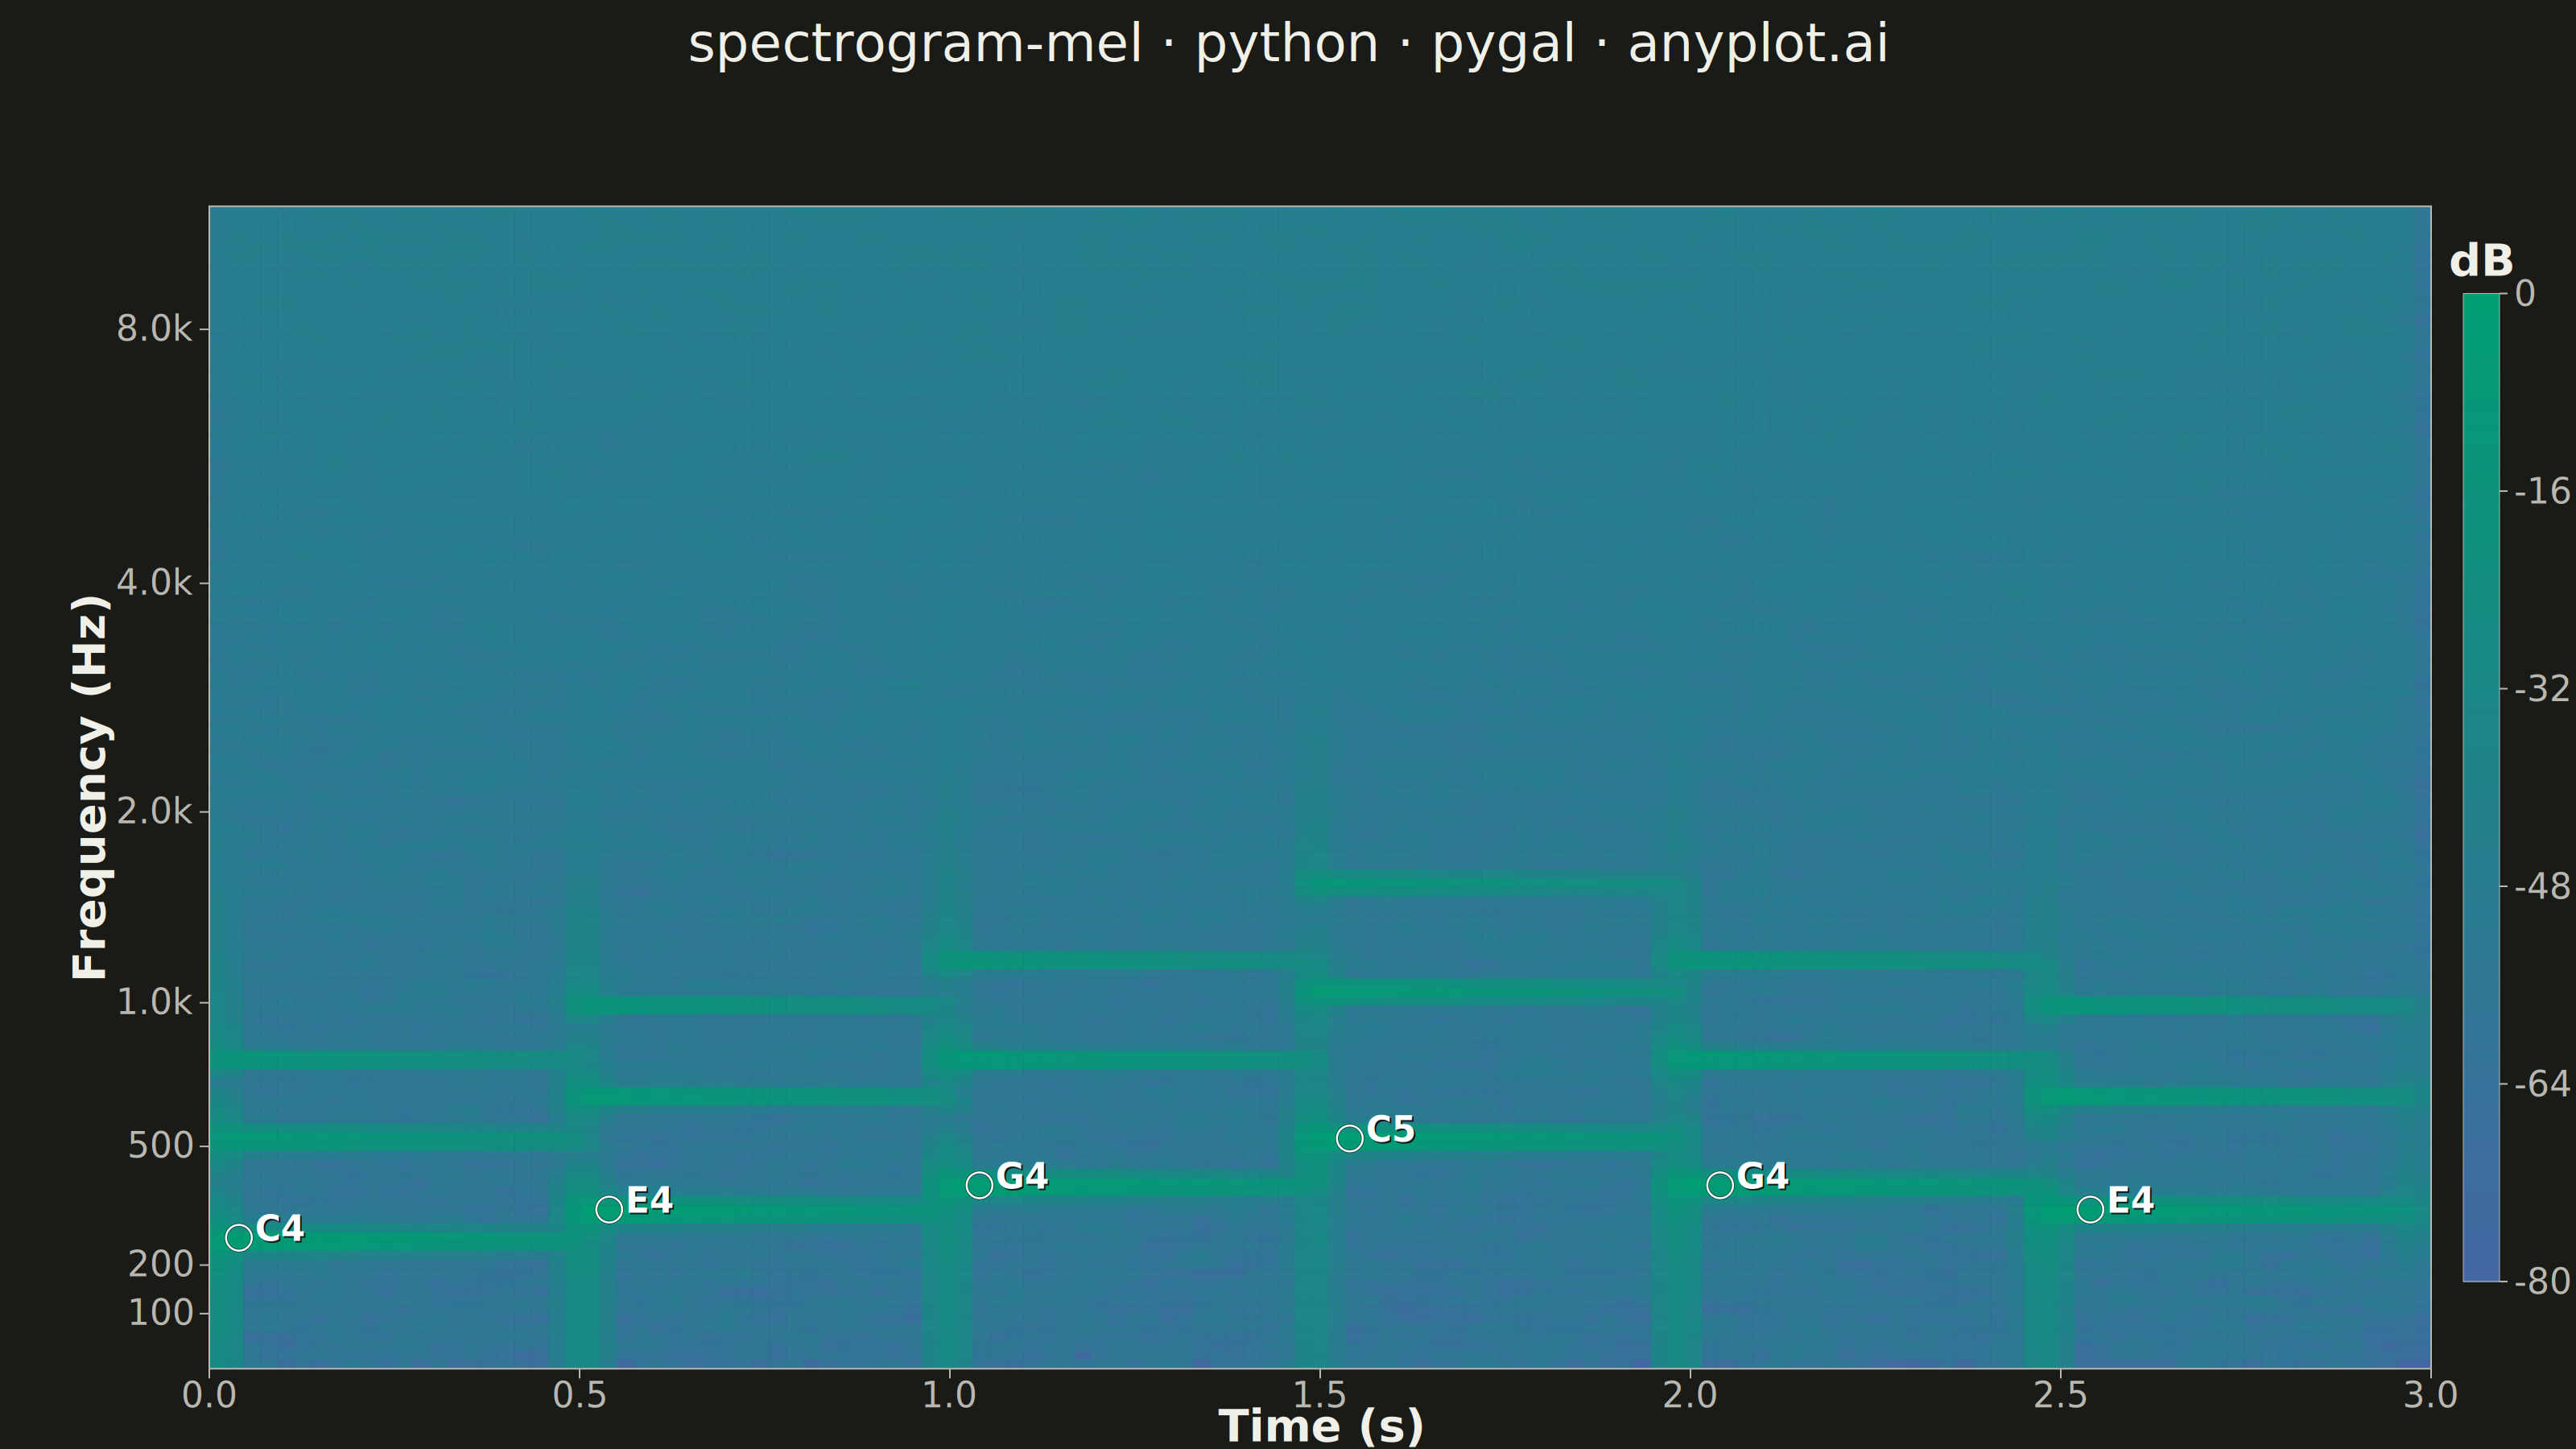
A mel-spectrogram displaying the power spectrum of an audio signal with the frequency axis warped to the mel scale, which approximates human auditory perception. Unlike a standard spectrogram with a linear frequency axis, the mel-spectrogram compresses higher frequencies and expands lower frequencies, making perceptually similar sounds visually closer together. This is the foundational input representation for modern audio machine learning pipelines including speech recognition, speaker identification, and music information retrieval.
""" anyplot.ai
spectrogram-mel: Mel-Spectrogram for Audio Analysis
Library: pygal 3.1.0 | Python 3.13.13
Quality: 80/100 | Updated: 2026-06-03
"""

import os
import sys

import numpy as np
from scipy import signal


# Remove script directory from sys.path to avoid pygal package name collision
sys.path = [p for p in sys.path if os.path.abspath(p) != os.path.dirname(os.path.abspath(__file__))]

from pygal.graph.graph import Graph
from pygal.style import Style


# Theme tokens — Imprint palette, theme-adaptive chrome
THEME = os.getenv("ANYPLOT_THEME", "light")
PAGE_BG = "#FAF8F1" if THEME == "light" else "#1A1A17"
INK = "#1A1A17" if THEME == "light" else "#F0EFE8"
INK_SOFT = "#4A4A44" if THEME == "light" else "#B8B7B0"
INK_MUTED = "#6B6A63" if THEME == "light" else "#A8A79F"

IMPRINT_PALETTE = ("#009E73", "#C475FD", "#4467A3", "#BD8233", "#AE3030", "#2ABCCD", "#954477", "#99B314")

title_str = "spectrogram-mel · python · pygal · anyplot.ai"
n_title = len(title_str)
title_font_size = round(66 * 67 / n_title) if n_title > 67 else 66


def interpolate_color(value, min_val, max_val, colormap):
    normalized = max(0.0, min(1.0, (value - min_val) / (max_val - min_val))) if max_val != min_val else 1.0
    pos = normalized * (len(colormap) - 1)
    lo, hi = int(pos), min(int(pos) + 1, len(colormap) - 1)
    frac = pos - lo
    c1, c2 = colormap[lo], colormap[hi]
    r = int(int(c1[1:3], 16) + (int(c2[1:3], 16) - int(c1[1:3], 16)) * frac)
    g = int(int(c1[3:5], 16) + (int(c2[3:5], 16) - int(c1[3:5], 16)) * frac)
    b = int(int(c1[5:7], 16) + (int(c2[5:7], 16) - int(c1[5:7], 16)) * frac)
    return f"#{r:02x}{g:02x}{b:02x}"


class MelSpectrogramChart(Graph):
    """Custom mel-spectrogram chart extending pygal's Graph."""

    def __init__(self, *args, **kwargs):
        self.spectrogram_data = kwargs.pop("spectrogram_data", [])
        self.time_bins = kwargs.pop("time_bins", [])
        self.mel_freq_labels = kwargs.pop("mel_freq_labels", [])
        self.mel_freq_positions = kwargs.pop("mel_freq_positions", [])
        self.note_annotations = kwargs.pop("note_annotations", [])
        self.db_min = kwargs.pop("db_min", -80)
        self.db_max = kwargs.pop("db_max", 0)
        self.colormap = kwargs.pop("colormap", [])
        super().__init__(*args, **kwargs)

    def _plot(self):
        if len(self.spectrogram_data) == 0:
            return

        n_mels = len(self.spectrogram_data)
        n_time = len(self.spectrogram_data[0]) if n_mels > 0 else 0
        min_val, max_val = self.db_min, self.db_max

        plot_width = self.view.width
        plot_height = self.view.height

        margin_left, margin_right = 160, 200
        margin_top, margin_bottom = 30, 100

        avail_w = plot_width - margin_left - margin_right
        avail_h = plot_height - margin_bottom - margin_top
        cell_w = avail_w / n_time
        cell_h = avail_h / n_mels

        x0 = self.view.x(0) + margin_left
        y0 = self.view.y(n_mels) + margin_top

        plot_node = self.nodes["plot"]
        grp = self.svg.node(plot_node, class_="mel-spectrogram")

        # Draw spectrogram cells (mel band 0 at bottom)
        for i in range(n_mels):
            for j in range(n_time):
                value = self.spectrogram_data[n_mels - 1 - i][j]
                color = interpolate_color(value, min_val, max_val, self.colormap)
                rect = self.svg.node(
                    grp, "rect", x=x0 + j * cell_w, y=y0 + i * cell_h, width=cell_w + 0.5, height=cell_h + 0.5
                )
                rect.set("fill", color)
                rect.set("stroke", "none")

        # Border around spectrogram
        border = self.svg.node(grp, "rect", x=x0, y=y0, width=avail_w, height=avail_h)
        border.set("fill", "none")
        border.set("stroke", INK_SOFT)
        border.set("stroke-width", "2")

        axis_label_size = 56
        tick_font_size = 44

        # X-axis label
        tx = self.svg.node(grp, "text", x=x0 + avail_w / 2, y=y0 + avail_h + 90)
        tx.set("text-anchor", "middle")
        tx.set("fill", INK)
        tx.set("style", f"font-size:{axis_label_size}px;font-weight:bold;font-family:sans-serif")
        tx.text = "Time (s)"

        # Y-axis label
        yl_x, yl_y = x0 - 130, y0 + avail_h / 2
        ty = self.svg.node(grp, "text", x=yl_x, y=yl_y, transform=f"rotate(-90, {yl_x}, {yl_y})")
        ty.set("text-anchor", "middle")
        ty.set("fill", INK)
        ty.set("style", f"font-size:{axis_label_size}px;font-weight:bold;font-family:sans-serif")
        ty.text = "Frequency (Hz)"

        # X-axis ticks
        n_x_ticks = 7
        for i in range(n_x_ticks):
            frac = i / (n_x_ticks - 1)
            tick_x = x0 + frac * avail_w
            tick_y = y0 + avail_h
            line = self.svg.node(grp, "line", x1=tick_x, y1=tick_y, x2=tick_x, y2=tick_y + 12)
            line.set("stroke", INK_SOFT)
            line.set("stroke-width", "2")
            time_val = self.time_bins[int(frac * (len(self.time_bins) - 1))]
            tt = self.svg.node(grp, "text", x=tick_x, y=tick_y + 48)
            tt.set("text-anchor", "middle")
            tt.set("fill", INK_SOFT)
            tt.set("style", f"font-size:{tick_font_size}px;font-family:sans-serif")
            tt.text = f"{time_val:.1f}"

        # Y-axis ticks
        for freq_hz, norm_pos in zip(self.mel_freq_labels, self.mel_freq_positions, strict=True):
            tick_x = x0
            tick_y = y0 + (1 - norm_pos) * avail_h
            line = self.svg.node(grp, "line", x1=tick_x - 12, y1=tick_y, x2=tick_x, y2=tick_y)
            line.set("stroke", INK_SOFT)
            line.set("stroke-width", "2")
            lbl = self.svg.node(grp, "text", x=tick_x - 20, y=tick_y + 14)
            lbl.set("text-anchor", "end")
            lbl.set("fill", INK_SOFT)
            lbl.set("style", f"font-size:{tick_font_size}px;font-family:sans-serif")
            lbl.text = f"{freq_hz / 1000:.1f}k" if freq_hz >= 1000 else f"{int(freq_hz)}"

        # Note annotations at each onset for storytelling emphasis
        annot_size = 44
        for note_name, norm_y, time_frac in self.note_annotations:
            ax = x0 + time_frac * avail_w
            ay = y0 + (1 - norm_y) * avail_h
            # Circle markers with dual-color rings for contrast on spectrogram
            marker = self.svg.node(grp, "circle", cx=ax, cy=ay, r=16)
            marker.set("fill", "none")
            marker.set("stroke", "#000000")
            marker.set("stroke-width", "4")
            marker.set("opacity", "0.6")
            marker2 = self.svg.node(grp, "circle", cx=ax, cy=ay, r=16)
            marker2.set("fill", "none")
            marker2.set("stroke", "#ffffff")
            marker2.set("stroke-width", "2.5")
            # Text shadow for legibility over varying spectrogram colors
            shadow = self.svg.node(grp, "text", x=ax + 22, y=ay + 6)
            shadow.set("fill", "#000000")
            shadow.set("opacity", "0.8")
            shadow.set("style", f"font-size:{annot_size}px;font-weight:bold;font-family:sans-serif")
            shadow.text = note_name
            at = self.svg.node(grp, "text", x=ax + 20, y=ay + 4)
            at.set("fill", "#ffffff")
            at.set("style", f"font-size:{annot_size}px;font-weight:bold;font-family:sans-serif")
            at.text = note_name

        # Colorbar
        cb_w, cb_h = 45, avail_h * 0.85
        cb_x = x0 + avail_w + 40
        cb_y = y0 + (avail_h - cb_h) / 2

        n_segments = 100
        seg_h = cb_h / n_segments
        for i in range(n_segments):
            seg_val = min_val + (max_val - min_val) * (n_segments - 1 - i) / (n_segments - 1)
            seg_color = interpolate_color(seg_val, min_val, max_val, self.colormap)
            self.svg.node(grp, "rect", x=cb_x, y=cb_y + i * seg_h, width=cb_w, height=seg_h + 1, fill=seg_color)

        # Colorbar border
        self.svg.node(grp, "rect", x=cb_x, y=cb_y, width=cb_w, height=cb_h, fill="none", stroke=INK_SOFT)

        # Colorbar ticks and labels
        cb_label_size = 44
        for i in range(6):
            pos = i / 5
            val = max_val - (max_val - min_val) * pos
            ty_pos = cb_y + pos * cb_h + cb_label_size * 0.35
            tl = self.svg.node(
                grp, "line", x1=cb_x + cb_w, y1=cb_y + pos * cb_h, x2=cb_x + cb_w + 10, y2=cb_y + pos * cb_h
            )
            tl.set("stroke", INK_SOFT)
            tl.set("stroke-width", "2")
            ct = self.svg.node(grp, "text", x=cb_x + cb_w + 18, y=ty_pos)
            ct.set("fill", INK_SOFT)
            ct.set("style", f"font-size:{cb_label_size}px;font-family:sans-serif")
            ct.text = f"{val:.0f}"

        # Colorbar title
        cbt = self.svg.node(grp, "text", x=cb_x + cb_w / 2, y=cb_y - 22)
        cbt.set("text-anchor", "middle")
        cbt.set("fill", INK)
        cbt.set("style", f"font-size:{axis_label_size}px;font-weight:bold;font-family:sans-serif")
        cbt.text = "dB"

    def _compute(self):
        n_mels = len(self.spectrogram_data) if self.spectrogram_data else 1
        n_time = len(self.spectrogram_data[0]) if self.spectrogram_data and self.spectrogram_data[0] else 1
        self._box.xmin = 0
        self._box.xmax = n_time
        self._box.ymin = 0
        self._box.ymax = n_mels


# Data
np.random.seed(42)

sample_rate = 22050
duration = 3.0
t = np.linspace(0, duration, int(sample_rate * duration), endpoint=False)

# C-major arpeggio: C4 → E4 → G4 → C5 → G4 → E4 (ascending then descending)
note_names = ["C4", "E4", "G4", "C5", "G4", "E4"]
note_freqs = [261.6, 329.6, 392.0, 523.3, 392.0, 329.6]
note_duration = duration / len(note_freqs)
audio_signal = np.zeros_like(t)

for idx, freq in enumerate(note_freqs):
    start = int(idx * note_duration * sample_rate)
    end = int((idx + 1) * note_duration * sample_rate)
    note_t = t[start:end] - t[start]
    envelope = np.exp(-2.0 * note_t / note_duration)
    audio_signal[start:end] += envelope * np.sin(2 * np.pi * freq * note_t)
    audio_signal[start:end] += 0.5 * envelope * np.sin(2 * np.pi * 2 * freq * note_t)
    audio_signal[start:end] += 0.25 * envelope * np.sin(2 * np.pi * 3 * freq * note_t)

audio_signal += 0.02 * np.random.randn(len(t))

# Mel spectrogram computation (manual filterbank — no librosa dependency)
n_fft = 2048
hop_length = 512
n_mels_count = 128
fmax = sample_rate / 2.0
mel_min = 2595.0 * np.log10(1.0 + 0 / 700.0)
mel_max = 2595.0 * np.log10(1.0 + fmax / 700.0)
mel_points = np.linspace(mel_min, mel_max, n_mels_count + 2)
hz_points = 700.0 * (10.0 ** (mel_points / 2595.0) - 1.0)
bin_points = np.floor((n_fft + 1) * hz_points / sample_rate).astype(int)

mel_filters = np.zeros((n_mels_count, n_fft // 2 + 1))
for m in range(1, n_mels_count + 1):
    f_left, f_center, f_right = bin_points[m - 1], bin_points[m], bin_points[m + 1]
    for k in range(f_left, f_center):
        if f_center != f_left:
            mel_filters[m - 1, k] = (k - f_left) / (f_center - f_left)
    for k in range(f_center, f_right):
        if f_right != f_center:
            mel_filters[m - 1, k] = (f_right - k) / (f_right - f_center)

# STFT
_, times_stft, Zxx = signal.stft(audio_signal, fs=sample_rate, nperseg=n_fft, noverlap=n_fft - hop_length)
power_spectrum = np.abs(Zxx) ** 2

# Apply mel filterbank and convert to dB
mel_spec = mel_filters @ power_spectrum
mel_spec_db = 10 * np.log10(mel_spec + 1e-10)
db_max_val = np.max(mel_spec_db)
mel_spec_db = mel_spec_db - db_max_val
db_floor = -80.0
mel_spec_db = np.maximum(mel_spec_db, db_floor)

# Subsample for display resolution
time_step = max(1, len(times_stft) // 220)
mel_step = max(1, n_mels_count // 128)
mel_spec_display = mel_spec_db[::mel_step, ::time_step]
times_display = times_stft[::time_step]

# Y-axis tick positions (mel-scaled Hz labels)
tick_freqs_hz = [100, 200, 500, 1000, 2000, 4000, 8000]
mel_tick_positions = []
mel_tick_labels = []
for f in tick_freqs_hz:
    norm_pos = 2595.0 * np.log10(1.0 + f / 700.0) / mel_max
    if 0 <= norm_pos <= 1:
        mel_tick_positions.append(norm_pos)
        mel_tick_labels.append(f)

# Note onset annotations for storytelling
annotations = []
for idx, (name, freq) in enumerate(zip(note_names, note_freqs, strict=True)):
    time_frac = (idx * note_duration + note_duration * 0.08) / duration
    freq_norm = 2595.0 * np.log10(1.0 + freq / 700.0) / mel_max
    annotations.append((name, freq_norm, time_frac))

# Imprint sequential colormap: #4467A3 (low dB) → #009E73 (high dB)
imprint_seq = ["#4467A3", "#009E73"]

# Plot style with Imprint palette and theme-adaptive chrome
custom_style = Style(
    background=PAGE_BG,
    plot_background=PAGE_BG,
    foreground=INK,
    foreground_strong=INK,
    foreground_subtle=INK_MUTED,
    colors=IMPRINT_PALETTE,
    title_font_size=title_font_size,
    label_font_size=56,
    major_label_font_size=44,
    legend_font_size=44,
    value_font_size=36,
    font_family="sans-serif",
)

# Chart — 3200×1800 landscape canvas (hard rule: no deviation)
chart = MelSpectrogramChart(
    width=3200,
    height=1800,
    style=custom_style,
    title=title_str,
    spectrogram_data=mel_spec_display.tolist(),
    time_bins=times_display.tolist(),
    mel_freq_labels=mel_tick_labels,
    mel_freq_positions=mel_tick_positions,
    note_annotations=annotations,
    db_min=db_floor,
    db_max=0,
    colormap=imprint_seq,
    show_legend=False,
    margin=40,
    margin_top=120,
    margin_bottom=30,
    show_x_labels=False,
    show_y_labels=False,
)

chart.add("", [0])

# Save PNG + HTML (pygal is interactive)
chart.render_to_file(f"plot-{THEME}.svg")
chart.render_to_png(f"plot-{THEME}.png")

html_content = f"""<!DOCTYPE html>
<html>
<head>
    <meta charset="utf-8">
    <title>spectrogram-mel - python - pygal - anyplot.ai</title>
    <style>
        body {{ margin: 0; display: flex; justify-content: center; align-items: center;
               min-height: 100vh; background: {PAGE_BG}; }}
        .chart {{ max-width: 100%; height: auto; }}
    </style>
</head>
<body>
    <figure class="chart">
        {chart.render(is_unicode=True)}
    </figure>
</body>
</html>
"""

with open(f"plot-{THEME}.html", "w", encoding="utf-8") as f:
    f.write(html_content)
Runnable source as JSON, for any HTTP client: https://api.anyplot.ai/specs/spectrogram-mel/pygal/code. Any spec id and library id listed in llms-full.txt fit the same URL shape; every URL below is complete and callable.
{
  "spec_id": "spectrogram-mel",
  "language": "python",
  "library": "pygal",
  "page": "https://anyplot.ai/spectrogram-mel/python/pygal",
  "hub": "https://anyplot.ai/spectrogram-mel",
  "code_json": "https://api.anyplot.ai/specs/spectrogram-mel/pygal/code",
  "spec_json": "https://api.anyplot.ai/specs/spectrogram-mel",
  "render_light_png": "https://storage.googleapis.com/anyplot-images/plots/spectrogram-mel/python/pygal/plot-light.png",
  "render_dark_png": "https://storage.googleapis.com/anyplot-images/plots/spectrogram-mel/python/pygal/plot-dark.png",
  "interactive_light_html": "https://storage.googleapis.com/anyplot-images/plots/spectrogram-mel/python/pygal/plot-light.html",
  "interactive_dark_html": "https://storage.googleapis.com/anyplot-images/plots/spectrogram-mel/python/pygal/plot-dark.html",
  "quality_score": 80.0,
  "license": "MIT",
  "guide": "https://anyplot.ai/llms.txt"
}
Part of Mel-Spectrogram for Audio Analysis on anyplot.ai.