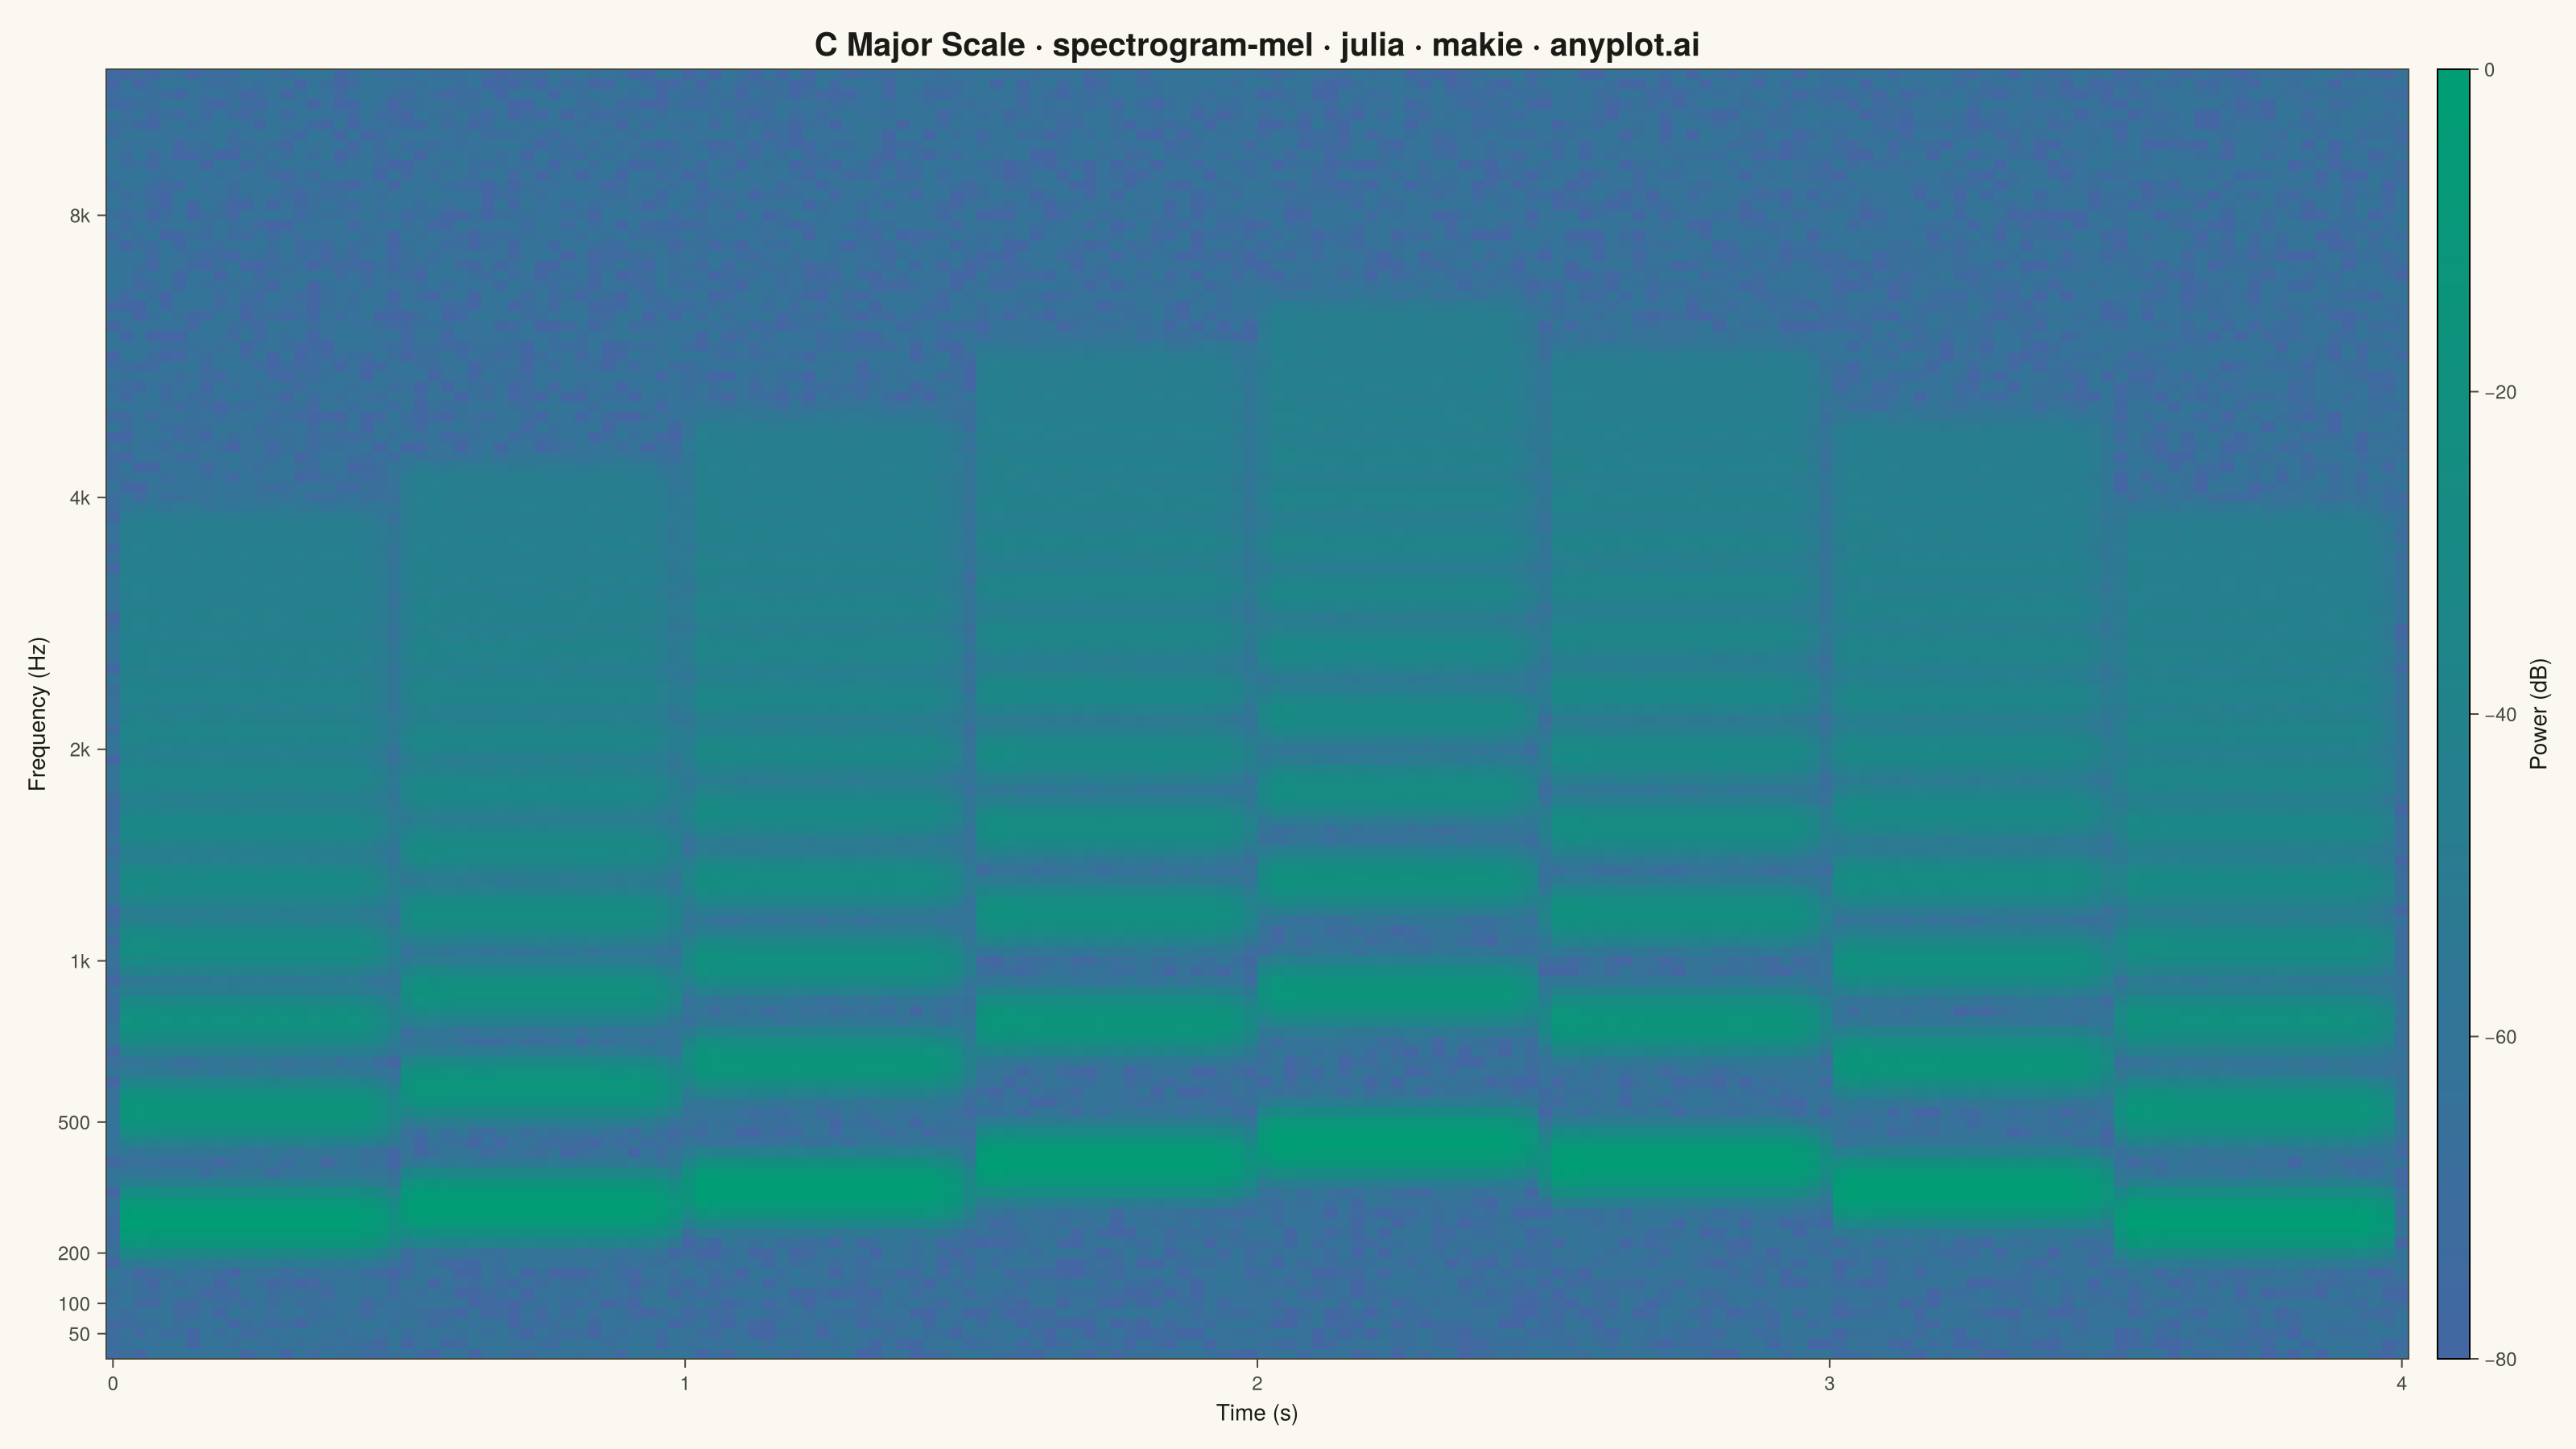
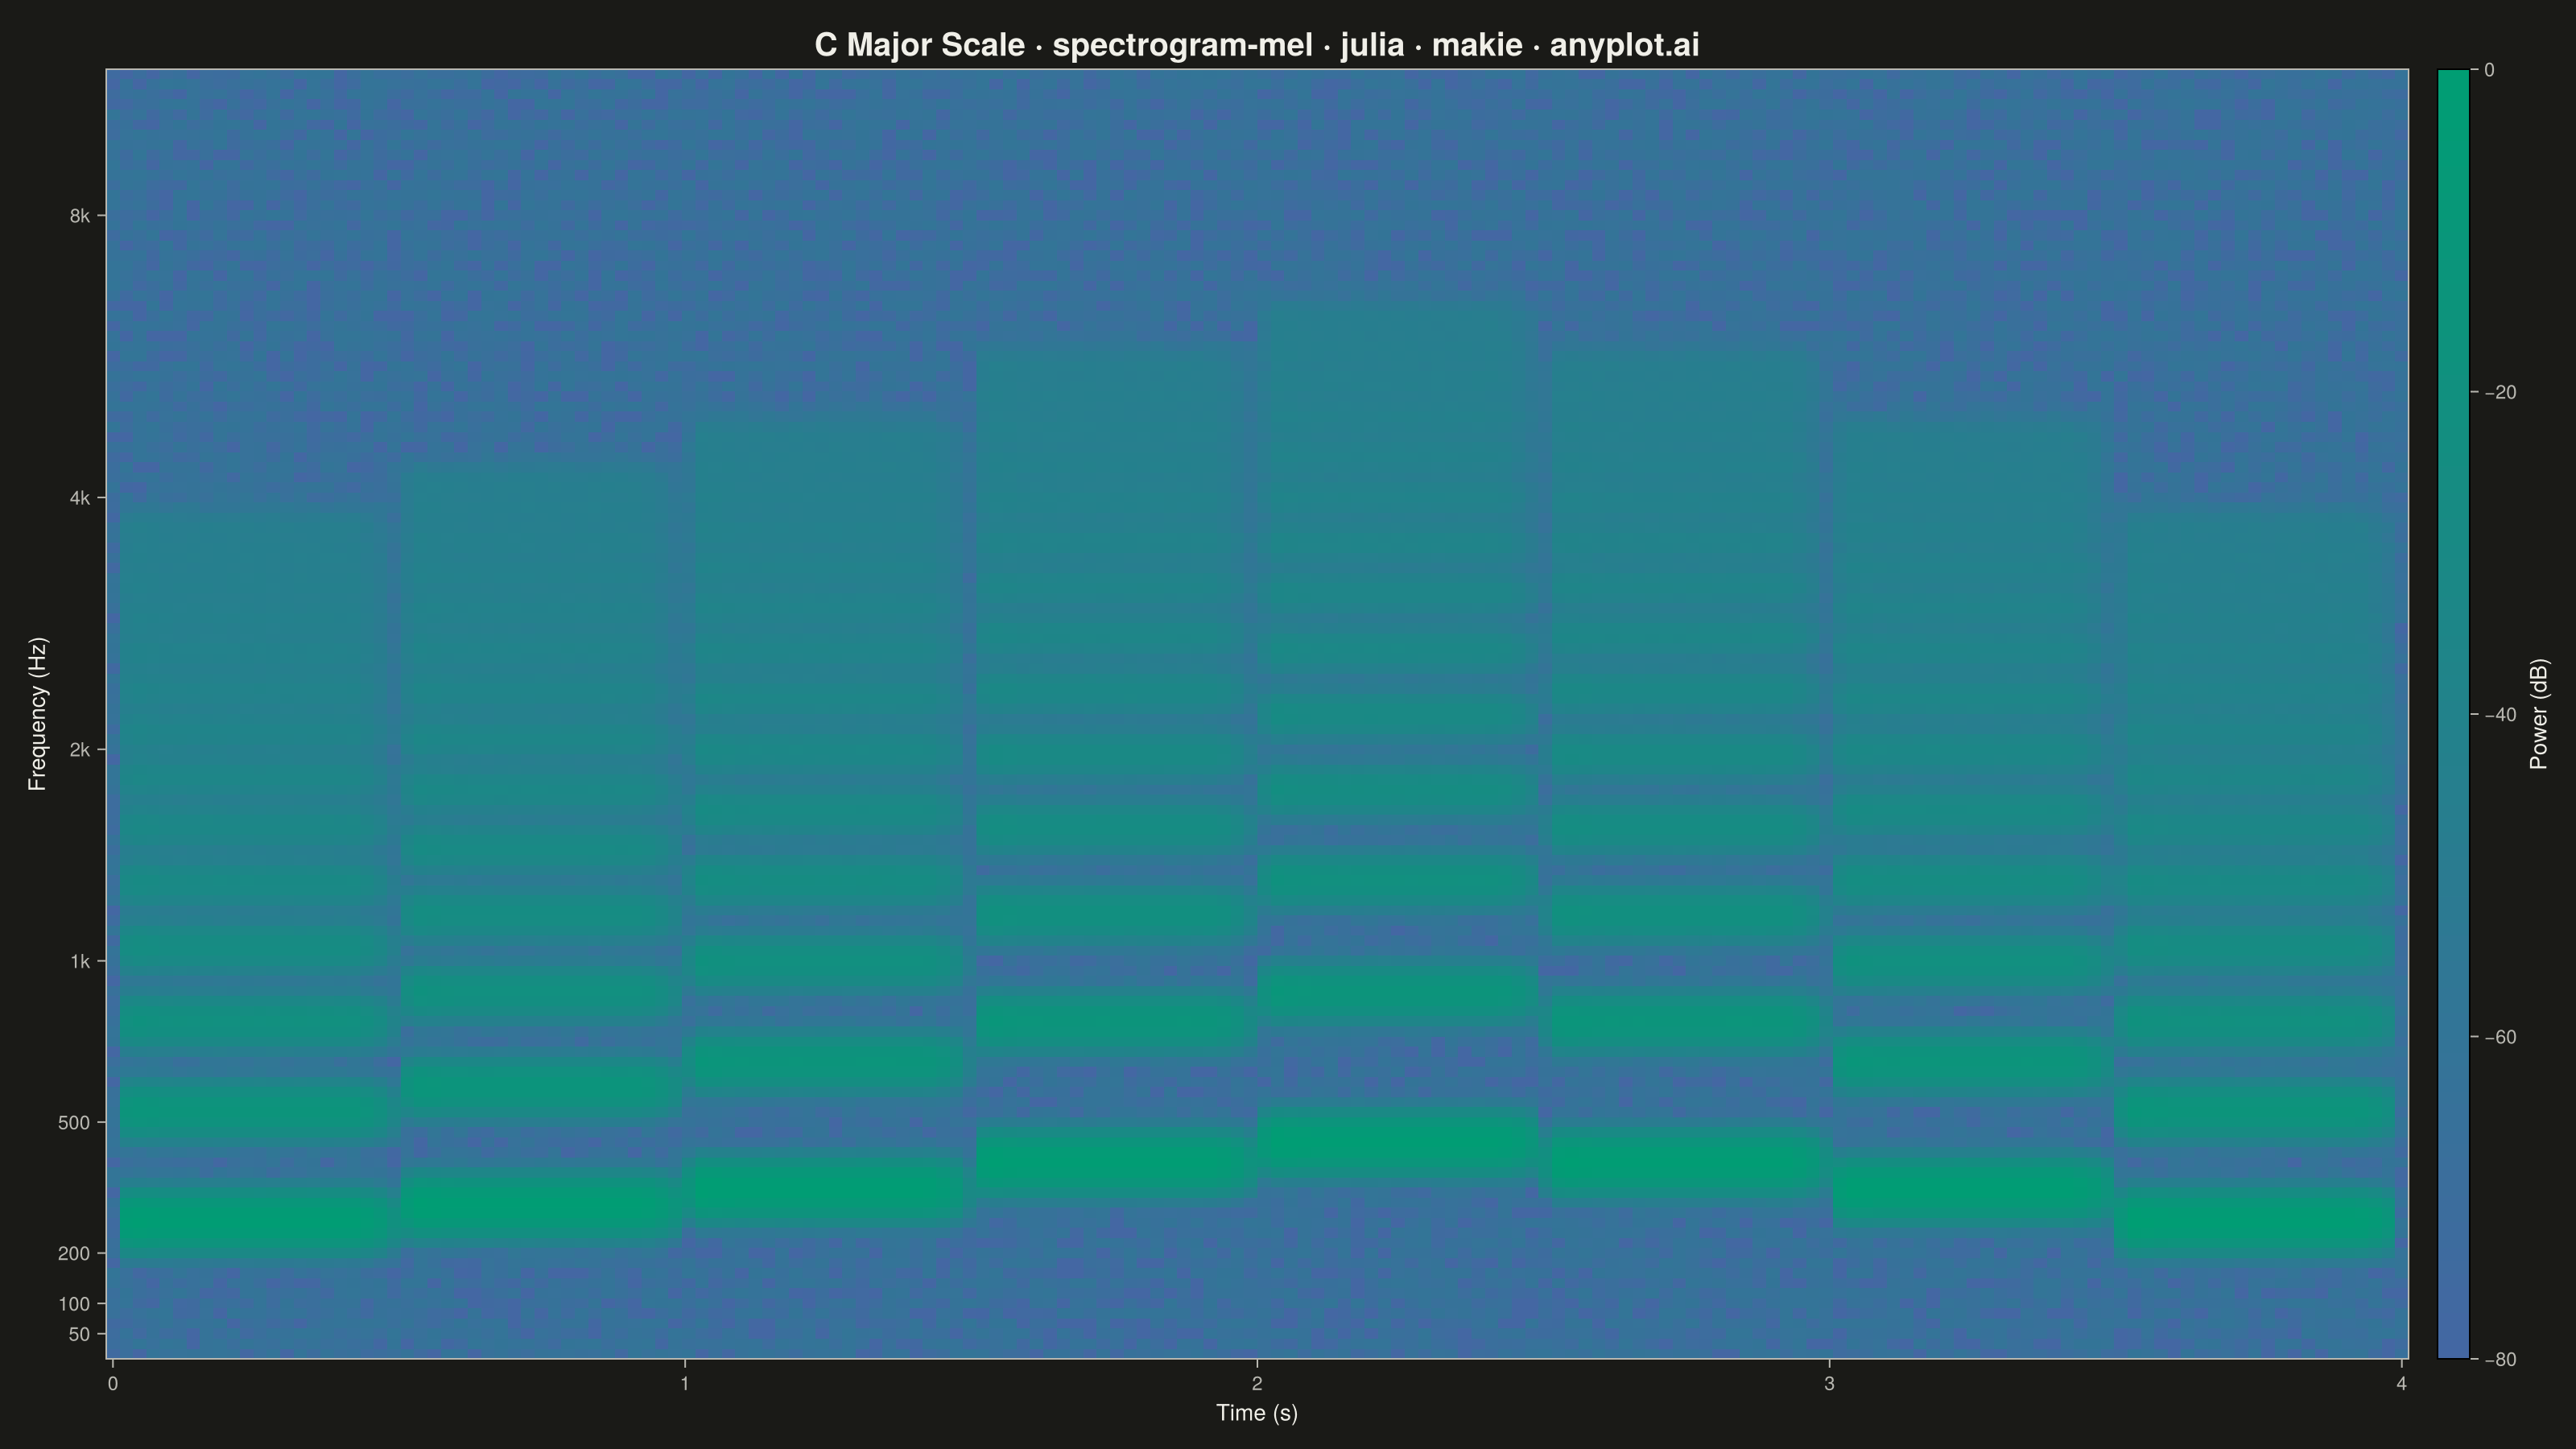
The same plot in 14 other libraries — Python: Altair, Bokeh, lets-plot, Matplotlib, Plotly, plotnine, Pygal, Seaborn; R: ggplot2; JavaScript: Chart.js, D3.js, Apache ECharts, Highcharts, MUI X Charts. Compare all 15 side by side: Mel-Spectrogram for Audio Analysis in Python, R, Julia and JavaScript.
A mel-spectrogram displaying the power spectrum of an audio signal with the frequency axis warped to the mel scale, which approximates human auditory perception. Unlike a standard spectrogram with a linear frequency axis, the mel-spectrogram compresses higher frequencies and expands lower frequencies, making perceptually similar sounds visually closer together. This is the foundational input representation for modern audio machine learning pipelines including speech recognition, speaker identification, and music information retrieval.
# anyplot.ai
# spectrogram-mel: Mel-Spectrogram for Audio Analysis
# Library: makie 0.22.10 | Julia 1.11.9
# Quality: 88/100 | Created: 2026-06-03

using CairoMakie
using Colors
using Random

Random.seed!(42)

# Theme tokens
const THEME       = get(ENV, "ANYPLOT_THEME", "light")
const PAGE_BG     = THEME == "light" ? colorant"#FAF8F1" : colorant"#1A1A17"
const INK         = THEME == "light" ? colorant"#1A1A17" : colorant"#F0EFE8"
const INK_SOFT    = THEME == "light" ? colorant"#4A4A44" : colorant"#B8B7B0"

# Imprint sequential colormap — canonical imprint_seq direction: green (low) → blue (high)
const ANYPLOT_SEQ = cgrad([colorant"#009E73", colorant"#4467A3"])

# Mel scale helpers
hz_to_mel(hz) = 2595.0 * log10(1.0 + hz / 700.0)
mel_to_hz(mel) = 700.0 * (10.0^(mel / 2595.0) - 1.0)

# Audio / spectrogram parameters
const SR       = 22050
const N_MELS   = 128
const HOP      = 512
const DURATION = 4.0

# Mel filterbank: evenly spaced in mel, converted back to Hz
const MEL_MIN   = hz_to_mel(20.0)
const MEL_MAX   = hz_to_mel(SR / 2.0)
const MEL_STEP  = (MEL_MAX - MEL_MIN) / (N_MELS - 1)
const MEL_FREQS = [mel_to_hz(MEL_MIN + (m - 1) * MEL_STEP) for m in 1:N_MELS]

# Time axis
const N_FRAMES  = round(Int, DURATION * SR / HOP)
const T_FRAMES  = collect(range(0.0, DURATION, length=N_FRAMES))

# Precompute mel-band centres for Gaussian response
const CENTER_MELS = [MEL_MIN + (m - 1) * MEL_STEP for m in 1:N_MELS]
const BW_MEL      = 1.2 * MEL_STEP   # filter bandwidth — narrow for sharp harmonic bands

# Synthesize mel-spectrogram: C major scale up and back down
# C4 D4 E4 G4 A4 G4 E4 C4
note_freqs = [261.63, 293.66, 329.63, 392.00, 440.00, 392.00, 329.63, 261.63]
note_dur   = DURATION / length(note_freqs)
n_harm     = 14   # harmonics in the overtone series

mel_spec = zeros(N_MELS, N_FRAMES)

for (ni, f0) in enumerate(note_freqs)
    t_start = (ni - 1) * note_dur
    t_end   = ni * note_dur
    active  = findall(t -> t_start <= t < t_end, T_FRAMES)
    isempty(active) && continue

    for h in 1:n_harm
        f = f0 * h
        f >= SR / 2 && break

        amp   = (1.0 / h)^2.0          # steeper harmonic decay for clear band contrast
        f_mel = hz_to_mel(f)
        resp  = amp .* exp.(-0.5 .* ((f_mel .- CENTER_MELS) ./ BW_MEL).^2)

        for fi in active
            rel_t = (T_FRAMES[fi] - t_start) / note_dur
            # ADSR envelope: fast attack, slight decay, sustain, release
            env = rel_t < 0.06 ? rel_t / 0.06 :
                  rel_t < 0.18 ? 1.0 - 0.2 * (rel_t - 0.06) / 0.12 :
                  rel_t < 0.85 ? 0.8 :
                  0.8 * (1.0 - (rel_t - 0.85) / 0.15)
            mel_spec[:, fi] .+= resp .* env
        end
    end
end

# Add a very low noise floor for realistic background texture
mel_spec .+= 0.001 .* rand(N_MELS, N_FRAMES)

# Convert to dB scale and normalise so the peak is 0 dB
mel_spec_db = 20.0 .* log10.(mel_spec .+ 1e-6)
mel_spec_db .-= maximum(mel_spec_db)
clamp!(mel_spec_db, -80.0, 0.0)

# Plot
fig = Figure(
    size            = (1600, 900),
    figure_padding  = (10, 10, 10, 25),  # extra top padding for title breathing room
    fontsize        = 14,
    backgroundcolor = PAGE_BG,
)

title_str = "C Major Scale · spectrogram-mel · julia · makie · anyplot.ai"
ax = Axis(
    fig[1, 1];
    title            = title_str,
    titlesize        = 20,
    titlecolor       = INK,
    xlabel           = "Time (s)",
    xlabelsize       = 14,
    xlabelcolor      = INK,
    ylabel           = "Frequency (Hz)",
    ylabelsize       = 14,
    ylabelcolor      = INK,
    xticklabelsize   = 12,
    yticklabelsize   = 12,
    xticklabelcolor  = INK_SOFT,
    yticklabelcolor  = INK_SOFT,
    xtickcolor       = INK_SOFT,
    ytickcolor       = INK_SOFT,
    backgroundcolor  = PAGE_BG,
    leftspinecolor   = INK_SOFT,
    bottomspinecolor = INK_SOFT,
    topspinecolor    = INK_SOFT,
    rightspinecolor  = INK_SOFT,
    xgridvisible     = false,
    ygridvisible     = false,
)

# mel_spec_db is (N_MELS, N_FRAMES); heatmap expects (N_FRAMES, N_MELS)
# highclip/lowclip set here so the Colorbar inherits them (Makie requirement)
hm = heatmap!(ax, T_FRAMES, 1:N_MELS, mel_spec_db';
    colormap   = ANYPLOT_SEQ,
    colorrange = (-80.0, 0.0),
    highclip   = colorant"#4467A3",
    lowclip    = colorant"#009E73",
)

# Y-axis: show Hz labels at perceptually meaningful frequency landmarks
tick_hz  = [50, 100, 200, 500, 1000, 2000, 4000, 8000]
tick_idx = Float64.([argmin(abs.(MEL_FREQS .- hz)) for hz in tick_hz])
tick_lbl = [hz >= 1000 ? "$(hz ÷ 1000)k" : "$hz" for hz in tick_hz]
ax.yticks = (tick_idx, tick_lbl)

Colorbar(fig[1, 2], hm;
    label          = "Power (dB)",
    labelsize      = 14,
    labelcolor     = INK,
    ticklabelsize  = 12,
    ticklabelcolor = INK_SOFT,
    tickcolor      = INK_SOFT,
    width          = 28,
    ticks          = WilkinsonTicks(6),
)

save("plot-$(THEME).png", fig; px_per_unit = 2)
Runnable source as JSON, for any HTTP client: https://api.anyplot.ai/specs/spectrogram-mel/makie/code. Any spec id and library id listed in llms-full.txt fit the same URL shape; every URL below is complete and callable.
{
  "spec_id": "spectrogram-mel",
  "language": "julia",
  "library": "makie",
  "page": "https://anyplot.ai/spectrogram-mel/julia/makie",
  "hub": "https://anyplot.ai/spectrogram-mel",
  "code_json": "https://api.anyplot.ai/specs/spectrogram-mel/makie/code",
  "spec_json": "https://api.anyplot.ai/specs/spectrogram-mel",
  "render_light_png": "https://storage.googleapis.com/anyplot-images/plots/spectrogram-mel/julia/makie/plot-light.png",
  "render_dark_png": "https://storage.googleapis.com/anyplot-images/plots/spectrogram-mel/julia/makie/plot-dark.png",
  "quality_score": 88.0,
  "license": "MIT",
  "guide": "https://anyplot.ai/llms.txt"
}
Part of Mel-Spectrogram for Audio Analysis on anyplot.ai.