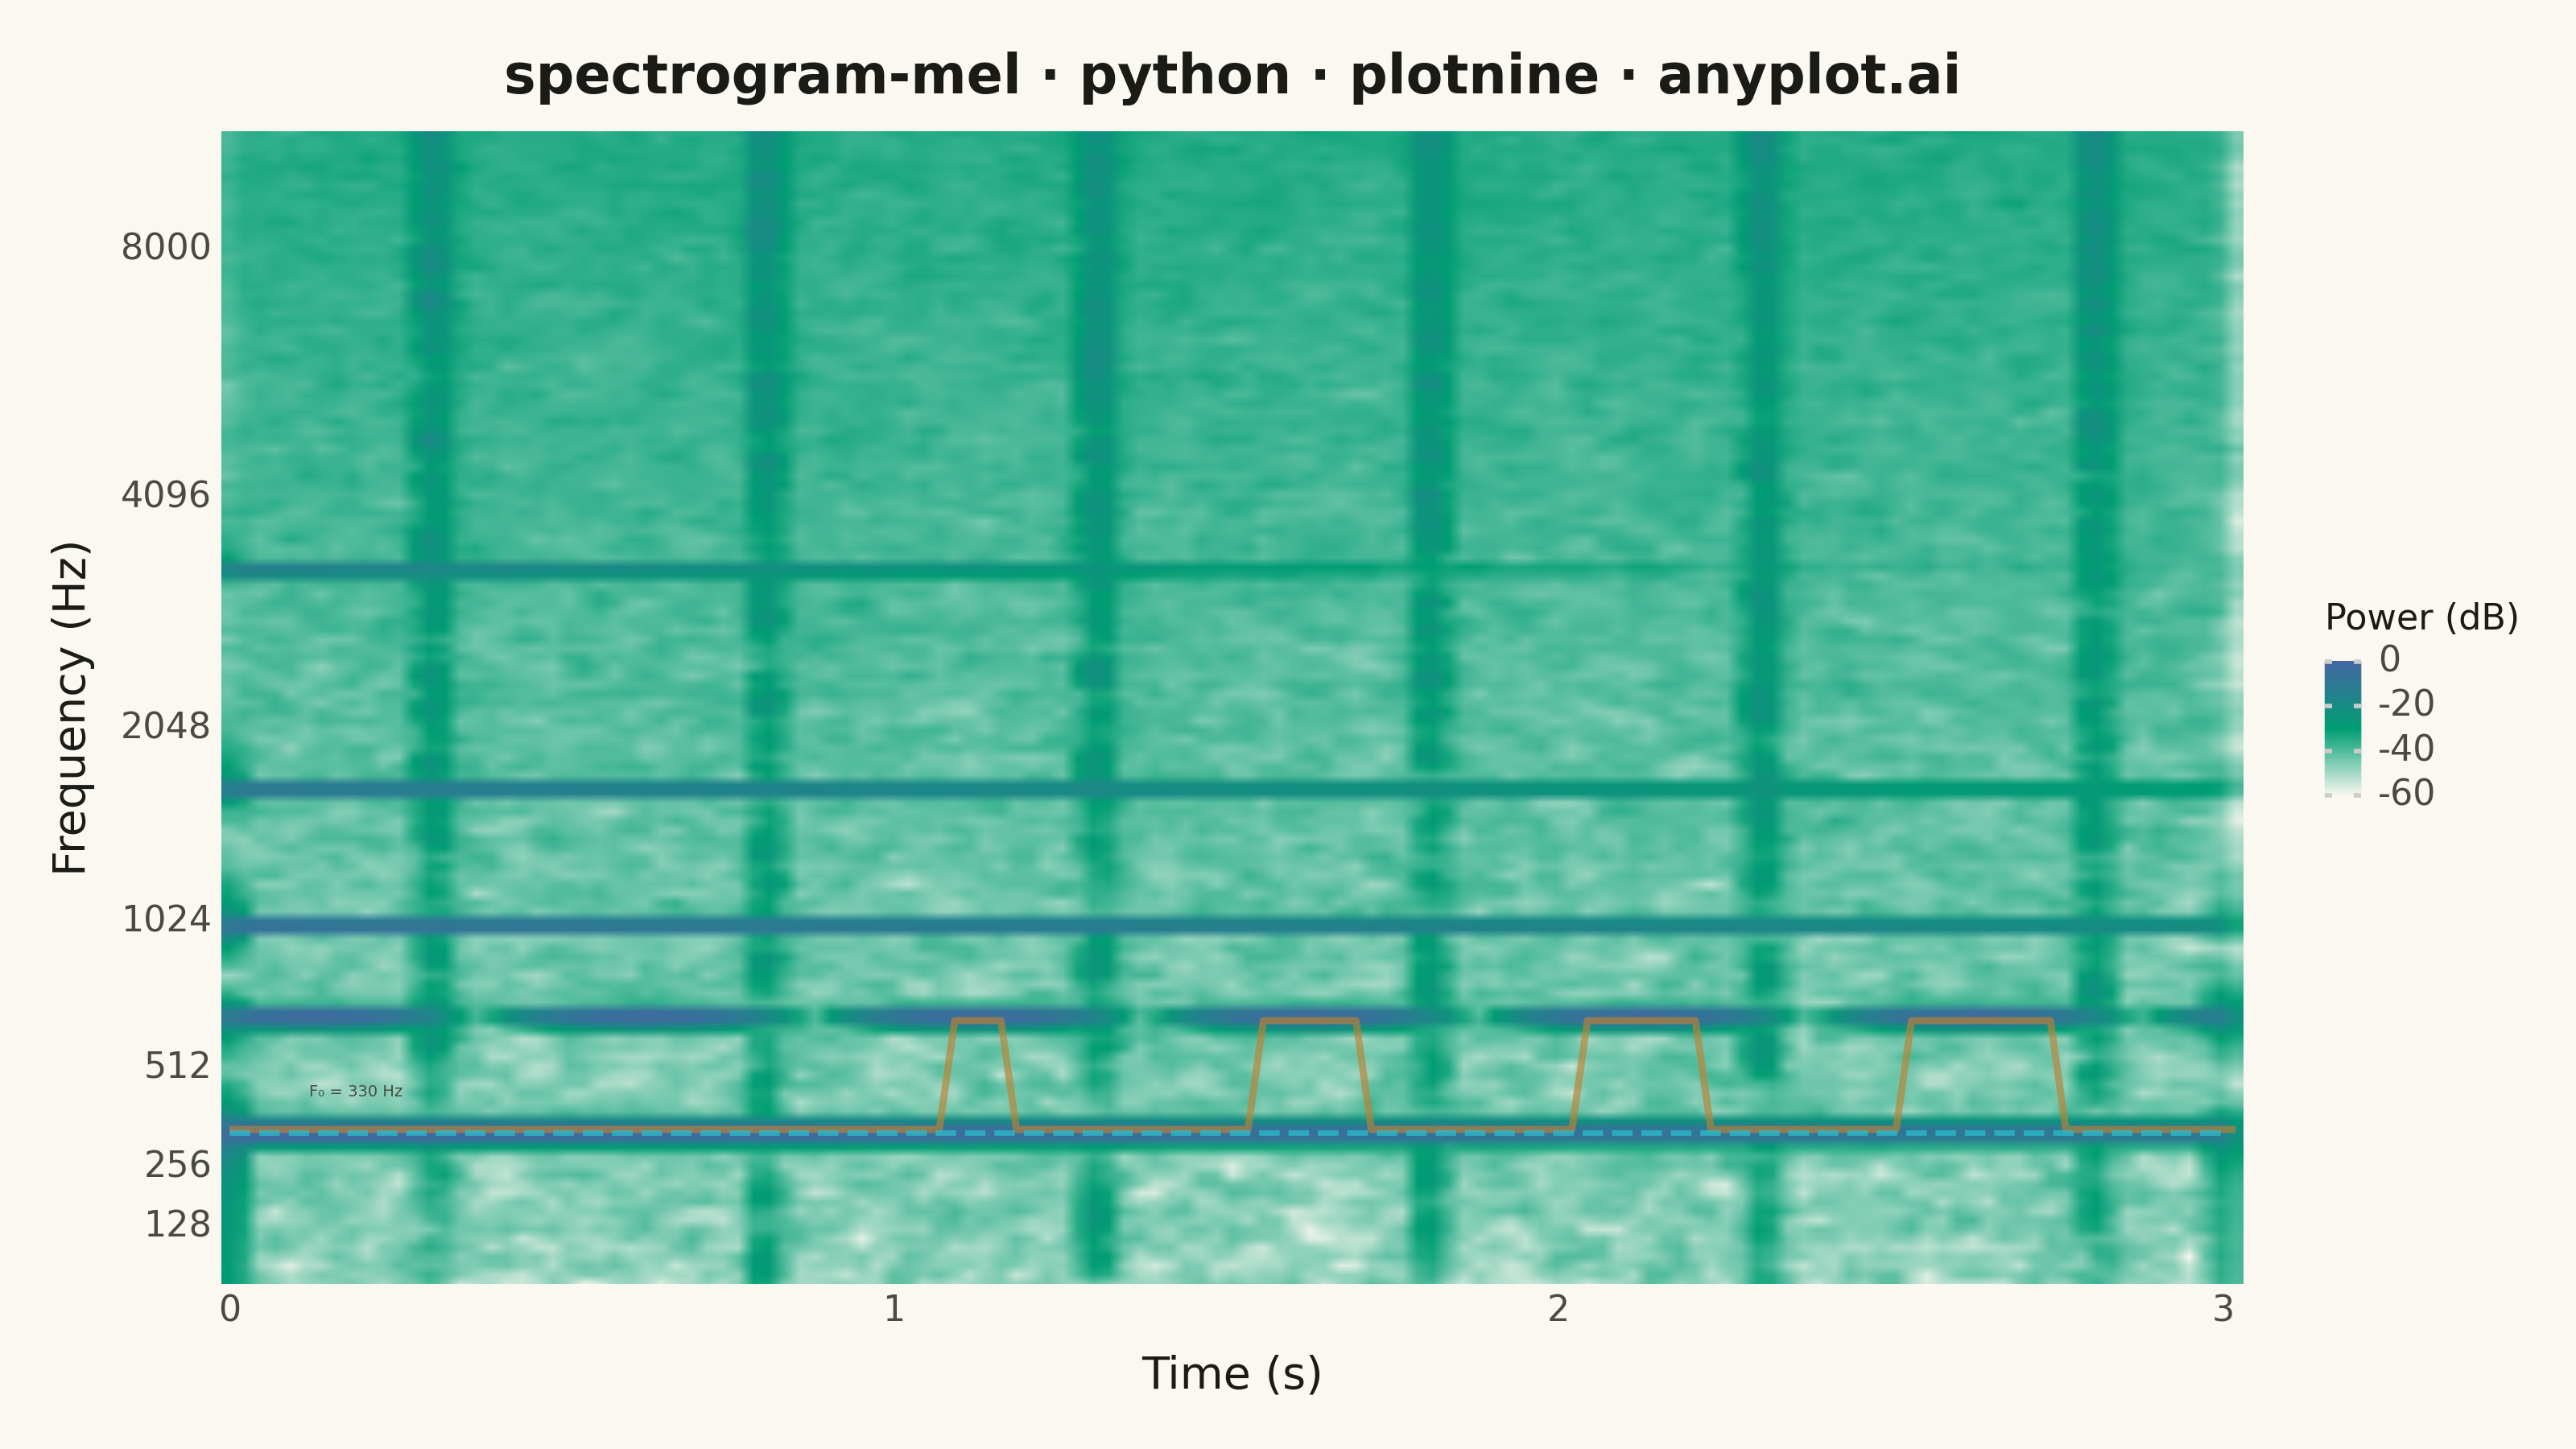
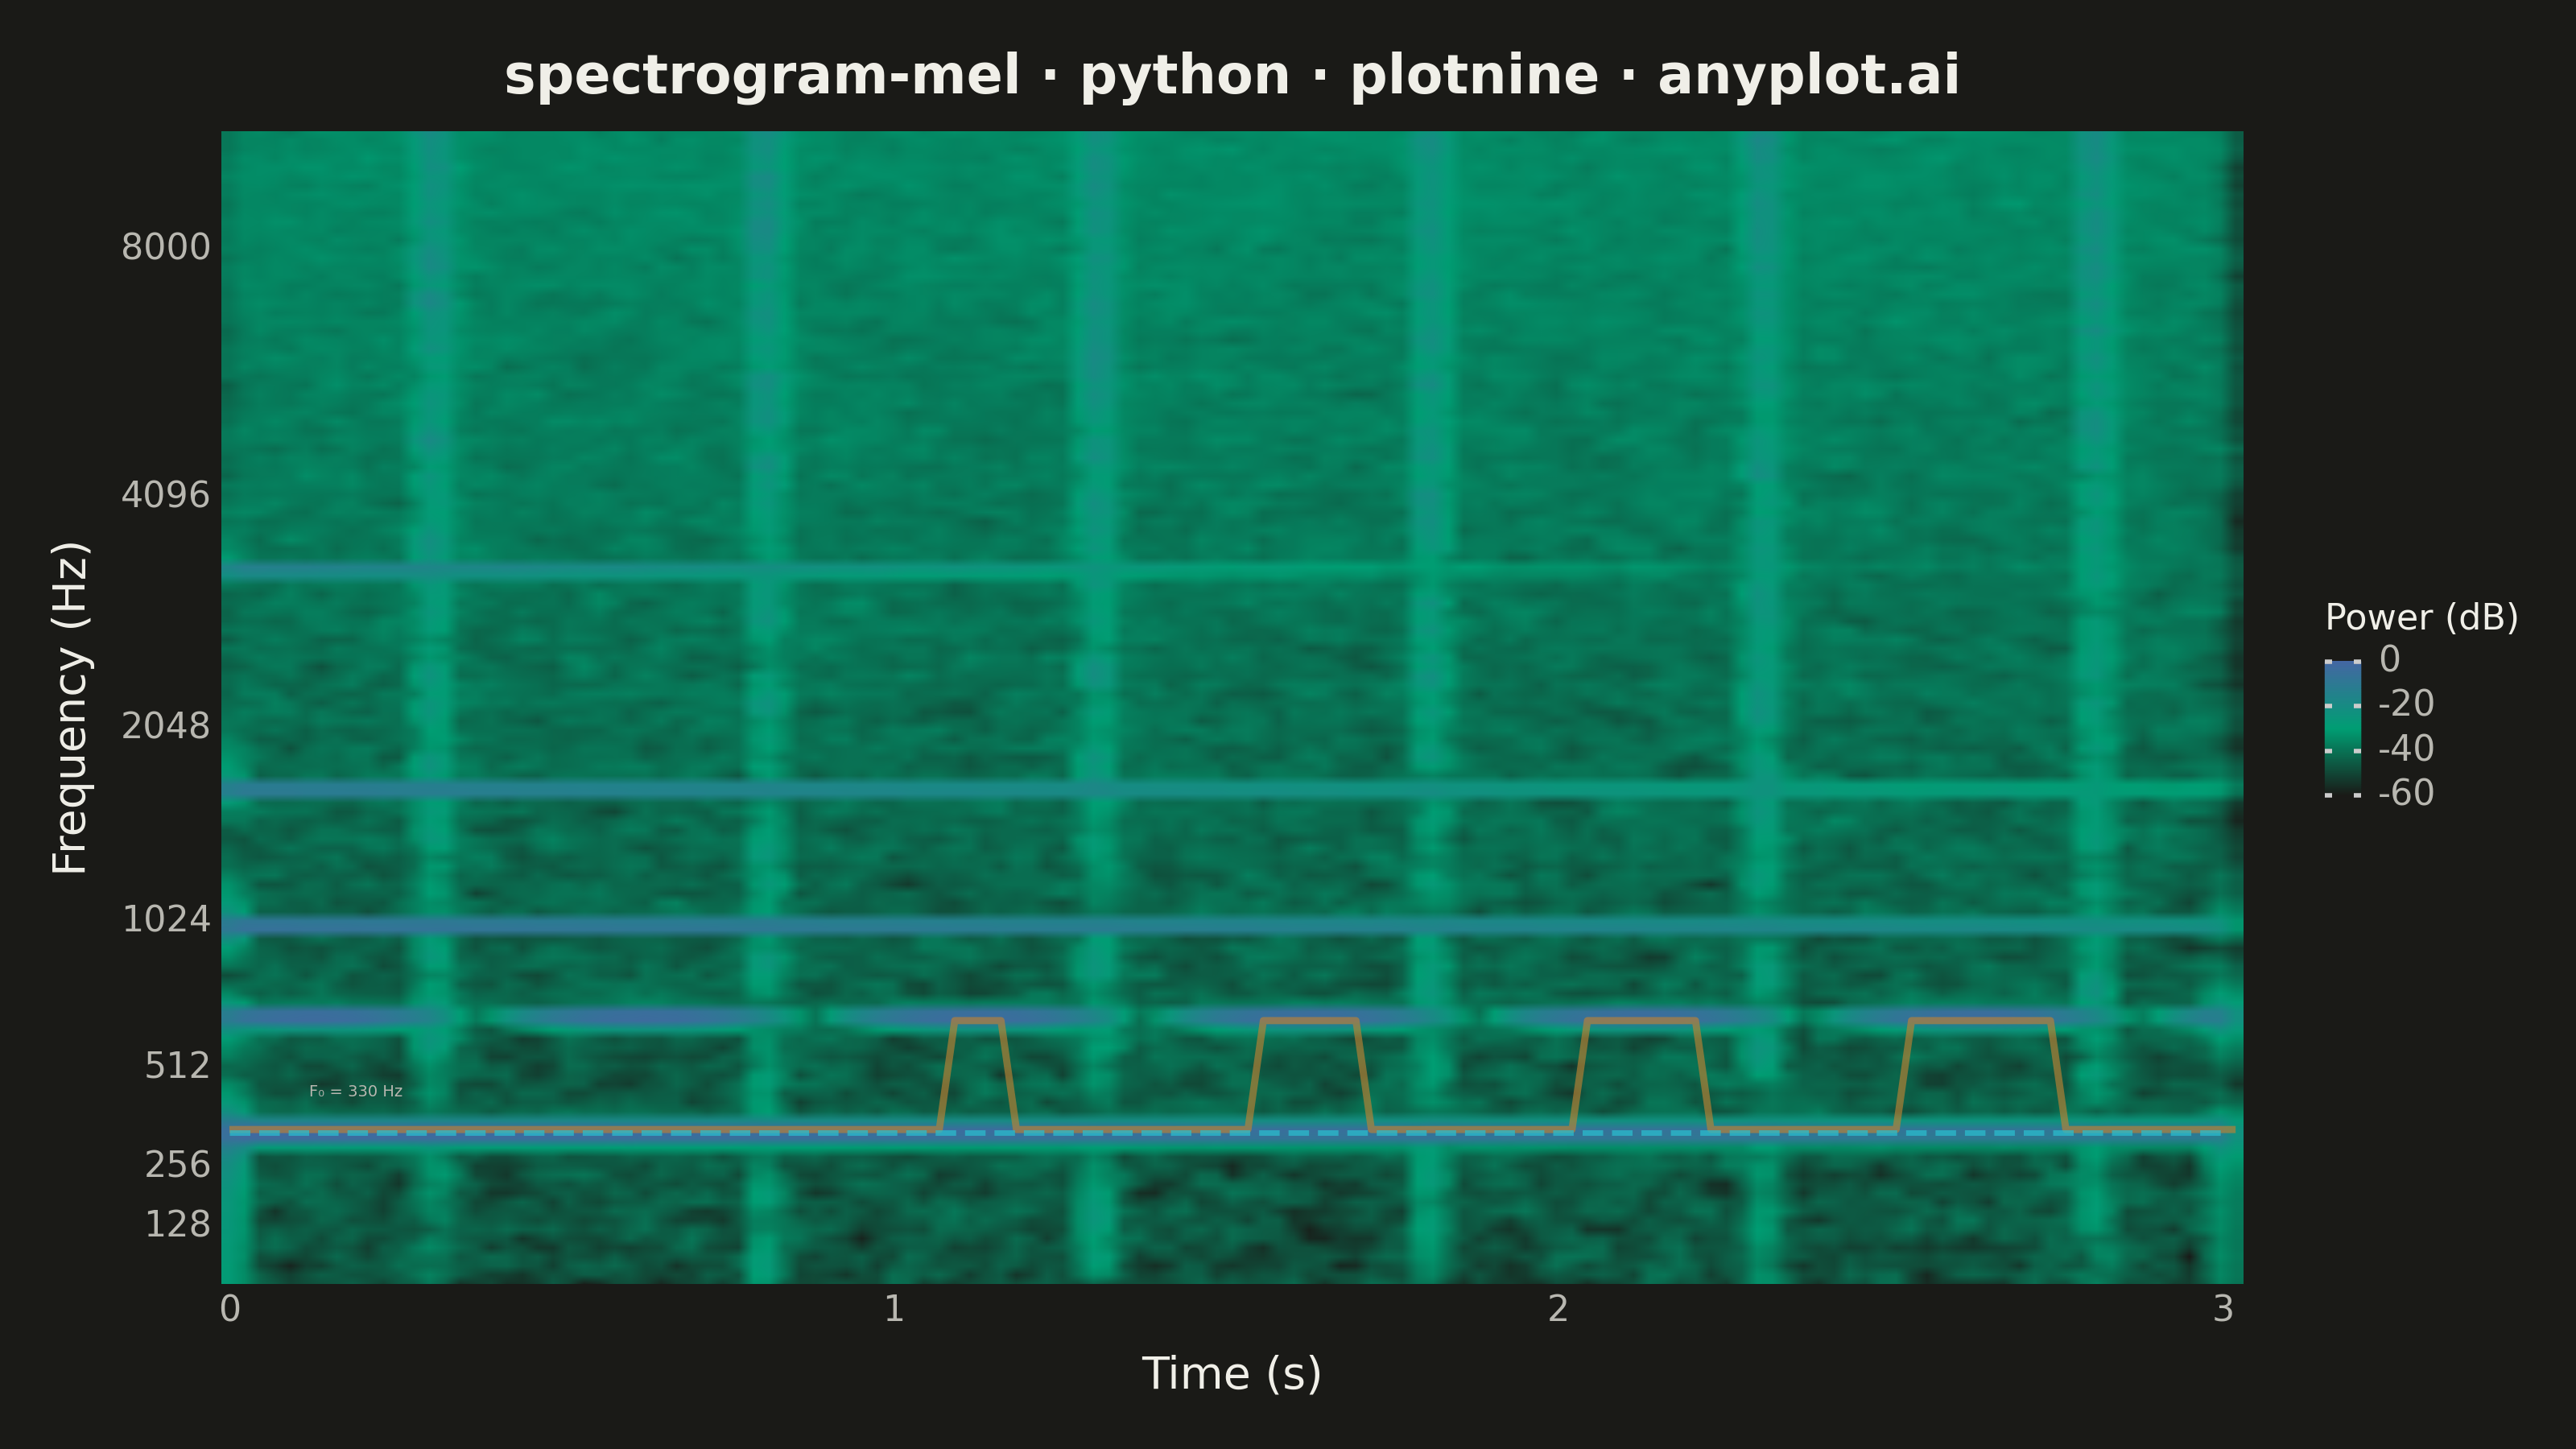
A mel-spectrogram displaying the power spectrum of an audio signal with the frequency axis warped to the mel scale, which approximates human auditory perception. Unlike a standard spectrogram with a linear frequency axis, the mel-spectrogram compresses higher frequencies and expands lower frequencies, making perceptually similar sounds visually closer together. This is the foundational input representation for modern audio machine learning pipelines including speech recognition, speaker identification, and music information retrieval.
""" anyplot.ai
spectrogram-mel: Mel-Spectrogram for Audio Analysis
Library: plotnine 0.15.5 | Python 3.13.13
Quality: 91/100 | Updated: 2026-06-03
"""

import os
import sys

import numpy as np
import pandas as pd


# Work around naming conflict with plotnine.py script and plotnine package
script_dir = os.path.dirname(os.path.abspath(__file__))
if script_dir in sys.path:
    sys.path.remove(script_dir)
if "" in sys.path:
    sys.path.remove("")
if "." in sys.path:
    sys.path.remove(".")

from plotnine import (
    aes,
    coord_cartesian,
    element_blank,
    element_rect,
    element_text,
    geom_line,
    geom_raster,
    geom_segment,
    geom_text,
    ggplot,
    guide_colorbar,
    guides,
    labs,
    scale_fill_gradientn,
    scale_x_continuous,
    scale_y_continuous,
    theme,
    theme_minimal,
)
from scipy.signal import stft


# Theme tokens (Imprint palette — theme-adaptive chrome)
THEME = os.getenv("ANYPLOT_THEME", "light")
PAGE_BG = "#FAF8F1" if THEME == "light" else "#1A1A17"
ELEVATED_BG = "#FFFDF6" if THEME == "light" else "#242420"
INK = "#1A1A17" if THEME == "light" else "#F0EFE8"
INK_SOFT = "#4A4A44" if THEME == "light" else "#B8B7B0"

# Imprint categorical palette — 8 hues, theme-independent
IMPRINT_PALETTE = ["#009E73", "#C475FD", "#4467A3", "#BD8233", "#AE3030", "#2ABCCD", "#954477", "#99B314"]

# Data — synthesize 3s audio with 330 Hz fundamental, harmonics, and rhythmic noise bursts
np.random.seed(42)
sample_rate = 22050
duration = 3.0
n_samples = int(sample_rate * duration)
t = np.linspace(0, duration, n_samples, endpoint=False)

fundamental = 330  # E4 — distinct from sibling implementations using 220 Hz
signal = (
    0.6 * np.sin(2 * np.pi * fundamental * t) * np.exp(-0.35 * t)
    + 0.45 * np.sin(2 * np.pi * 660 * t) * (0.5 + 0.5 * np.sin(2 * np.pi * 2.0 * t))
    + 0.3 * np.sin(2 * np.pi * 990 * t) * np.exp(-0.55 * t)
    + 0.2 * np.sin(2 * np.pi * 1650 * t) * np.exp(-0.8 * t)
    + 0.12 * np.sin(2 * np.pi * 3300 * t) * np.exp(-1.2 * t)
    + 0.08 * np.random.randn(n_samples) * 0.5
)

# Rhythmic noise bursts simulating percussion attacks every ~500 ms
burst_times = [0.3, 0.8, 1.3, 1.8, 2.3, 2.8]
burst_len = int(0.07 * sample_rate)
for bt in burst_times:
    idx = int(bt * sample_rate)
    if idx + burst_len < n_samples:
        burst = np.random.randn(burst_len) * np.exp(-np.linspace(0, 5, burst_len))
        signal[idx : idx + burst_len] += 0.45 * burst

# STFT
n_fft = 2048
hop_length = 512
_, time_bins, Zxx = stft(signal, fs=sample_rate, nperseg=n_fft, noverlap=n_fft - hop_length)
power_spec = np.abs(Zxx) ** 2

# Mel filterbank (vectorized — no librosa dependency)
n_mels = 128
freq_bins = np.linspace(0, sample_rate / 2, power_spec.shape[0])

mel_low = 2595.0 * np.log10(1.0 + 0 / 700.0)
mel_high = 2595.0 * np.log10(1.0 + (sample_rate / 2) / 700.0)
mel_points = np.linspace(mel_low, mel_high, n_mels + 2)
hz_points = 700.0 * (10.0 ** (mel_points / 2595.0) - 1.0)

lower = hz_points[:-2, np.newaxis]
center = hz_points[1:-1, np.newaxis]
upper = hz_points[2:, np.newaxis]
freqs = freq_bins[np.newaxis, :]

rising = np.where((freqs >= lower) & (freqs <= center) & (center != lower), (freqs - lower) / (center - lower), 0.0)
falling = np.where((freqs > center) & (freqs <= upper) & (upper != center), (upper - freqs) / (upper - center), 0.0)
filterbank = rising + falling

# Apply filterbank and convert to dB
mel_spec = filterbank @ power_spec
mel_spec_db = 10 * np.log10(np.maximum(mel_spec, 1e-10))
mel_spec_db -= mel_spec_db.max()

# Build long-form DataFrame for geom_raster
mel_center_freqs = 700.0 * (10.0 ** (mel_points[1:-1] / 2595.0) - 1.0)
time_grid, mel_idx_grid = np.meshgrid(time_bins, np.arange(n_mels))
df = pd.DataFrame({"Time (s)": time_grid.ravel(), "mel_band": mel_idx_grid.ravel(), "Power (dB)": mel_spec_db.ravel()})

# Y-axis ticks: map Hz reference values to mel band indices
y_ticks_hz = [128, 256, 512, 1024, 2048, 4096, 8000]
y_ticks_hz = [f for f in y_ticks_hz if f <= sample_rate / 2]
y_ticks_band = np.interp(y_ticks_hz, mel_center_freqs, np.arange(n_mels))

# Spectral peak trajectory — smoothed argmax per time frame (second data layer)
peak_raw = np.argmax(mel_spec_db, axis=0).astype(float)
peak_smooth = pd.Series(peak_raw).rolling(window=7, center=True, min_periods=1).median().values
df_peak = pd.DataFrame({"time": time_bins, "mel_band": peak_smooth})

# Fundamental frequency reference line and label
f0_band = float(np.interp(fundamental, mel_center_freqs, np.arange(n_mels)))
df_refline = pd.DataFrame({"x": [0.0], "xend": [duration], "y": [f0_band], "yend": [f0_band]})
df_label = pd.DataFrame({"x": [0.12], "y": [f0_band + 4.5], "label": ["F₀ = 330 Hz"]})

# Imprint sequential colormap: PAGE_BG (silence) → brand green → blue (energy)
spectrogram_colors = [PAGE_BG, "#009E73", "#4467A3"]

# Plot
title = "spectrogram-mel · python · plotnine · anyplot.ai"
plot = (
    ggplot(df, aes(x="Time (s)", y="mel_band", fill="Power (dB)"))
    + geom_raster(interpolate=True)
    + scale_fill_gradientn(colors=spectrogram_colors, name="Power (dB)")
    + guides(fill=guide_colorbar(nbin=256))
    # Spectral peak trajectory — grammar-of-graphics second data layer
    + geom_line(
        aes(x="time", y="mel_band"),
        data=df_peak,
        inherit_aes=False,
        color=IMPRINT_PALETTE[3],  # ochre — contrasts with green→blue colormap
        size=0.9,
        alpha=0.65,
    )
    # F0 reference line — dashed, clearly visible
    + geom_segment(
        aes(x="x", xend="xend", y="y", yend="yend"),
        data=df_refline,
        inherit_aes=False,
        color=IMPRINT_PALETTE[5],  # cyan — distinct from green heatmap, CVD-accessible
        alpha=0.75,
        size=0.7,
        linetype="dashed",
    )
    # F0 label
    + geom_text(aes(x="x", y="y", label="label"), data=df_label, inherit_aes=False, color=INK_SOFT, size=3.5, ha="left")
    + scale_x_continuous(expand=(0, 0))
    + scale_y_continuous(breaks=y_ticks_band.tolist(), labels=[str(f) for f in y_ticks_hz], expand=(0, 0))
    + coord_cartesian(ylim=(0, n_mels - 1))
    + labs(x="Time (s)", y="Frequency (Hz)", title=title)
    + theme_minimal()
    + theme(
        figure_size=(8, 4.5),
        text=element_text(family="sans-serif"),
        plot_title=element_text(size=12, ha="center", color=INK, weight="bold"),
        axis_title_x=element_text(size=10, color=INK),
        axis_title_y=element_text(size=10, color=INK),
        axis_text_x=element_text(size=8, color=INK_SOFT),
        axis_text_y=element_text(size=8, color=INK_SOFT),
        legend_title=element_text(size=8, color=INK),
        legend_text=element_text(size=8, color=INK_SOFT),
        legend_position="right",
        legend_key_height=30,
        legend_key_width=8,
        panel_grid_major=element_blank(),
        panel_grid_minor=element_blank(),
        panel_background=element_rect(fill=PAGE_BG, color="none"),
        plot_background=element_rect(fill=PAGE_BG, color="none"),
        plot_margin=0.02,
    )
)

plot.save(f"plot-{THEME}.png", dpi=400, width=8, height=4.5, units="in", verbose=False)
Runnable source as JSON, for any HTTP client: https://api.anyplot.ai/specs/spectrogram-mel/plotnine/code. Any spec id and library id listed in llms-full.txt fit the same URL shape; every URL below is complete and callable.
{
  "spec_id": "spectrogram-mel",
  "language": "python",
  "library": "plotnine",
  "page": "https://anyplot.ai/spectrogram-mel/python/plotnine",
  "hub": "https://anyplot.ai/spectrogram-mel",
  "code_json": "https://api.anyplot.ai/specs/spectrogram-mel/plotnine/code",
  "spec_json": "https://api.anyplot.ai/specs/spectrogram-mel",
  "render_light_png": "https://storage.googleapis.com/anyplot-images/plots/spectrogram-mel/python/plotnine/plot-light.png",
  "render_dark_png": "https://storage.googleapis.com/anyplot-images/plots/spectrogram-mel/python/plotnine/plot-dark.png",
  "quality_score": 91.0,
  "license": "MIT",
  "guide": "https://anyplot.ai/llms.txt"
}
Part of Mel-Spectrogram for Audio Analysis on anyplot.ai.