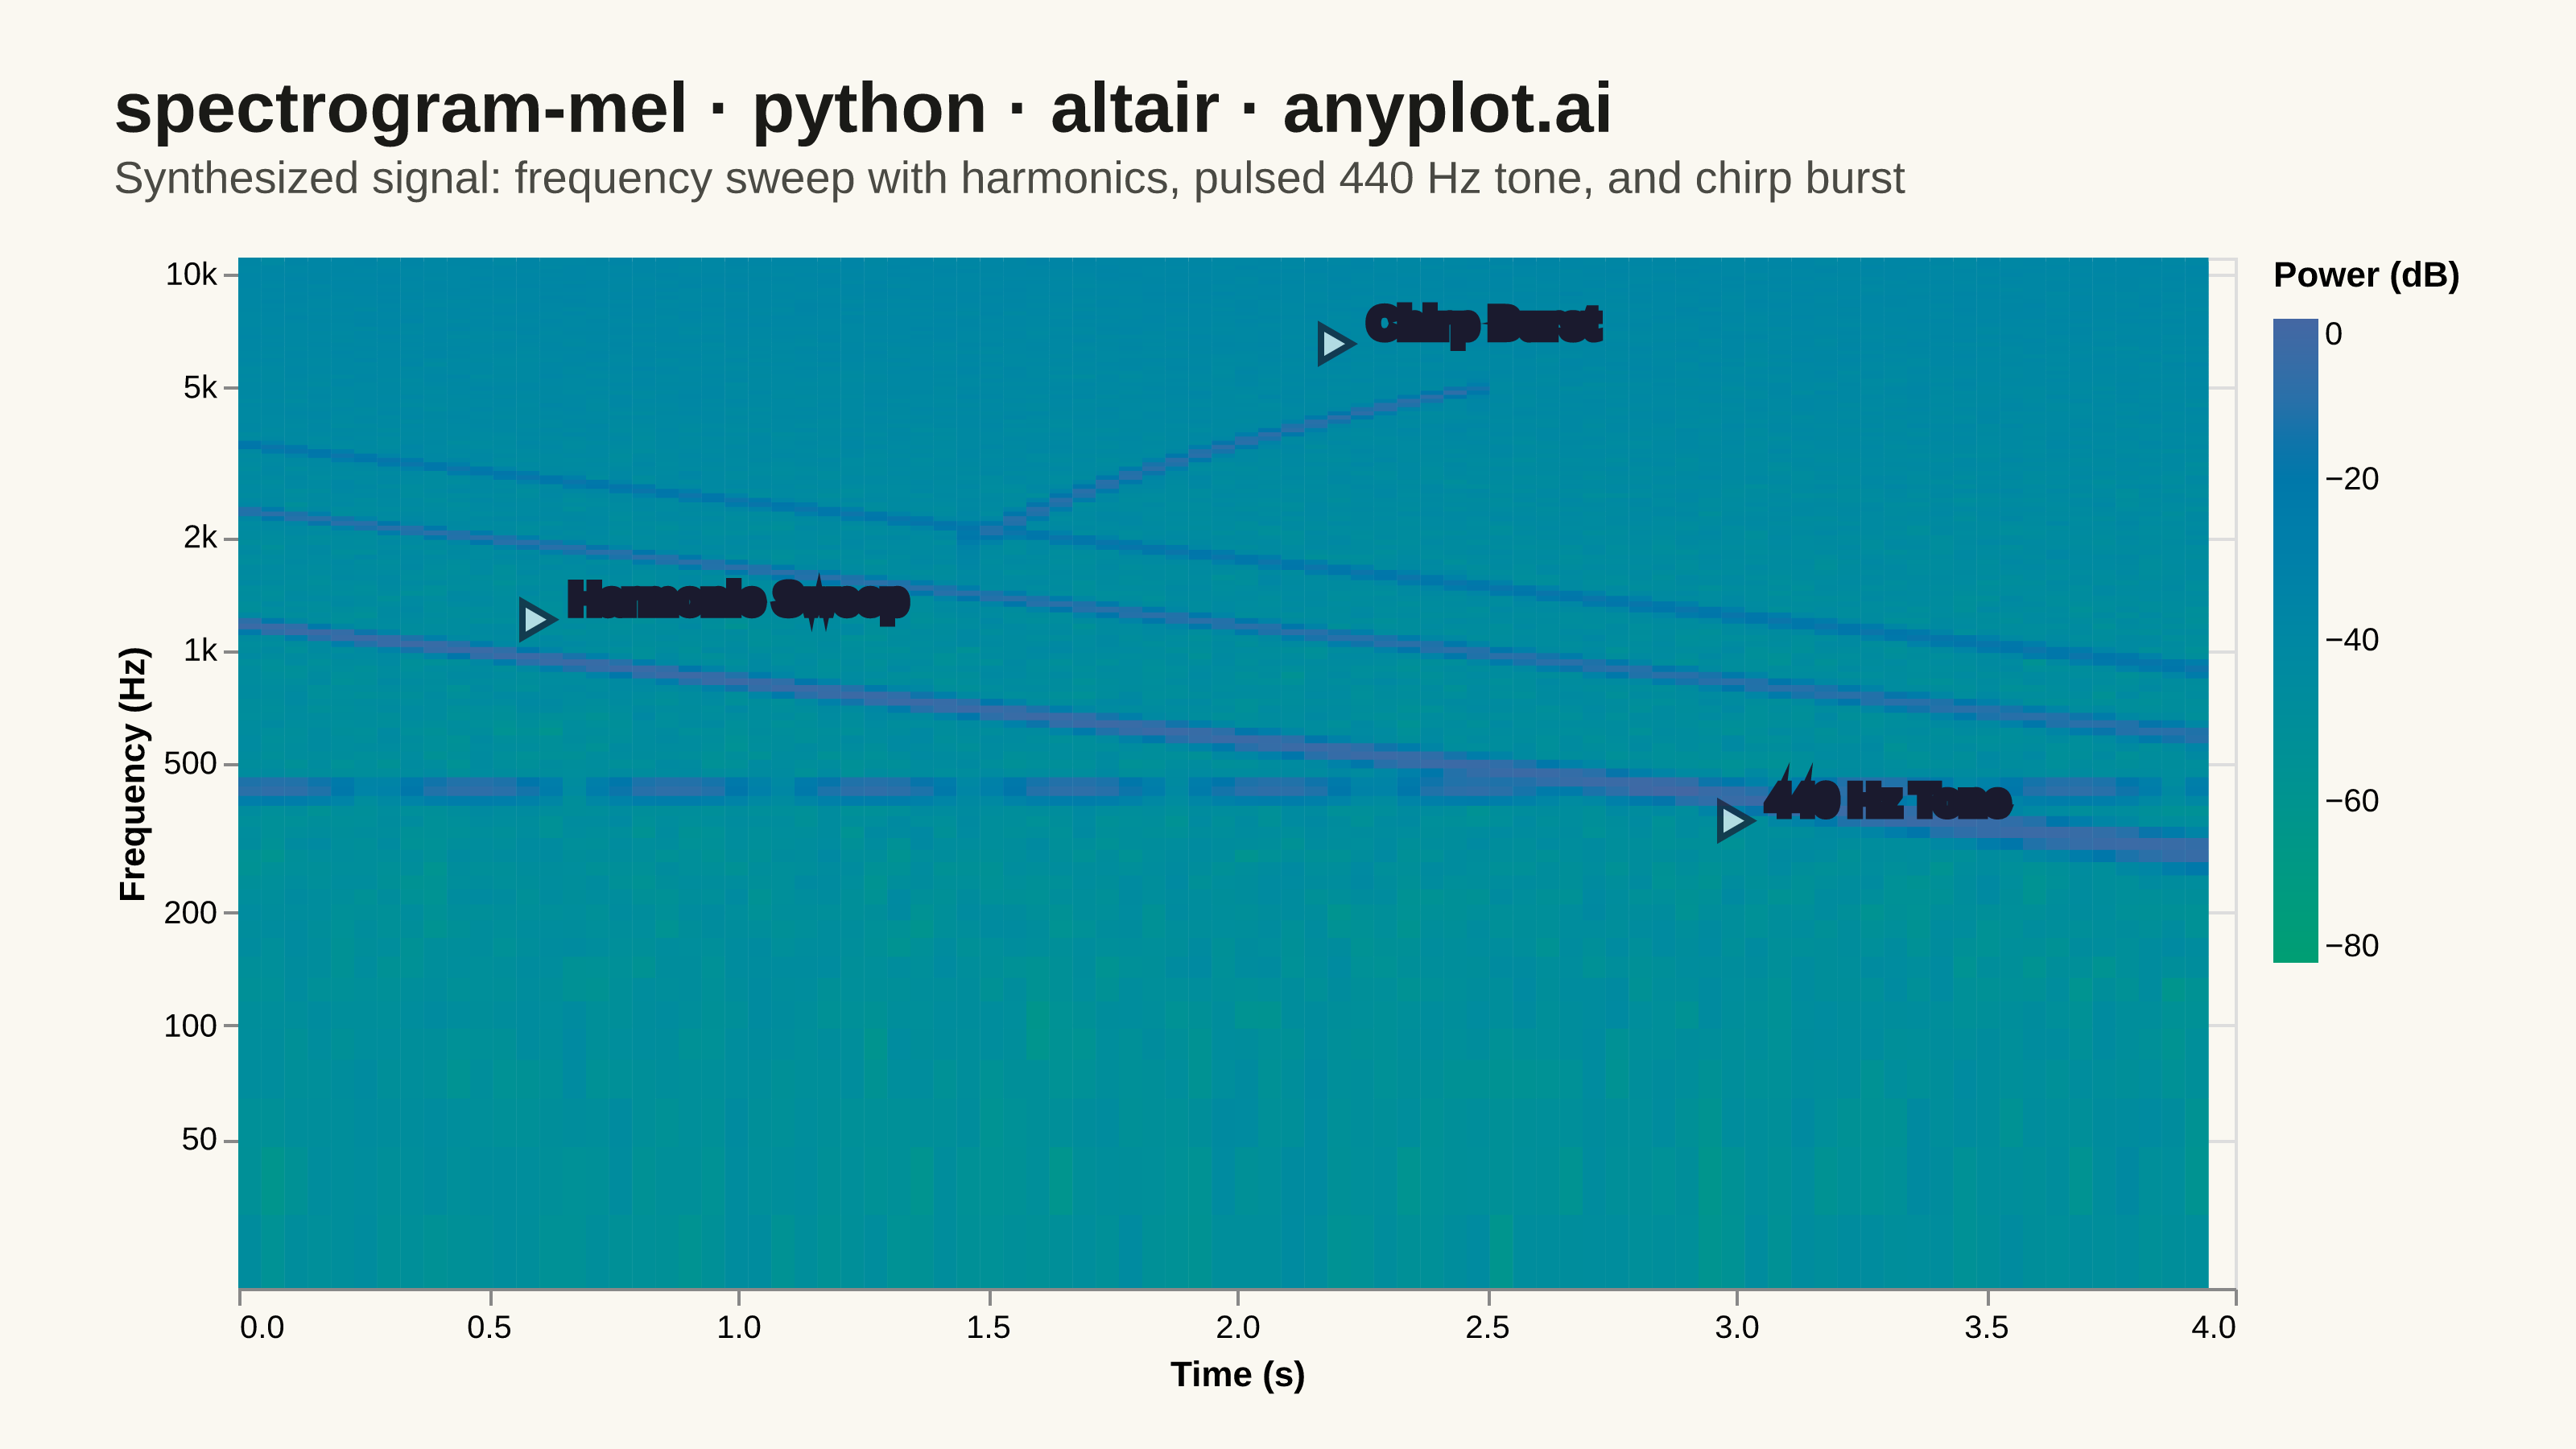
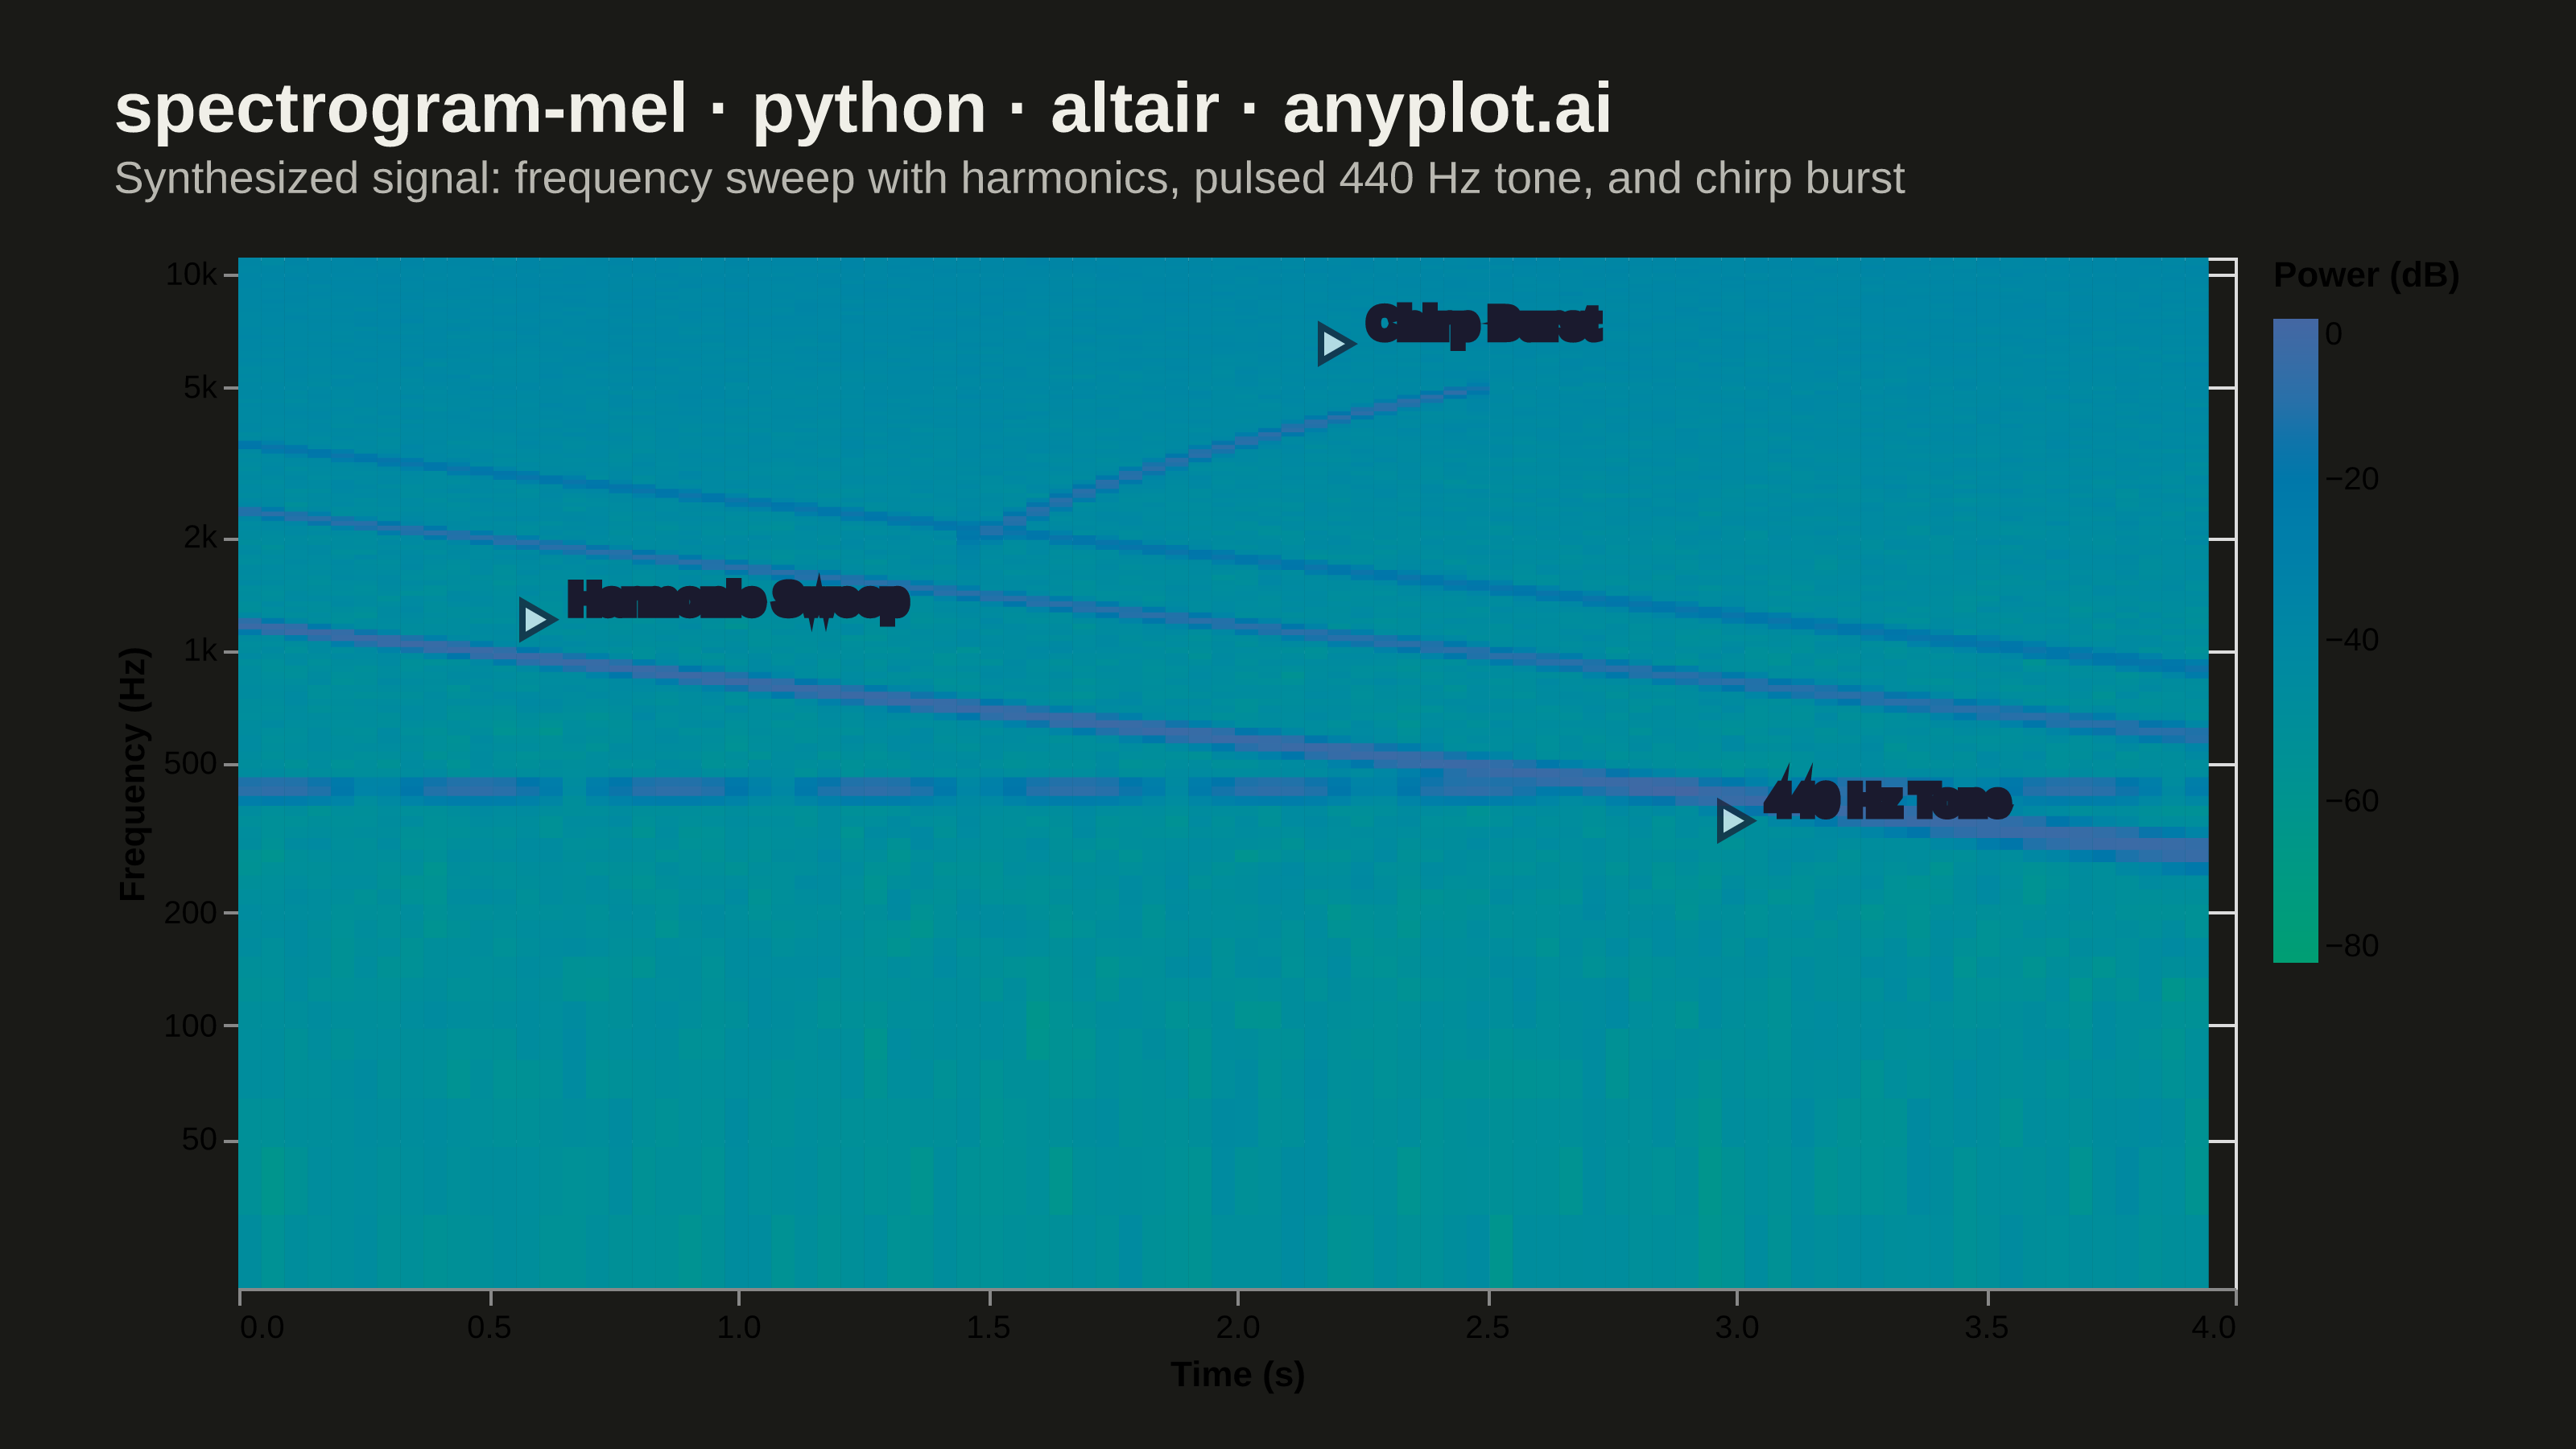
A mel-spectrogram displaying the power spectrum of an audio signal with the frequency axis warped to the mel scale, which approximates human auditory perception. Unlike a standard spectrogram with a linear frequency axis, the mel-spectrogram compresses higher frequencies and expands lower frequencies, making perceptually similar sounds visually closer together. This is the foundational input representation for modern audio machine learning pipelines including speech recognition, speaker identification, and music information retrieval.
""" anyplot.ai
spectrogram-mel: Mel-Spectrogram for Audio Analysis
Library: altair 6.1.0 | Python 3.13.13
Quality: 87/100 | Updated: 2026-06-03
"""

import os

import altair as alt
import numpy as np
import pandas as pd
from PIL import Image


# ── Theme tokens ──────────────────────────────────────────────────────────────
THEME = os.getenv("ANYPLOT_THEME", "light")
PAGE_BG = "#FAF8F1" if THEME == "light" else "#1A1A17"
ELEVATED_BG = "#FFFDF6" if THEME == "light" else "#242420"
INK = "#1A1A17" if THEME == "light" else "#F0EFE8"
INK_SOFT = "#4A4A44" if THEME == "light" else "#B8B7B0"

TW, TH = 3200, 1800  # landscape canvas target

# ── Data: synthesized audio signal ───────────────────────────────────────────
np.random.seed(42)
sample_rate = 22050
duration = 4.0
n_samples = int(sample_rate * duration)
t = np.linspace(0, duration, n_samples, endpoint=False)

# Descending frequency sweep from 1200 Hz → 300 Hz with harmonics
sweep_freq = np.cumsum(1200 * np.exp(-0.35 * t)) / sample_rate
signal = 0.6 * np.sin(2 * np.pi * sweep_freq)
signal += 0.3 * np.sin(2 * np.pi * 2 * sweep_freq)
signal += 0.15 * np.sin(2 * np.pi * 3 * sweep_freq)

# Pulsed 440 Hz tone (A4) with amplitude modulation
envelope = 0.5 * (1 + np.sin(2 * np.pi * 2.5 * t))
signal += 0.4 * envelope * np.sin(2 * np.pi * 440 * t)

# High-frequency chirp burst in the 1.5–2.5 s window
chirp_mask = (t > 1.5) & (t < 2.5)
chirp_phase = np.cumsum(chirp_mask * (2000 + 3000 * (t - 1.5))) / sample_rate
signal += 0.35 * chirp_mask * np.sin(2 * np.pi * chirp_phase)

# Subtle noise floor
signal += 0.05 * np.random.randn(n_samples)

# STFT
n_fft = 2048
hop_length = 512
window = np.hanning(n_fft)
n_freq_bins = n_fft // 2 + 1
n_frames = 1 + (n_samples - n_fft) // hop_length

stft_power = np.zeros((n_freq_bins, n_frames))
for i in range(n_frames):
    start = i * hop_length
    frame = signal[start : start + n_fft] * window
    stft_power[:, i] = np.abs(np.fft.rfft(frame)) ** 2

# Mel filter bank
n_mels = 128
f_max = sample_rate / 2.0
mel_max = 2595.0 * np.log10(1.0 + f_max / 700.0)
mel_edges = np.linspace(0, mel_max, n_mels + 2)
hz_edges = 700.0 * (10.0 ** (mel_edges / 2595.0) - 1.0)
fft_freqs = np.linspace(0, f_max, n_freq_bins)

filterbank = np.zeros((n_mels, n_freq_bins))
for i in range(n_mels):
    lo, mid, hi = hz_edges[i], hz_edges[i + 1], hz_edges[i + 2]
    up = (fft_freqs >= lo) & (fft_freqs <= mid)
    dn = (fft_freqs > mid) & (fft_freqs <= hi)
    if mid > lo:
        filterbank[i, up] = (fft_freqs[up] - lo) / (mid - lo)
    if hi > mid:
        filterbank[i, dn] = (hi - fft_freqs[dn]) / (hi - mid)

mel_spec = np.maximum(filterbank @ stft_power, 1e-10)
mel_spec_db = 10.0 * np.log10(mel_spec)
mel_spec_db -= mel_spec_db.max()
mel_spec_db = np.maximum(mel_spec_db, -80.0)

# Subsample time frames only; use all 128 mel bins for resolution
frame_step = 2
time_idx = np.arange(0, n_frames, frame_step)
time_sec = time_idx * hop_length / sample_rate
time_width = frame_step * hop_length / sample_rate

rows = []
for mi in range(n_mels):
    freq_lo = float(hz_edges[mi])
    freq_hi = float(hz_edges[mi + 2])
    for ti_pos, ti in enumerate(time_idx):
        rows.append(
            {
                "t1": round(float(time_sec[ti_pos]), 4),
                "t2": round(float(time_sec[ti_pos]) + time_width, 4),
                "f1": round(max(freq_lo, 20.0), 1),
                "f2": round(freq_hi, 1),
                "dB": round(float(mel_spec_db[mi, ti]), 1),
            }
        )

df = pd.DataFrame(rows)

# Annotations — "440 Hz Tone" moved from x=3.5 → x=3.0 to avoid right-edge cramping
annotations = pd.DataFrame(
    [
        {"x": 0.6, "y": 1200, "label": "Harmonic Sweep"},
        {"x": 2.2, "y": 6500, "label": "Chirp Burst"},
        {"x": 3.0, "y": 350, "label": "440 Hz Tone"},
    ]
)

# ── Chart layers ──────────────────────────────────────────────────────────────
spectrogram = (
    alt.Chart(df)
    .mark_rect()
    .encode(
        x=alt.X(
            "t1:Q",
            title="Time (s)",
            scale=alt.Scale(domain=[0, duration], nice=False),
            axis=alt.Axis(values=[0, 0.5, 1.0, 1.5, 2.0, 2.5, 3.0, 3.5, 4.0], tickSize=5),
        ),
        x2="t2:Q",
        y=alt.Y(
            "f1:Q",
            title="Frequency (Hz)",
            scale=alt.Scale(type="log", domain=[20, 11025], nice=False),
            axis=alt.Axis(
                values=[50, 100, 200, 500, 1000, 2000, 5000, 10000],
                tickSize=5,
                labelExpr="datum.value >= 1000 ? format(datum.value / 1000, '.0f') + 'k' : format(datum.value, '.0f')",
            ),
        ),
        y2="f2:Q",
        color=alt.Color(
            "dB:Q",
            scale=alt.Scale(range=["#009E73", "#4467A3"], domain=[-80, 0]),
            legend=alt.Legend(
                title="Power (dB)",
                gradientLength=200,
                gradientThickness=14,
                titlePadding=8,
                offset=12,
                direction="vertical",
            ),
        ),
        tooltip=[
            alt.Tooltip("t1:Q", title="Time (s)", format=".2f"),
            alt.Tooltip("f1:Q", title="Freq low (Hz)", format=".0f"),
            alt.Tooltip("f2:Q", title="Freq high (Hz)", format=".0f"),
            alt.Tooltip("dB:Q", title="Power (dB)", format=".1f"),
        ],
    )
)

annotation_labels = (
    alt.Chart(annotations)
    .mark_text(
        fontSize=13, fontWeight="bold", color="#ffffff", strokeWidth=3, stroke="#1a1a2e", align="left", dx=10, dy=-6
    )
    .encode(x="x:Q", y="y:Q", text="label:N")
)

annotation_marks = (
    alt.Chart(annotations)
    .mark_point(shape="triangle-right", size=120, color="#ffffff", strokeWidth=2, stroke="#1a1a2e", filled=True)
    .encode(x="x:Q", y="y:Q")
)

chart = (
    alt.layer(spectrogram, annotation_marks, annotation_labels)
    .properties(
        width=620,
        height=320,
        title=alt.Title(
            "spectrogram-mel · python · altair · anyplot.ai",
            subtitle="Synthesized signal: frequency sweep with harmonics, pulsed 440 Hz tone, and chirp burst",
            fontSize=22,
            subtitleFontSize=14,
            subtitleColor=INK_SOFT,
            anchor="start",
            offset=16,
            color=INK,
        ),
        padding={"left": 20, "right": 20, "top": 20, "bottom": 16},
        background=PAGE_BG,
    )
    .configure_axis(
        labelFontSize=11,
        titleFontSize=14,
        grid=False,
        domainColor=INK_SOFT,
        tickColor=INK_SOFT,
        labelColor=INK_SOFT,
        titleColor=INK,
        tickSize=5,
        labelPadding=6,
        titlePadding=10,
    )
    .configure_view(strokeWidth=0, fill=PAGE_BG)
    .configure_title(color=INK)
    .configure_legend(
        fillColor=ELEVATED_BG,
        strokeColor=INK_SOFT,
        labelColor=INK_SOFT,
        titleColor=INK,
        labelFontSize=10,
        titleFontSize=12,
    )
    .configure(font="Helvetica Neue, Helvetica, Arial, sans-serif", background=PAGE_BG)
)

# ── Save ──────────────────────────────────────────────────────────────────────
chart.save(f"plot-{THEME}.png", scale_factor=4.0)
chart.save(f"plot-{THEME}.html")

# Pad to exact 3200×1800 (vl-convert may land slightly short of the target)
_img = Image.open(f"plot-{THEME}.png").convert("RGB")
_w, _h = _img.size
if _w > TW or _h > TH:
    raise SystemExit(
        f"altair vl-convert produced {_w}×{_h}, exceeds target {TW}×{TH}. "
        f"Shrink chart .properties(width=, height=) values and re-render."
    )
if _w < TW or _h < TH:
    _canvas = Image.new("RGB", (TW, TH), PAGE_BG)
    _canvas.paste(_img, ((TW - _w) // 2, (TH - _h) // 2))
    _canvas.save(f"plot-{THEME}.png")
Runnable source as JSON, for any HTTP client: https://api.anyplot.ai/specs/spectrogram-mel/altair/code. Any spec id and library id listed in llms-full.txt fit the same URL shape; every URL below is complete and callable.
{
  "spec_id": "spectrogram-mel",
  "language": "python",
  "library": "altair",
  "page": "https://anyplot.ai/spectrogram-mel/python/altair",
  "hub": "https://anyplot.ai/spectrogram-mel",
  "code_json": "https://api.anyplot.ai/specs/spectrogram-mel/altair/code",
  "spec_json": "https://api.anyplot.ai/specs/spectrogram-mel",
  "render_light_png": "https://storage.googleapis.com/anyplot-images/plots/spectrogram-mel/python/altair/plot-light.png",
  "render_dark_png": "https://storage.googleapis.com/anyplot-images/plots/spectrogram-mel/python/altair/plot-dark.png",
  "interactive_light_html": "https://storage.googleapis.com/anyplot-images/plots/spectrogram-mel/python/altair/plot-light.html",
  "interactive_dark_html": "https://storage.googleapis.com/anyplot-images/plots/spectrogram-mel/python/altair/plot-dark.html",
  "quality_score": 87.0,
  "license": "MIT",
  "guide": "https://anyplot.ai/llms.txt"
}
Part of Mel-Spectrogram for Audio Analysis on anyplot.ai.