The same plot in 14 other libraries — JavaScript: Chart.js, D3.js, Apache ECharts, Highcharts; Python: Altair, Bokeh, lets-plot, Matplotlib, Plotly, plotnine, Pygal, Seaborn; R: ggplot2; Julia: Makie.jl. Compare all 15 side by side: Mel-Spectrogram for Audio Analysis in Python, R, Julia and JavaScript.
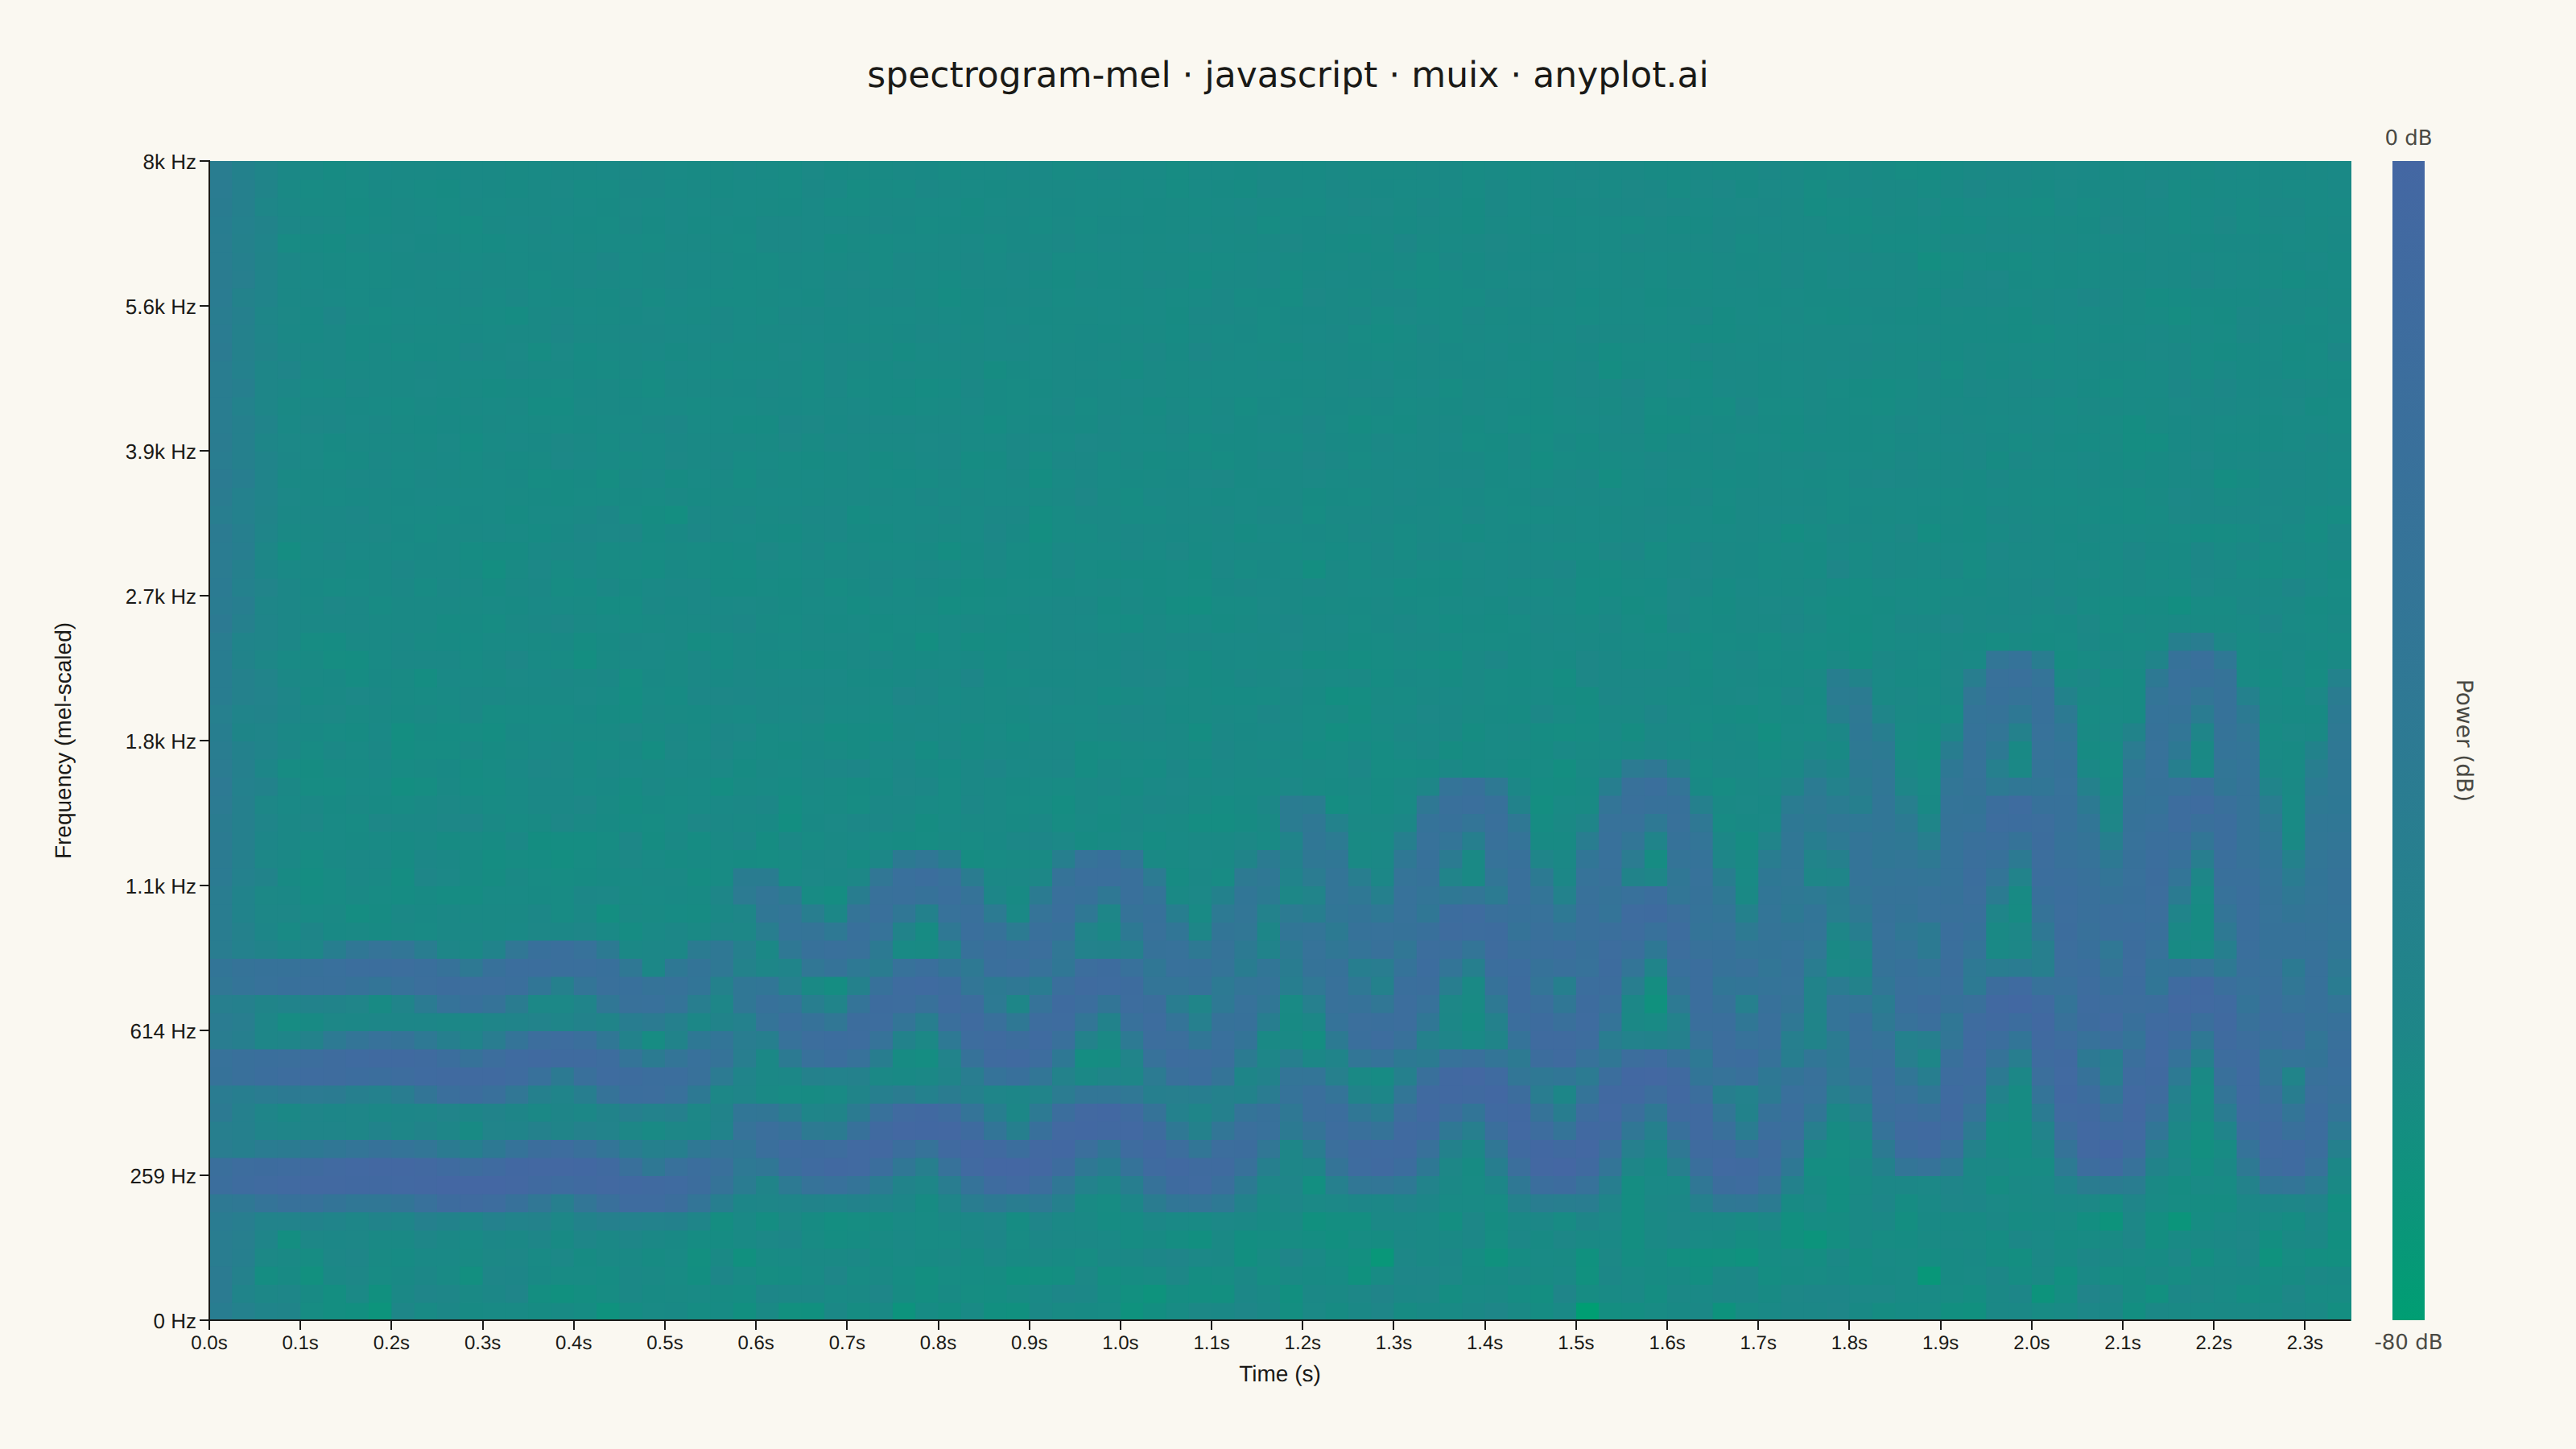
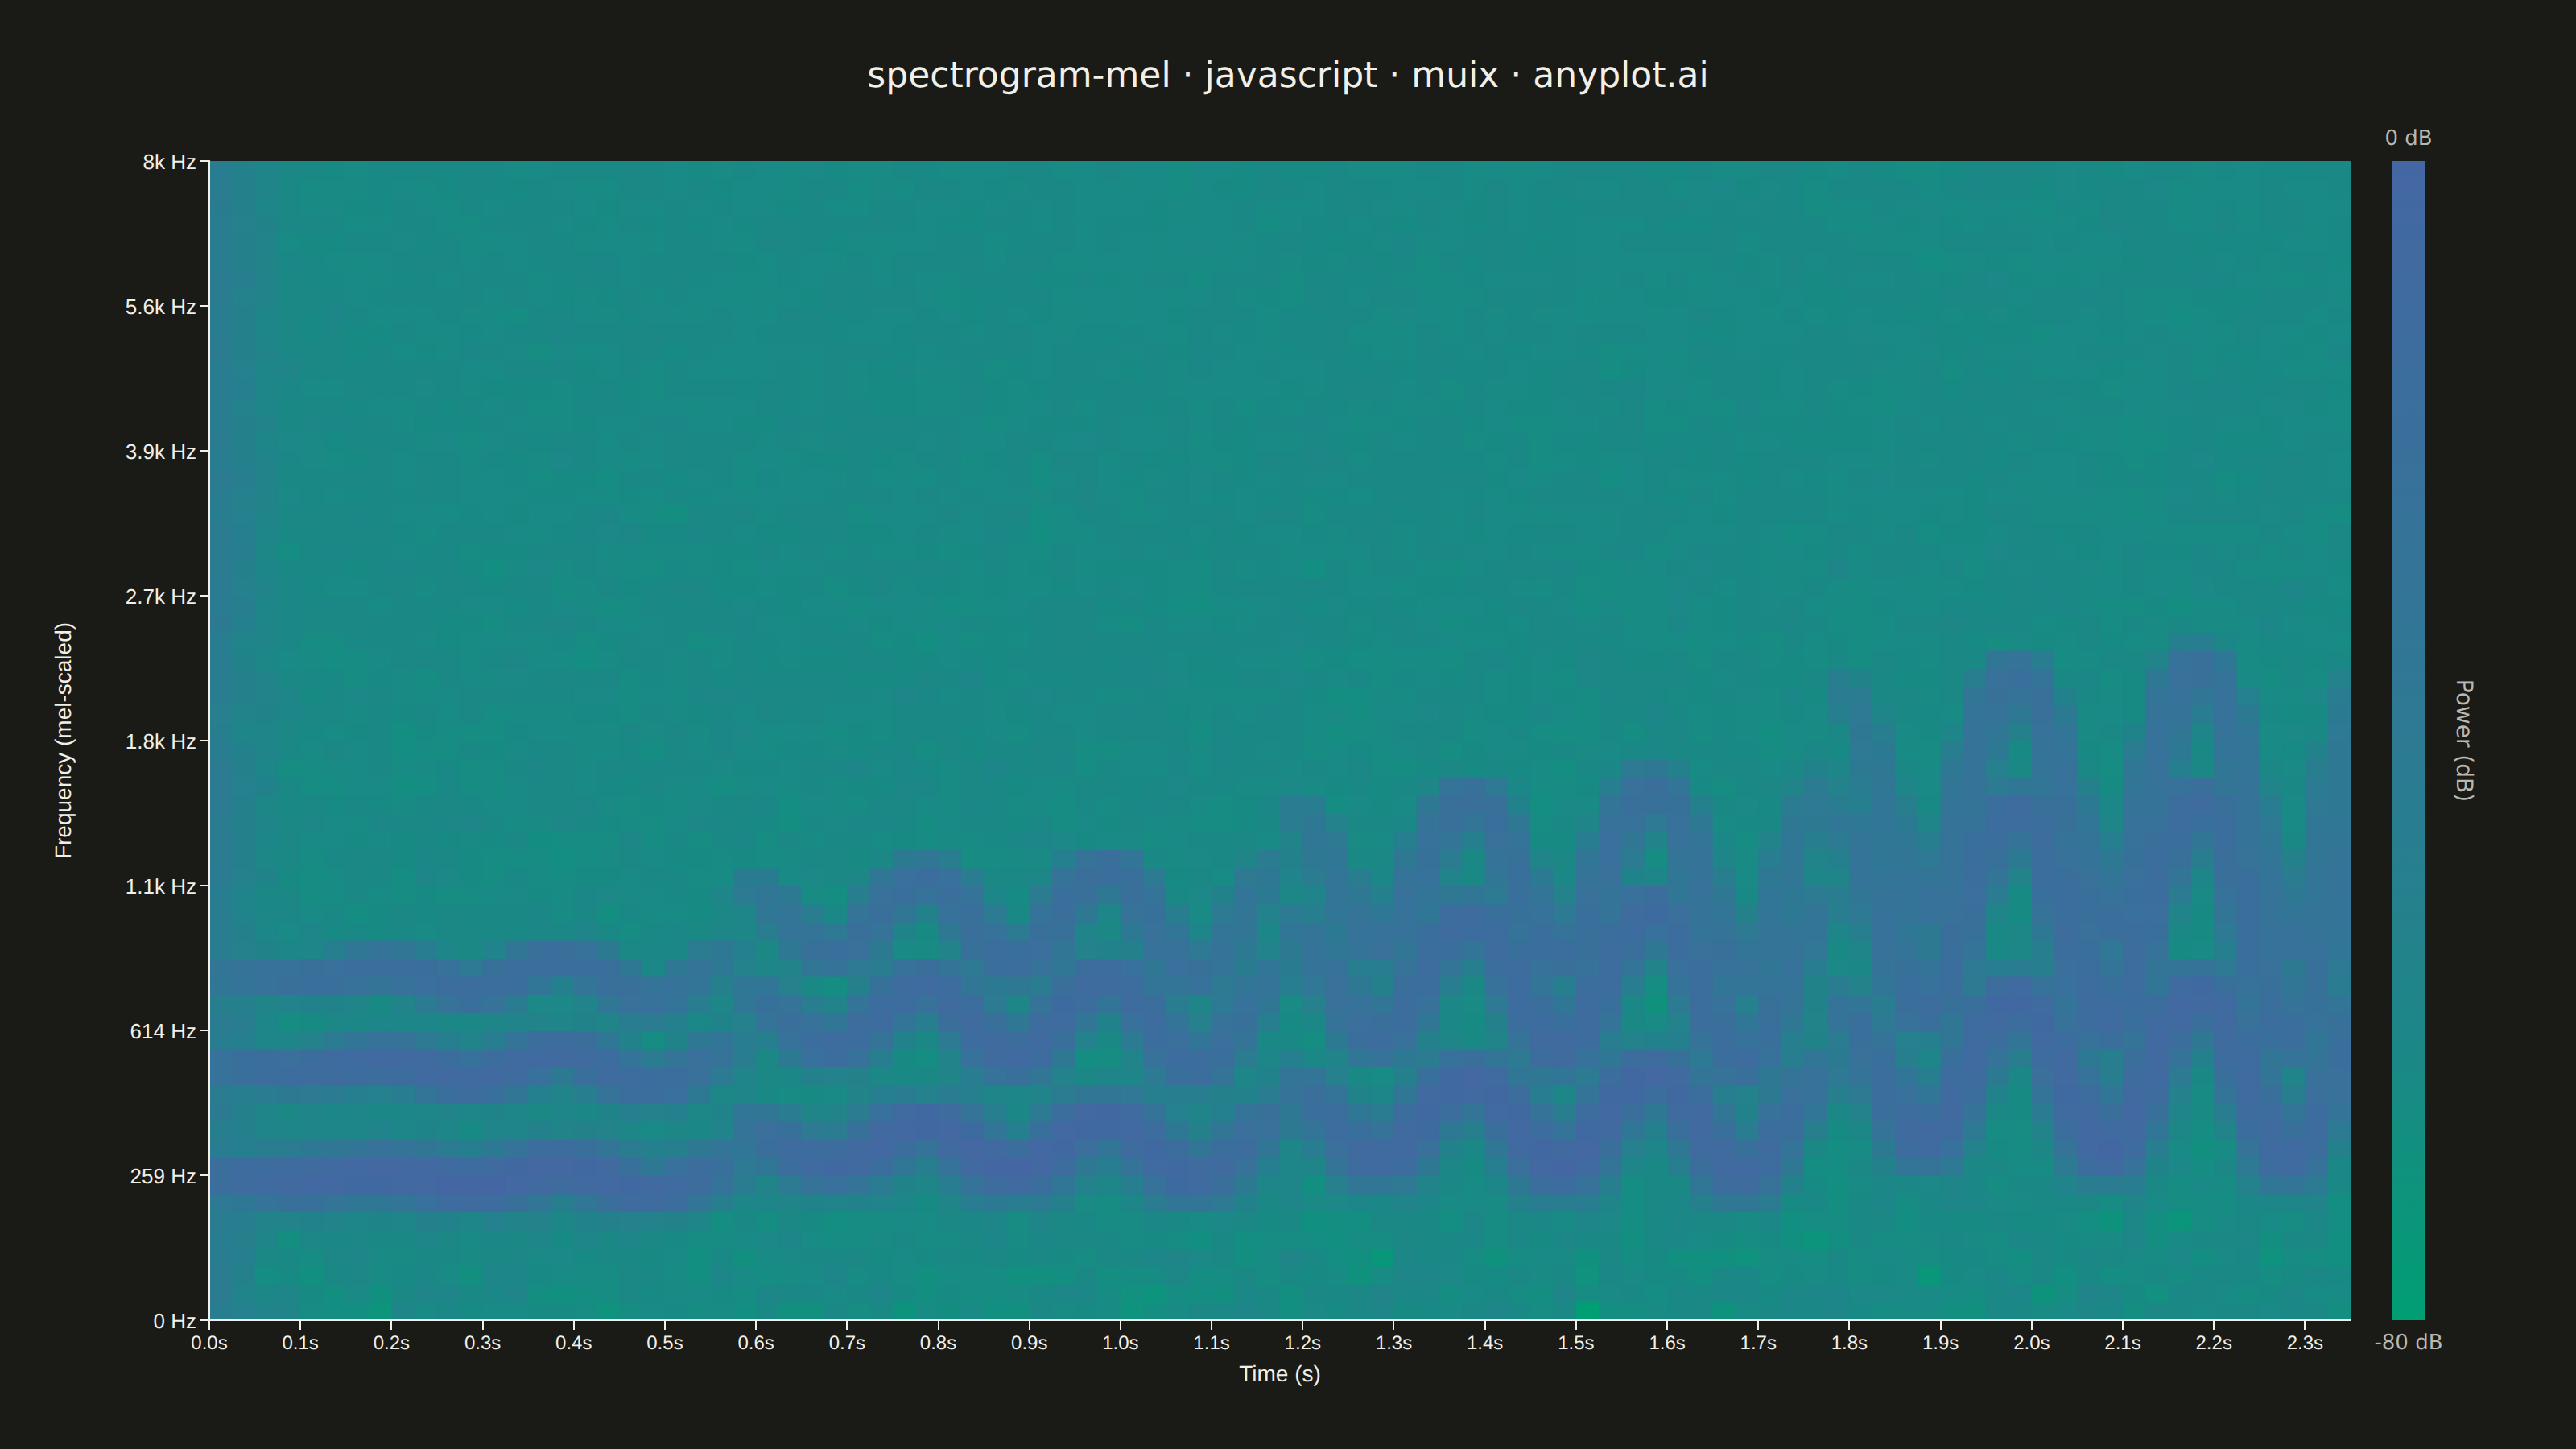
A mel-spectrogram displaying the power spectrum of an audio signal with the frequency axis warped to the mel scale, which approximates human auditory perception. Unlike a standard spectrogram with a linear frequency axis, the mel-spectrogram compresses higher frequencies and expands lower frequencies, making perceptually similar sounds visually closer together. This is the foundational input representation for modern audio machine learning pipelines including speech recognition, speaker identification, and music information retrieval.
// anyplot.ai
// spectrogram-mel: Mel-Spectrogram for Audio Analysis
// Library: muix 7.29.1 | JavaScript 22.23.2
// Quality: 90/100 | Created: 2026-08-24

import { ChartContainer } from "@mui/x-charts/ChartContainer";
import { ChartsXAxis } from "@mui/x-charts/ChartsXAxis";
import { ChartsYAxis } from "@mui/x-charts/ChartsYAxis";
import { useDrawingArea, useXScale, useYScale } from "@mui/x-charts/hooks";

const t = window.ANYPLOT_TOKENS;
const { width, height } = window.ANYPLOT_SIZE;

// --- Audio synthesis (deterministic, in-memory) ------------------------------
// A short sung melody (four notes with decaying harmonics + vibrato) plus a
// breathy broadband onset — the kind of signal an ASR / vocal-quality pipeline
// would feed into a mel-spectrogram front end.
const SAMPLE_RATE = 16000;
const DURATION_S = 2.4;
const N_SAMPLES = Math.round(SAMPLE_RATE * DURATION_S);
const NOTES = [261.63, 329.63, 392.0, 523.25]; // C4, E4, G4, C5
const NOTE_DURATION = DURATION_S / NOTES.length;
const HARMONIC_AMPS = [1, 0.5, 0.22];

// Tiny LCG for reproducible noise — the browser has no seeded RNG.
function makeLcg(seed: number) {
  let s = seed >>> 0;
  return () => {
    s = (Math.imul(s, 1664525) + 1013904223) >>> 0;
    return s / 0x100000000;
  };
}
const rand = makeLcg(42);

const audioSignal = new Float64Array(N_SAMPLES);
for (let i = 0; i < N_SAMPLES; i++) {
  const time = i / SAMPLE_RATE;
  const noteIndex = Math.min(NOTES.length - 1, Math.floor(time / NOTE_DURATION));
  const localT = time - noteIndex * NOTE_DURATION;
  const envelope = Math.sin(Math.PI * Math.min(1, localT / NOTE_DURATION));
  const vibrato = 1 + 0.006 * Math.sin(2 * Math.PI * 5 * time);
  const fundamental = NOTES[noteIndex];

  let tone = 0;
  for (let h = 0; h < HARMONIC_AMPS.length; h++) {
    tone += HARMONIC_AMPS[h] * Math.sin(2 * Math.PI * fundamental * (h + 1) * vibrato * time);
  }
  const breathyOnset = Math.exp(-time / 0.03) * 0.16 * (2 * rand() - 1);
  const noiseFloor = 0.006 * (2 * rand() - 1);
  audioSignal[i] = 0.6 * envelope * tone + breathyOnset + noiseFloor;
}

// --- STFT: iterative radix-2 FFT ---------------------------------------------
const N_FFT = 1024;
const HOP = 400;
const N_FREQ = N_FFT / 2 + 1;
const N_FRAMES = Math.floor((N_SAMPLES - N_FFT) / HOP) + 1;

function fft(re: Float64Array, im: Float64Array) {
  const n = re.length;
  for (let i = 1, j = 0; i < n; i++) {
    let bit = n >> 1;
    for (; j & bit; bit >>= 1) j ^= bit;
    j ^= bit;
    if (i < j) {
      const tr = re[i]; re[i] = re[j]; re[j] = tr;
      const ti = im[i]; im[i] = im[j]; im[j] = ti;
    }
  }
  for (let len = 2; len <= n; len <<= 1) {
    const ang = (-2 * Math.PI) / len;
    const wr = Math.cos(ang);
    const wi = Math.sin(ang);
    for (let i = 0; i < n; i += len) {
      let curWr = 1;
      let curWi = 0;
      for (let k = 0; k < len / 2; k++) {
        const ur = re[i + k];
        const ui = im[i + k];
        const vr = re[i + k + len / 2] * curWr - im[i + k + len / 2] * curWi;
        const vi = re[i + k + len / 2] * curWi + im[i + k + len / 2] * curWr;
        re[i + k] = ur + vr;
        im[i + k] = ui + vi;
        re[i + k + len / 2] = ur - vr;
        im[i + k + len / 2] = ui - vi;
        const nextWr = curWr * wr - curWi * wi;
        const nextWi = curWr * wi + curWi * wr;
        curWr = nextWr;
        curWi = nextWi;
      }
    }
  }
}

const hannWindow = new Float64Array(N_FFT);
for (let n = 0; n < N_FFT; n++) hannWindow[n] = 0.5 - 0.5 * Math.cos((2 * Math.PI * n) / (N_FFT - 1));

// --- Mel filterbank (HTK formula) --------------------------------------------
const N_MELS = 64;
const F_MAX = SAMPLE_RATE / 2;
function hzToMel(hz: number): number {
  return 2595 * Math.log10(1 + hz / 700);
}
function melToHz(mel: number): number {
  return 700 * (10 ** (mel / 2595) - 1);
}
const MEL_MAX = hzToMel(F_MAX);
const melEdges = Array.from({ length: N_MELS + 2 }, (_, i) => (i * MEL_MAX) / (N_MELS + 1));
const hzEdges = melEdges.map(melToHz);
const binEdges = hzEdges.map((hz) => Math.floor(((N_FFT + 1) * hz) / SAMPLE_RATE));

// Slaney-style area normalization — without it, wideband noise sums to a
// larger response in the wider high-frequency filters, washing out contrast.
const melFilters: Float64Array[] = Array.from({ length: N_MELS }, () => new Float64Array(N_FREQ));
for (let m = 1; m <= N_MELS; m++) {
  const left = binEdges[m - 1];
  const center = binEdges[m];
  const right = binEdges[m + 1];
  const filt = melFilters[m - 1];
  const norm = 2 / (hzEdges[m + 1] - hzEdges[m - 1] || 1);
  for (let k = left; k < center && k < N_FREQ; k++) if (k >= 0) filt[k] = ((k - left) / (center - left || 1)) * norm;
  for (let k = center; k < right && k < N_FREQ; k++) if (k >= 0) filt[k] = ((right - k) / (right - center || 1)) * norm;
}

// --- STFT -> mel power -> dB (relative to peak, floored at -80 dB) ----------
const DB_FLOOR = -80;
let peakPower = 1e-10;
const melPower: Float64Array[] = [];
for (let f = 0; f < N_FRAMES; f++) {
  const start = f * HOP;
  const re = new Float64Array(N_FFT);
  const im = new Float64Array(N_FFT);
  for (let n = 0; n < N_FFT; n++) re[n] = audioSignal[start + n] * hannWindow[n];
  fft(re, im);

  const power = new Float64Array(N_FREQ);
  for (let k = 0; k < N_FREQ; k++) power[k] = (re[k] * re[k] + im[k] * im[k]) / N_FFT;

  const melRow = new Float64Array(N_MELS);
  for (let m = 0; m < N_MELS; m++) {
    let sum = 0;
    const filt = melFilters[m];
    for (let k = 0; k < N_FREQ; k++) sum += filt[k] * power[k];
    melRow[m] = sum;
    if (sum > peakPower) peakPower = sum;
  }
  melPower.push(melRow);
}
const melDb: number[][] = melPower.map((row) =>
  Array.from(row).map((v) => Math.max(DB_FLOOR, 10 * Math.log10(Math.max(v, 1e-10) / peakPower)))
);

const TIME_MAX = (N_FRAMES * HOP) / SAMPLE_RATE;
const Y_TICKS = Array.from({ length: 9 }, (_, i) => Math.round((i * N_MELS) / 8));

function formatHz(hz: number): string {
  if (hz >= 1000) return `${(hz / 1000).toFixed(1).replace(/\.0$/, "")}k Hz`;
  return `${Math.round(hz)} Hz`;
}

// Imprint sequential colormap: seq[0]=#009E73 (low power) -> seq[1]=#4467A3 (high power)
function hexRgb(hex: string): [number, number, number] {
  return [parseInt(hex.slice(1, 3), 16), parseInt(hex.slice(3, 5), 16), parseInt(hex.slice(5, 7), 16)];
}
function seqColor(frac: number): string {
  const [r1, g1, b1] = hexRgb(t.seq[0]);
  const [r2, g2, b2] = hexRgb(t.seq[1]);
  return `rgb(${Math.round(r1 + (r2 - r1) * frac)},${Math.round(g1 + (g2 - g1) * frac)},${Math.round(b1 + (b2 - b1) * frac)})`;
}
// Gamma < 1 stretches the low end of the dB range across more of the color
// ramp, so quiet early note onsets read against the background instead of
// blending into a flat mid-tone field.
const COLOR_GAMMA = 0.6;
function gammaFrac(frac: number): number {
  return Math.pow(Math.max(0, frac), COLOR_GAMMA);
}

// Mel-band cells drawn directly at their frame/bin boundaries via the MUI X scale hooks
function SpectrogramCells() {
  const xScale = useXScale();
  const yScale = useYScale();

  return (
    <>
      {melDb.flatMap((row, f) => {
        const x0 = xScale((f * HOP) / SAMPLE_RATE);
        const x1 = xScale(((f + 1) * HOP) / SAMPLE_RATE);
        return row.map((db, m) => {
          const frac = (db - DB_FLOOR) / -DB_FLOOR;
          const yTop = yScale(m + 1);
          const yBottom = yScale(m);
          return (
            <rect
              key={`${f}-${m}`}
              x={x0}
              y={yTop}
              width={x1 - x0 + 0.5}
              height={yBottom - yTop + 0.5}
              fill={seqColor(gammaFrac(frac))}
            />
          );
        });
      })}
    </>
  );
}

// Colorbar gradient positioned from the MUI X drawing-area context
function Colorbar() {
  const { left, top, width: gW, height: gH } = useDrawingArea();
  const cbX = left + gW + 26;
  const cbW = 20;

  return (
    <>
      <defs>
        <linearGradient id="melCbGrad" x1="0" y1="1" x2="0" y2="0">
          {[0, 0.25, 0.5, 0.75, 1].map((stop) => (
            <stop key={stop} offset={`${stop * 100}%`} stopColor={seqColor(gammaFrac(stop))} />
          ))}
        </linearGradient>
      </defs>
      <rect x={cbX} y={top} width={cbW} height={gH} fill="url(#melCbGrad)" />
      <text x={cbX + cbW / 2} y={top - 10} textAnchor="middle" fontSize={13} fill={t.inkSoft} fontFamily="Inter, system-ui, sans-serif">
        0 dB
      </text>
      <text x={cbX + cbW / 2} y={top + gH + 18} textAnchor="middle" fontSize={13} fill={t.inkSoft} fontFamily="Inter, system-ui, sans-serif">
        -80 dB
      </text>
      <text
        x={cbX + cbW + 20}
        y={top + gH / 2}
        textAnchor="middle"
        fontSize={14}
        fill={t.inkSoft}
        fontFamily="Inter, system-ui, sans-serif"
        transform={`rotate(90, ${cbX + cbW + 20}, ${top + gH / 2})`}
      >
        Power (dB)
      </text>
    </>
  );
}

function ChartTitle() {
  const { top } = useDrawingArea();
  return (
    <text x={width / 2} y={top - 46} textAnchor="middle" fontSize={22} fontWeight={500} fill={t.ink} fontFamily="Inter, system-ui, sans-serif">
      spectrogram-mel · javascript · muix · anyplot.ai
    </text>
  );
}

export default function Chart() {
  return (
    <ChartContainer
      width={width}
      height={height}
      series={[]}
      skipAnimation
      xAxis={[{
        scaleType: "linear",
        min: 0,
        max: TIME_MAX,
        label: "Time (s)",
        valueFormatter: (v: number) => `${v.toFixed(1)}s`,
      }]}
      yAxis={[{
        scaleType: "linear",
        min: 0,
        max: N_MELS,
        label: "Frequency (mel-scaled)",
        tickInterval: Y_TICKS,
        valueFormatter: (v: number) => formatHz(melToHz((v * MEL_MAX) / N_MELS)),
        // The Hz tick labels ("8k Hz") are much wider than the default tick-font-based
        // label offset assumes — inflate tickFontSize to push the axis label clear,
        // then restore the real rendered size via tickLabelStyle.
        tickFontSize: 70,
        tickLabelStyle: { fontSize: 13 },
      }]}
      margin={{ left: 130, right: 140, top: 100, bottom: 80 }}
    >
      <ChartTitle />
      <SpectrogramCells />
      <Colorbar />
      <ChartsXAxis />
      <ChartsYAxis />
    </ChartContainer>
  );
}
Runnable source as JSON, for any HTTP client: https://api.anyplot.ai/specs/spectrogram-mel/muix/code. Any spec id and library id listed in llms-full.txt fit the same URL shape; every URL below is complete and callable.
{
  "spec_id": "spectrogram-mel",
  "language": "javascript",
  "library": "muix",
  "page": "https://anyplot.ai/spectrogram-mel/javascript/muix",
  "hub": "https://anyplot.ai/spectrogram-mel",
  "code_json": "https://api.anyplot.ai/specs/spectrogram-mel/muix/code",
  "spec_json": "https://api.anyplot.ai/specs/spectrogram-mel",
  "render_light_png": "https://storage.googleapis.com/anyplot-images/plots/spectrogram-mel/javascript/muix/plot-light.png",
  "render_dark_png": "https://storage.googleapis.com/anyplot-images/plots/spectrogram-mel/javascript/muix/plot-dark.png",
  "interactive_light_html": "https://storage.googleapis.com/anyplot-images/plots/spectrogram-mel/javascript/muix/plot-light.html",
  "interactive_dark_html": "https://storage.googleapis.com/anyplot-images/plots/spectrogram-mel/javascript/muix/plot-dark.html",
  "quality_score": 90.0,
  "license": "MIT",
  "guide": "https://anyplot.ai/llms.txt"
}
Part of Mel-Spectrogram for Audio Analysis on anyplot.ai.