Source code in 15 libraries — Python: Altair, Bokeh, lets-plot, Matplotlib, Plotly, plotnine, Pygal, Seaborn; R: ggplot2; Julia: Makie.jl; JavaScript: Chart.js, D3.js, Apache ECharts, Highcharts, MUI X Charts.
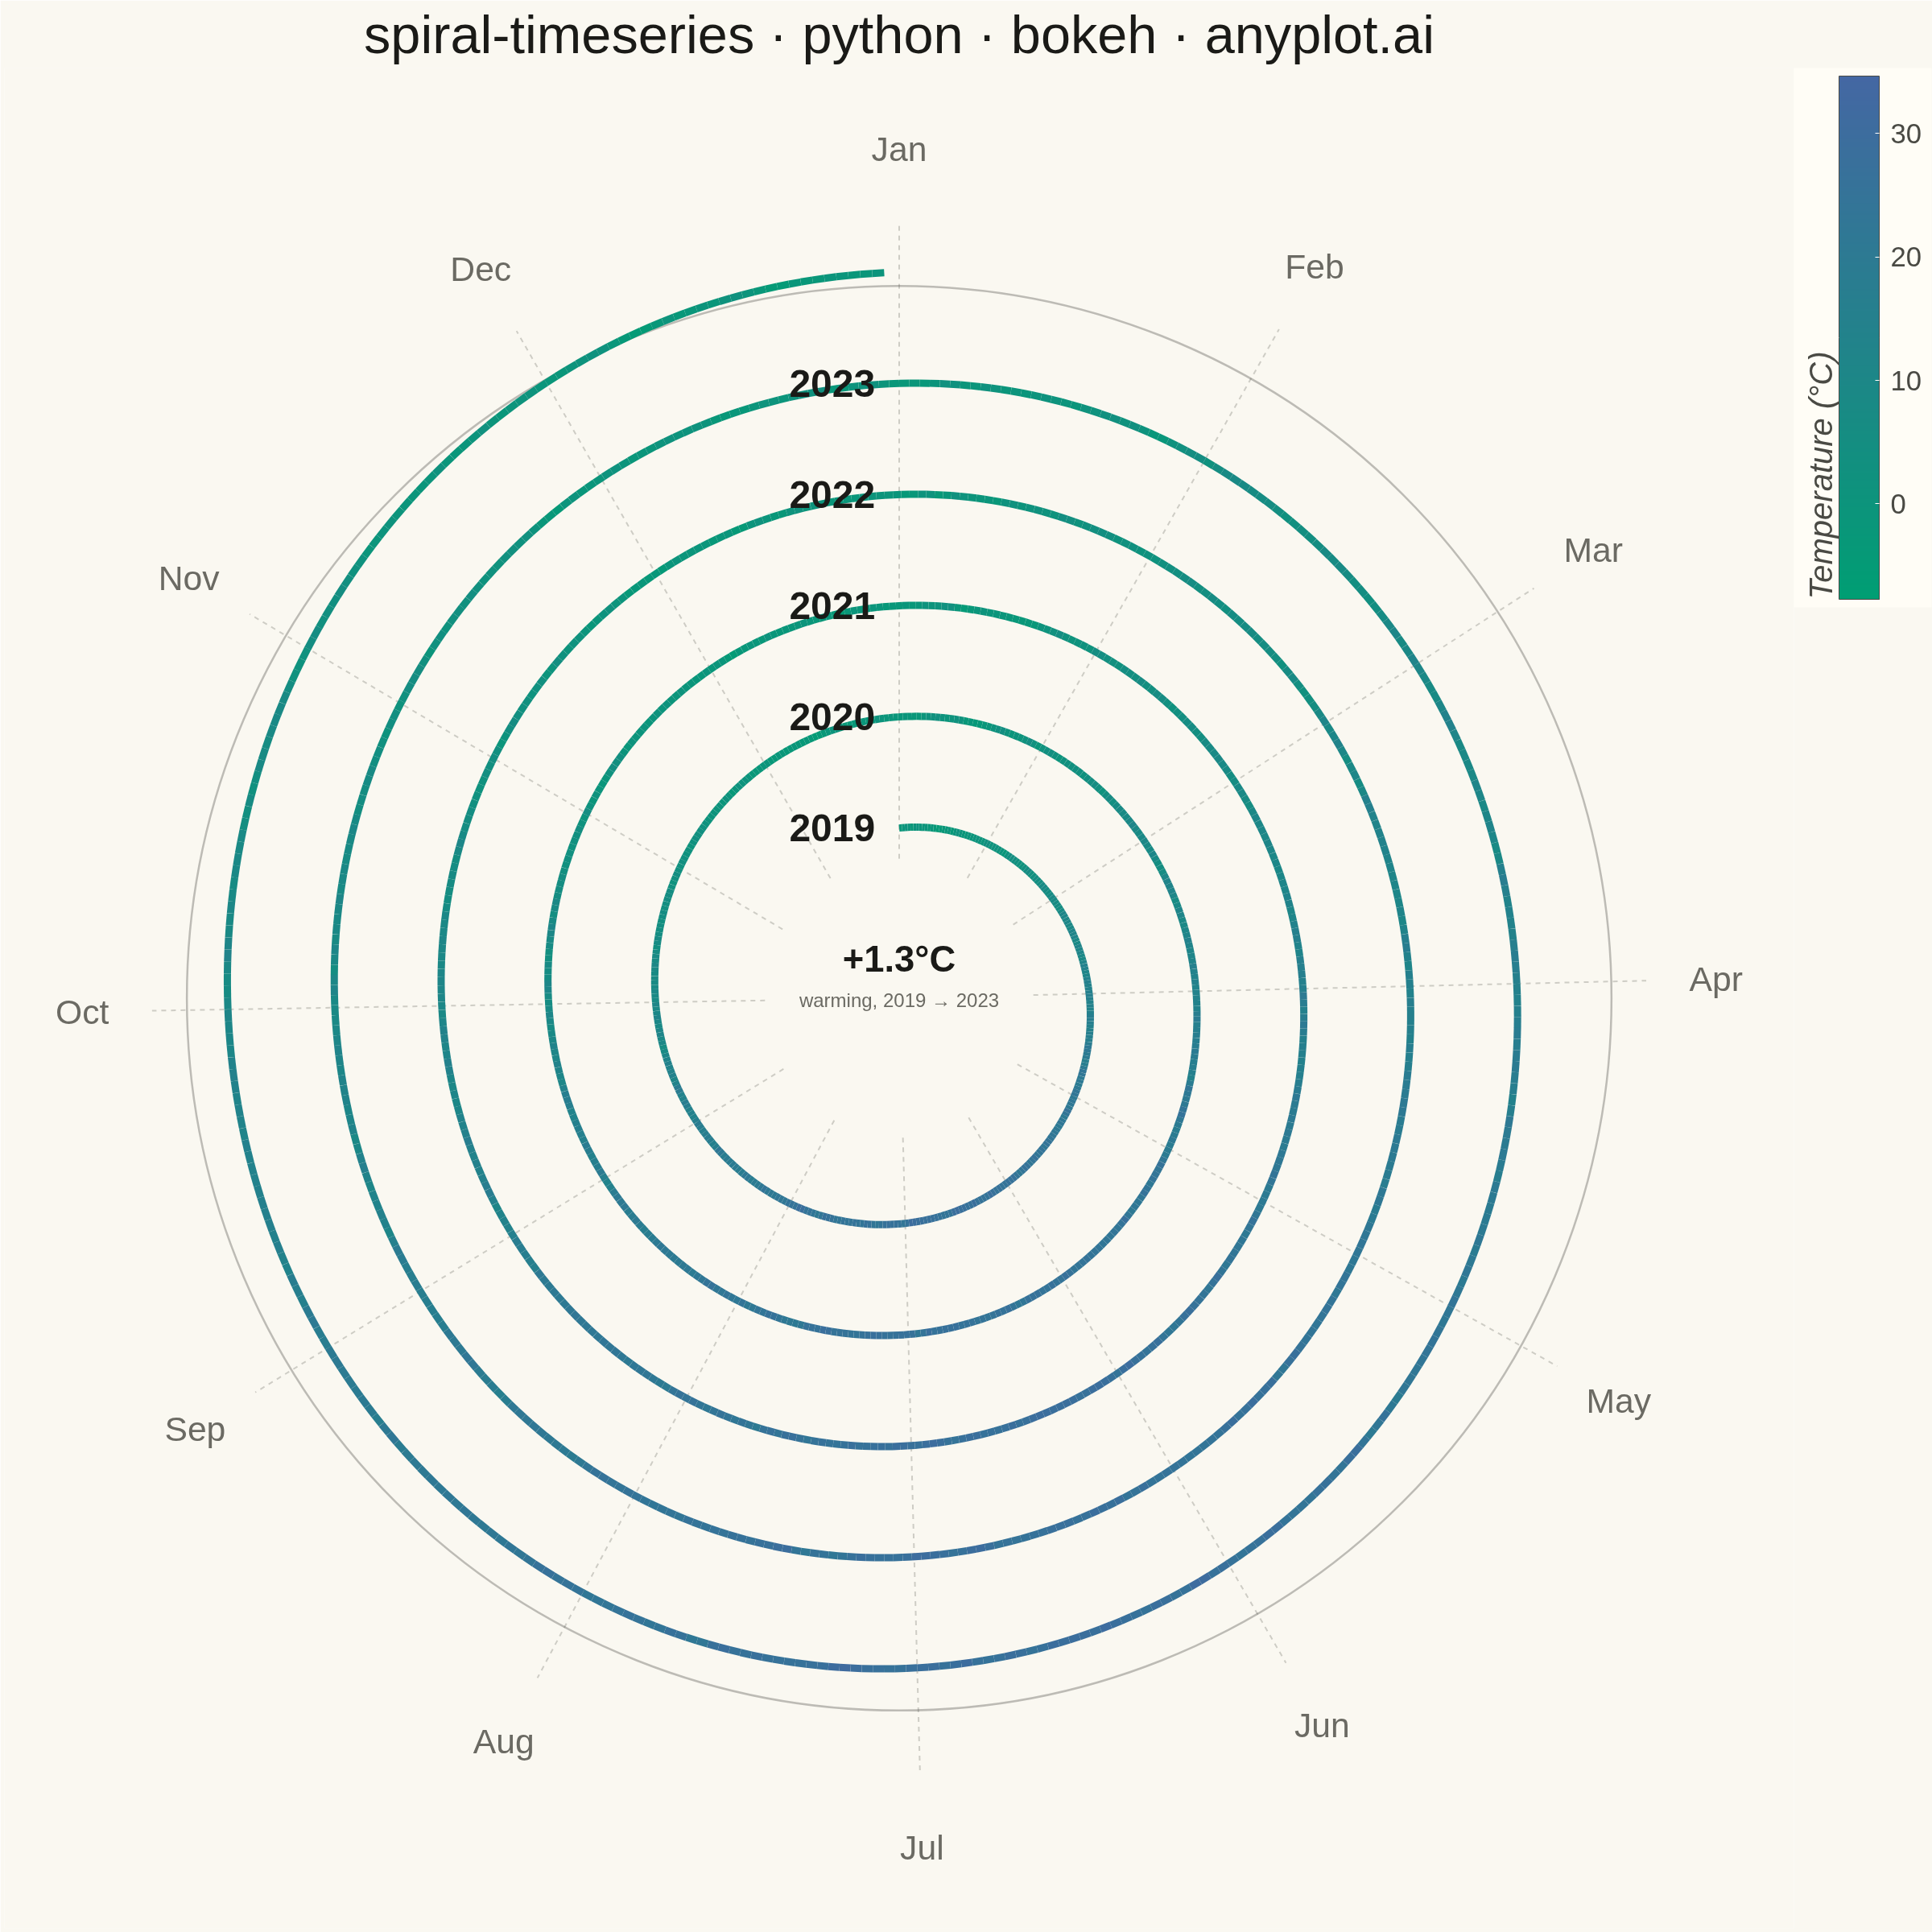
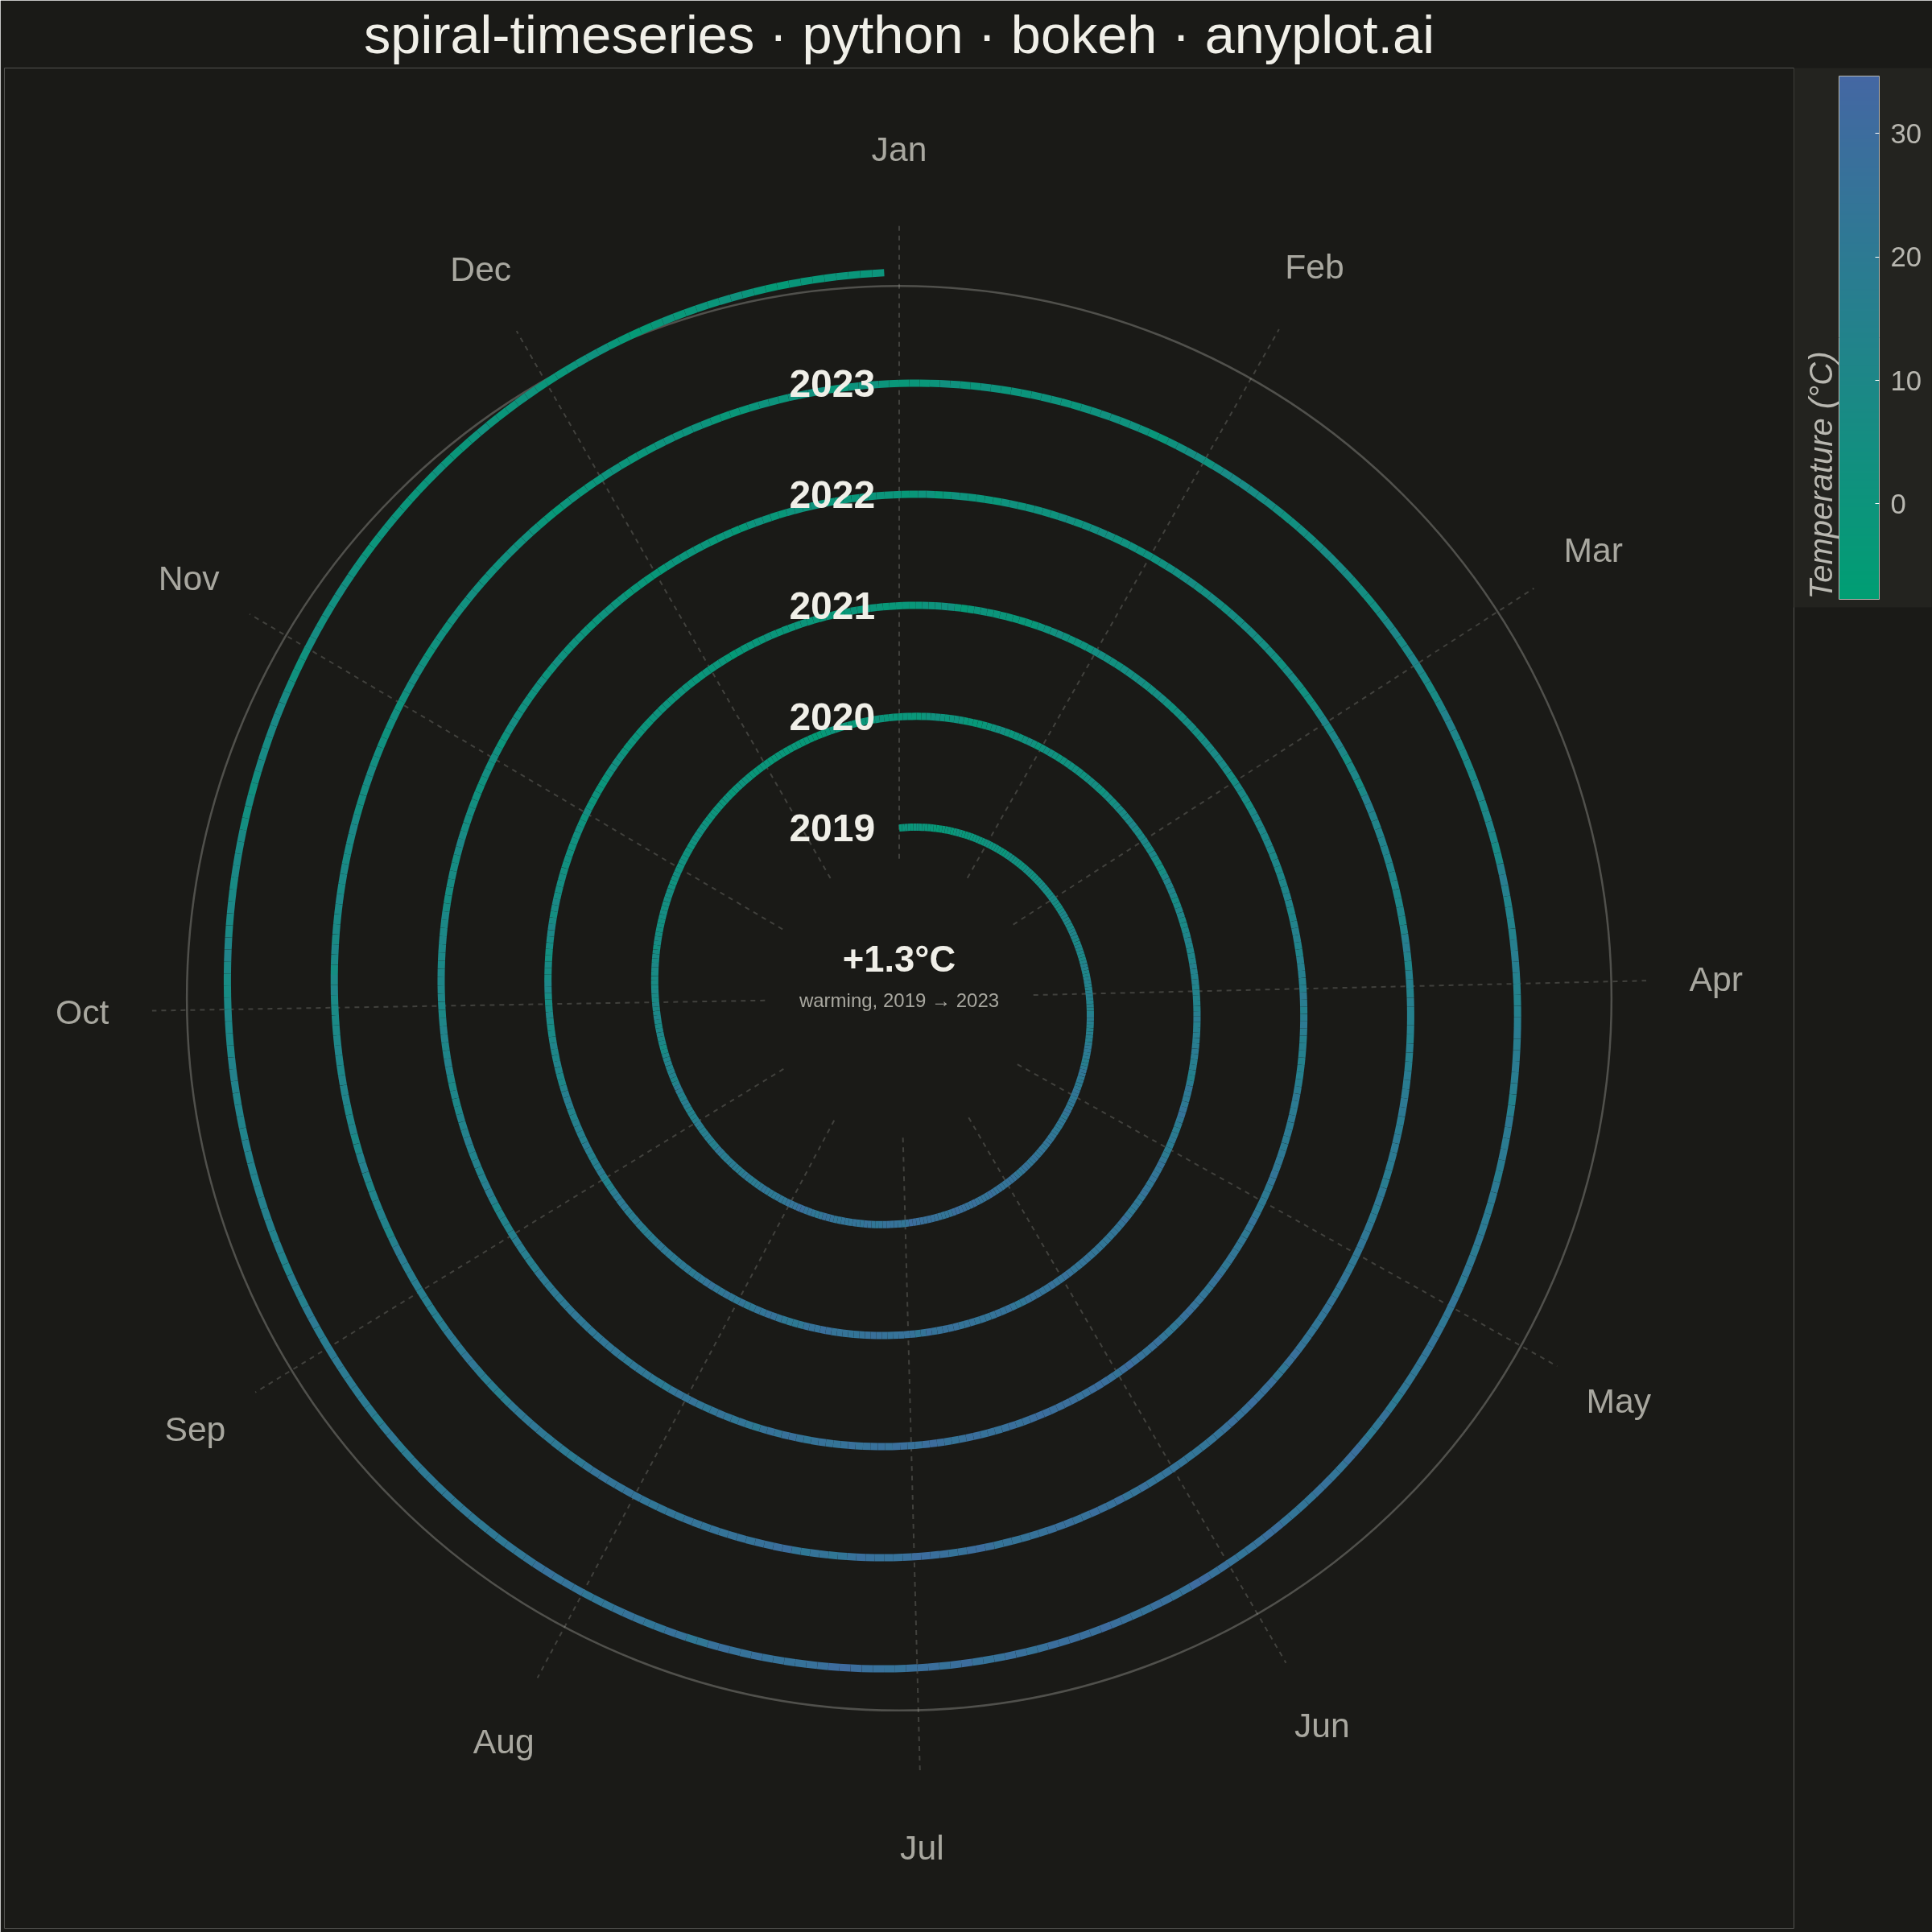
A time series plotted along a spiral (Archimedean or logarithmic), where each full revolution represents one cycle period (e.g., one year). By wrapping temporal data around a spiral, corresponding periods from different cycles align vertically, making recurring seasonal or periodic patterns immediately visible. This layout provides a compact alternative to long horizontal time series for cyclic data, revealing periodicity and trend simultaneously.
Preview render from the Bokeh implementation.