The same plot in 14 other libraries — JavaScript: Chart.js, D3.js, Highcharts, MUI X Charts; Python: Altair, Bokeh, lets-plot, Matplotlib, Plotly, plotnine, Pygal, Seaborn; R: ggplot2; Julia: Makie.jl. Compare all 15 side by side: Spiral Time Series Chart in Python, R, Julia and JavaScript.
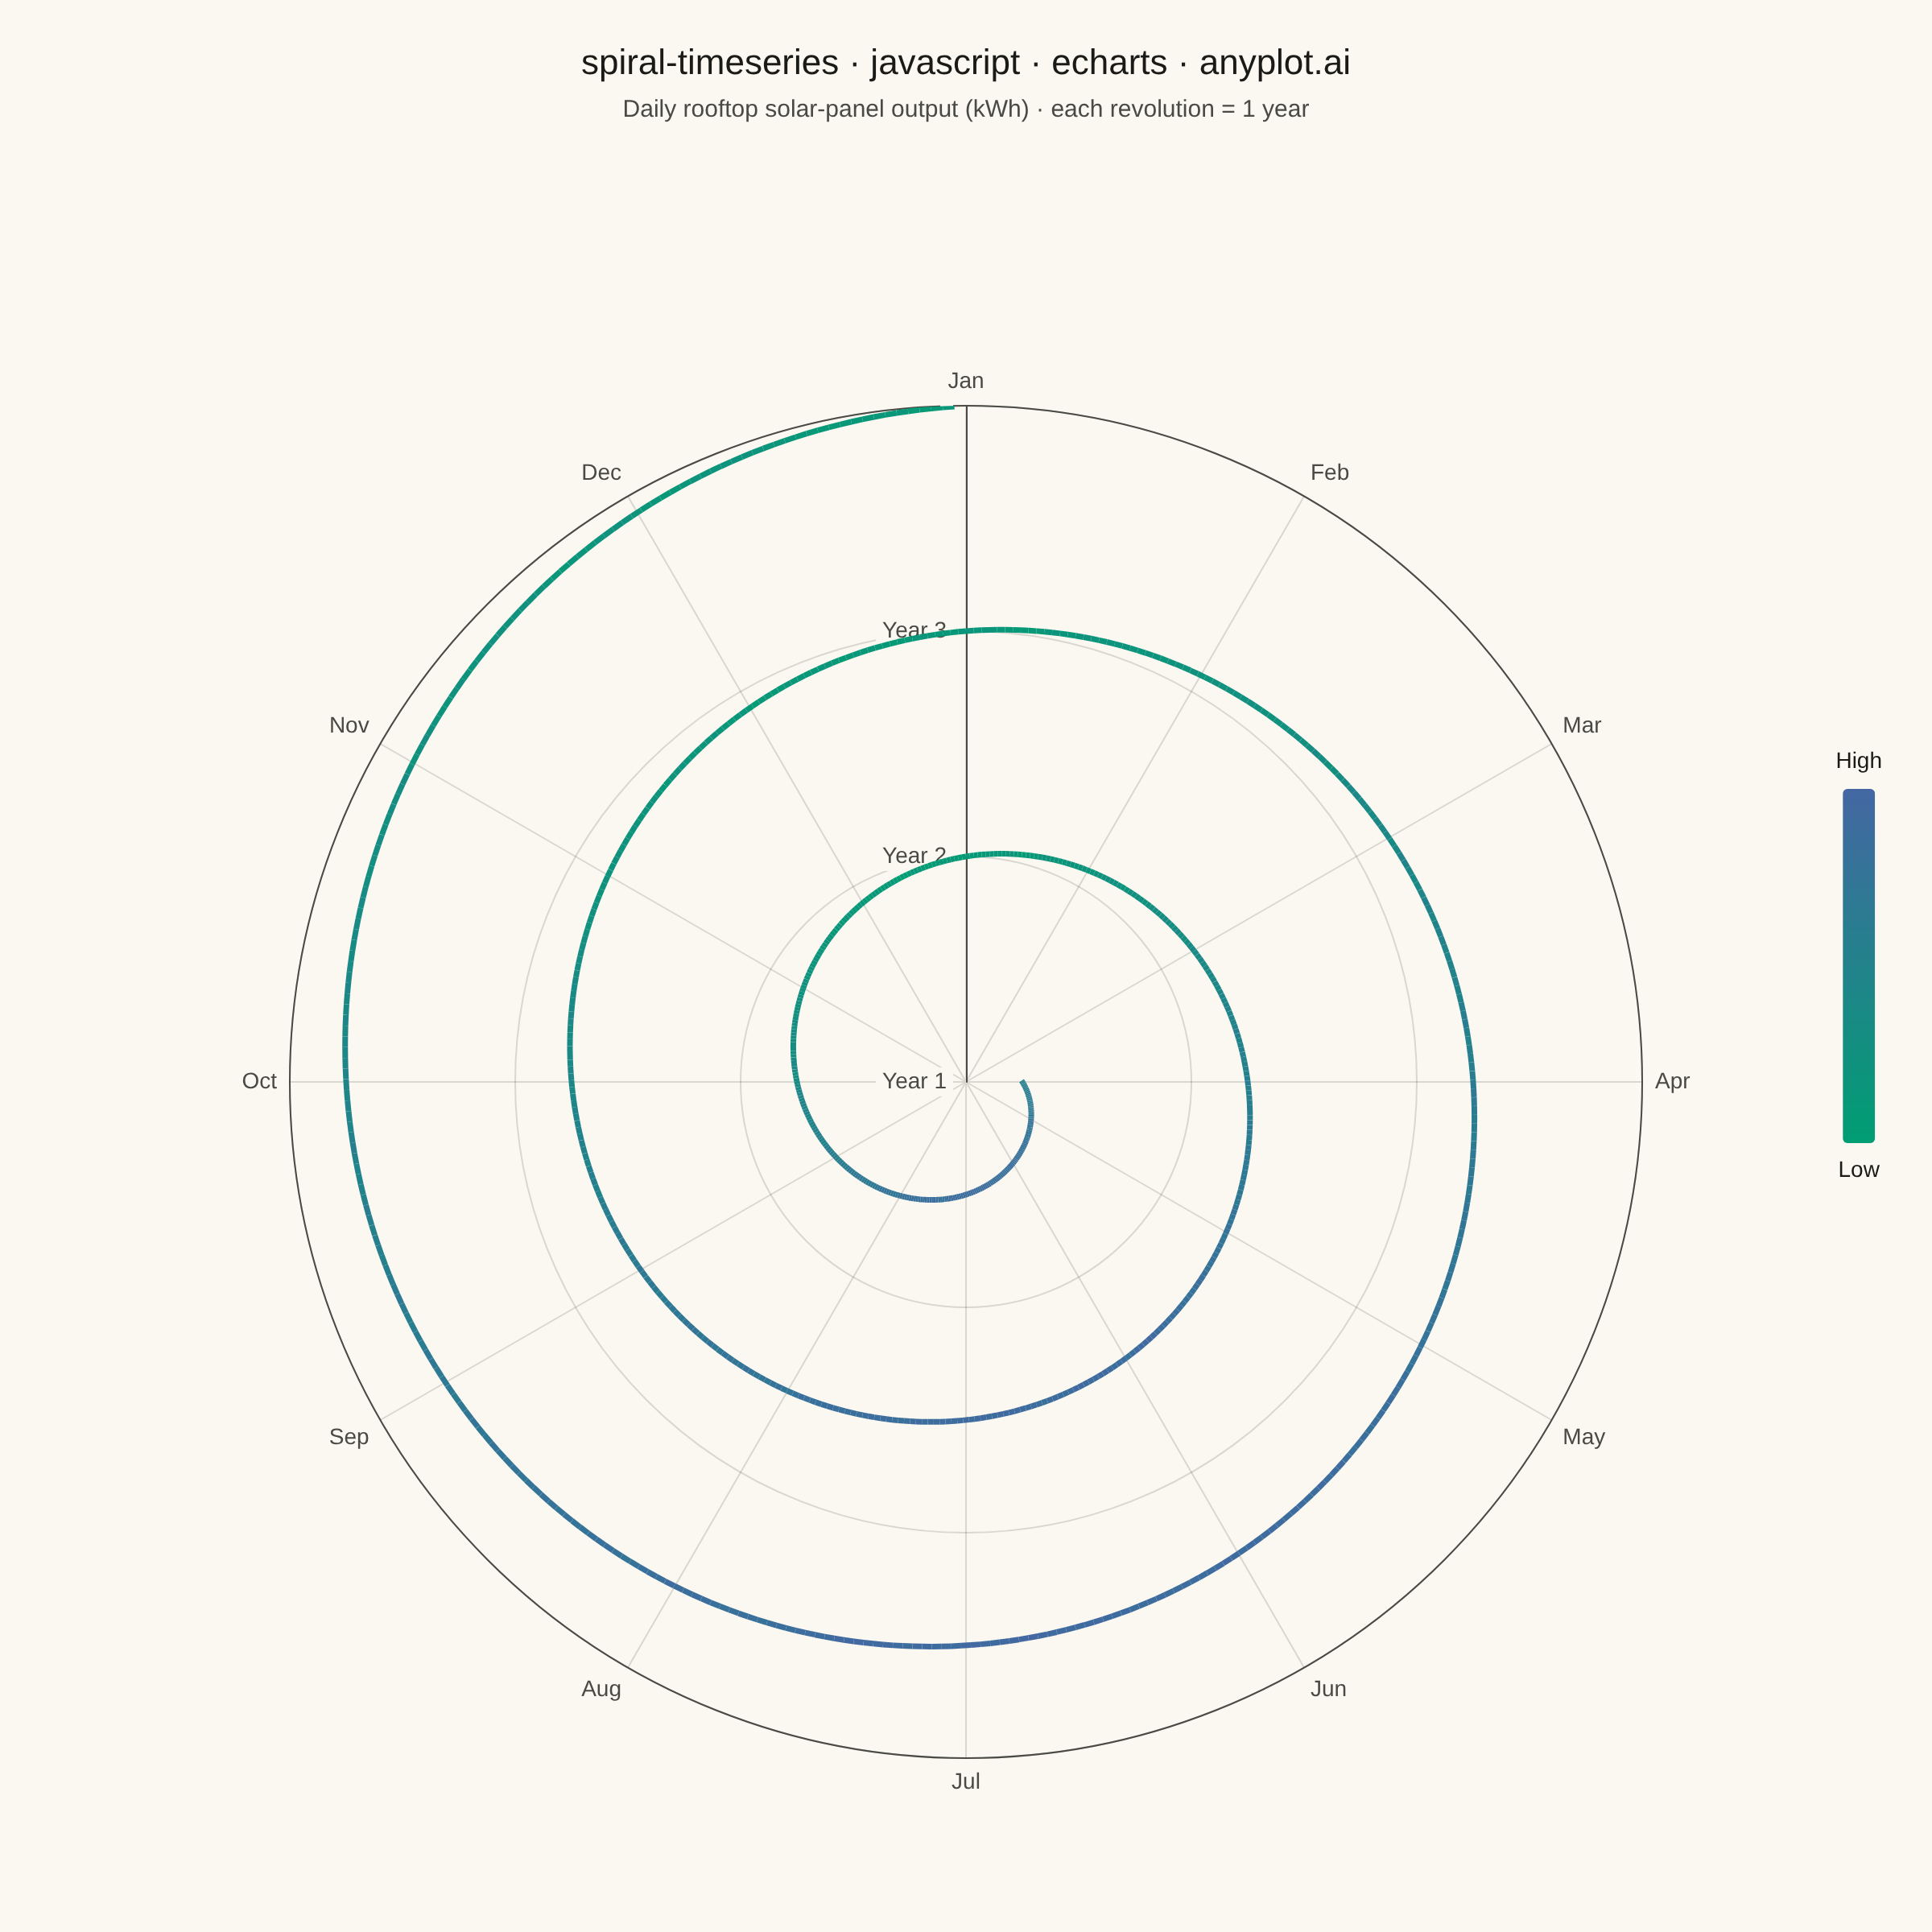
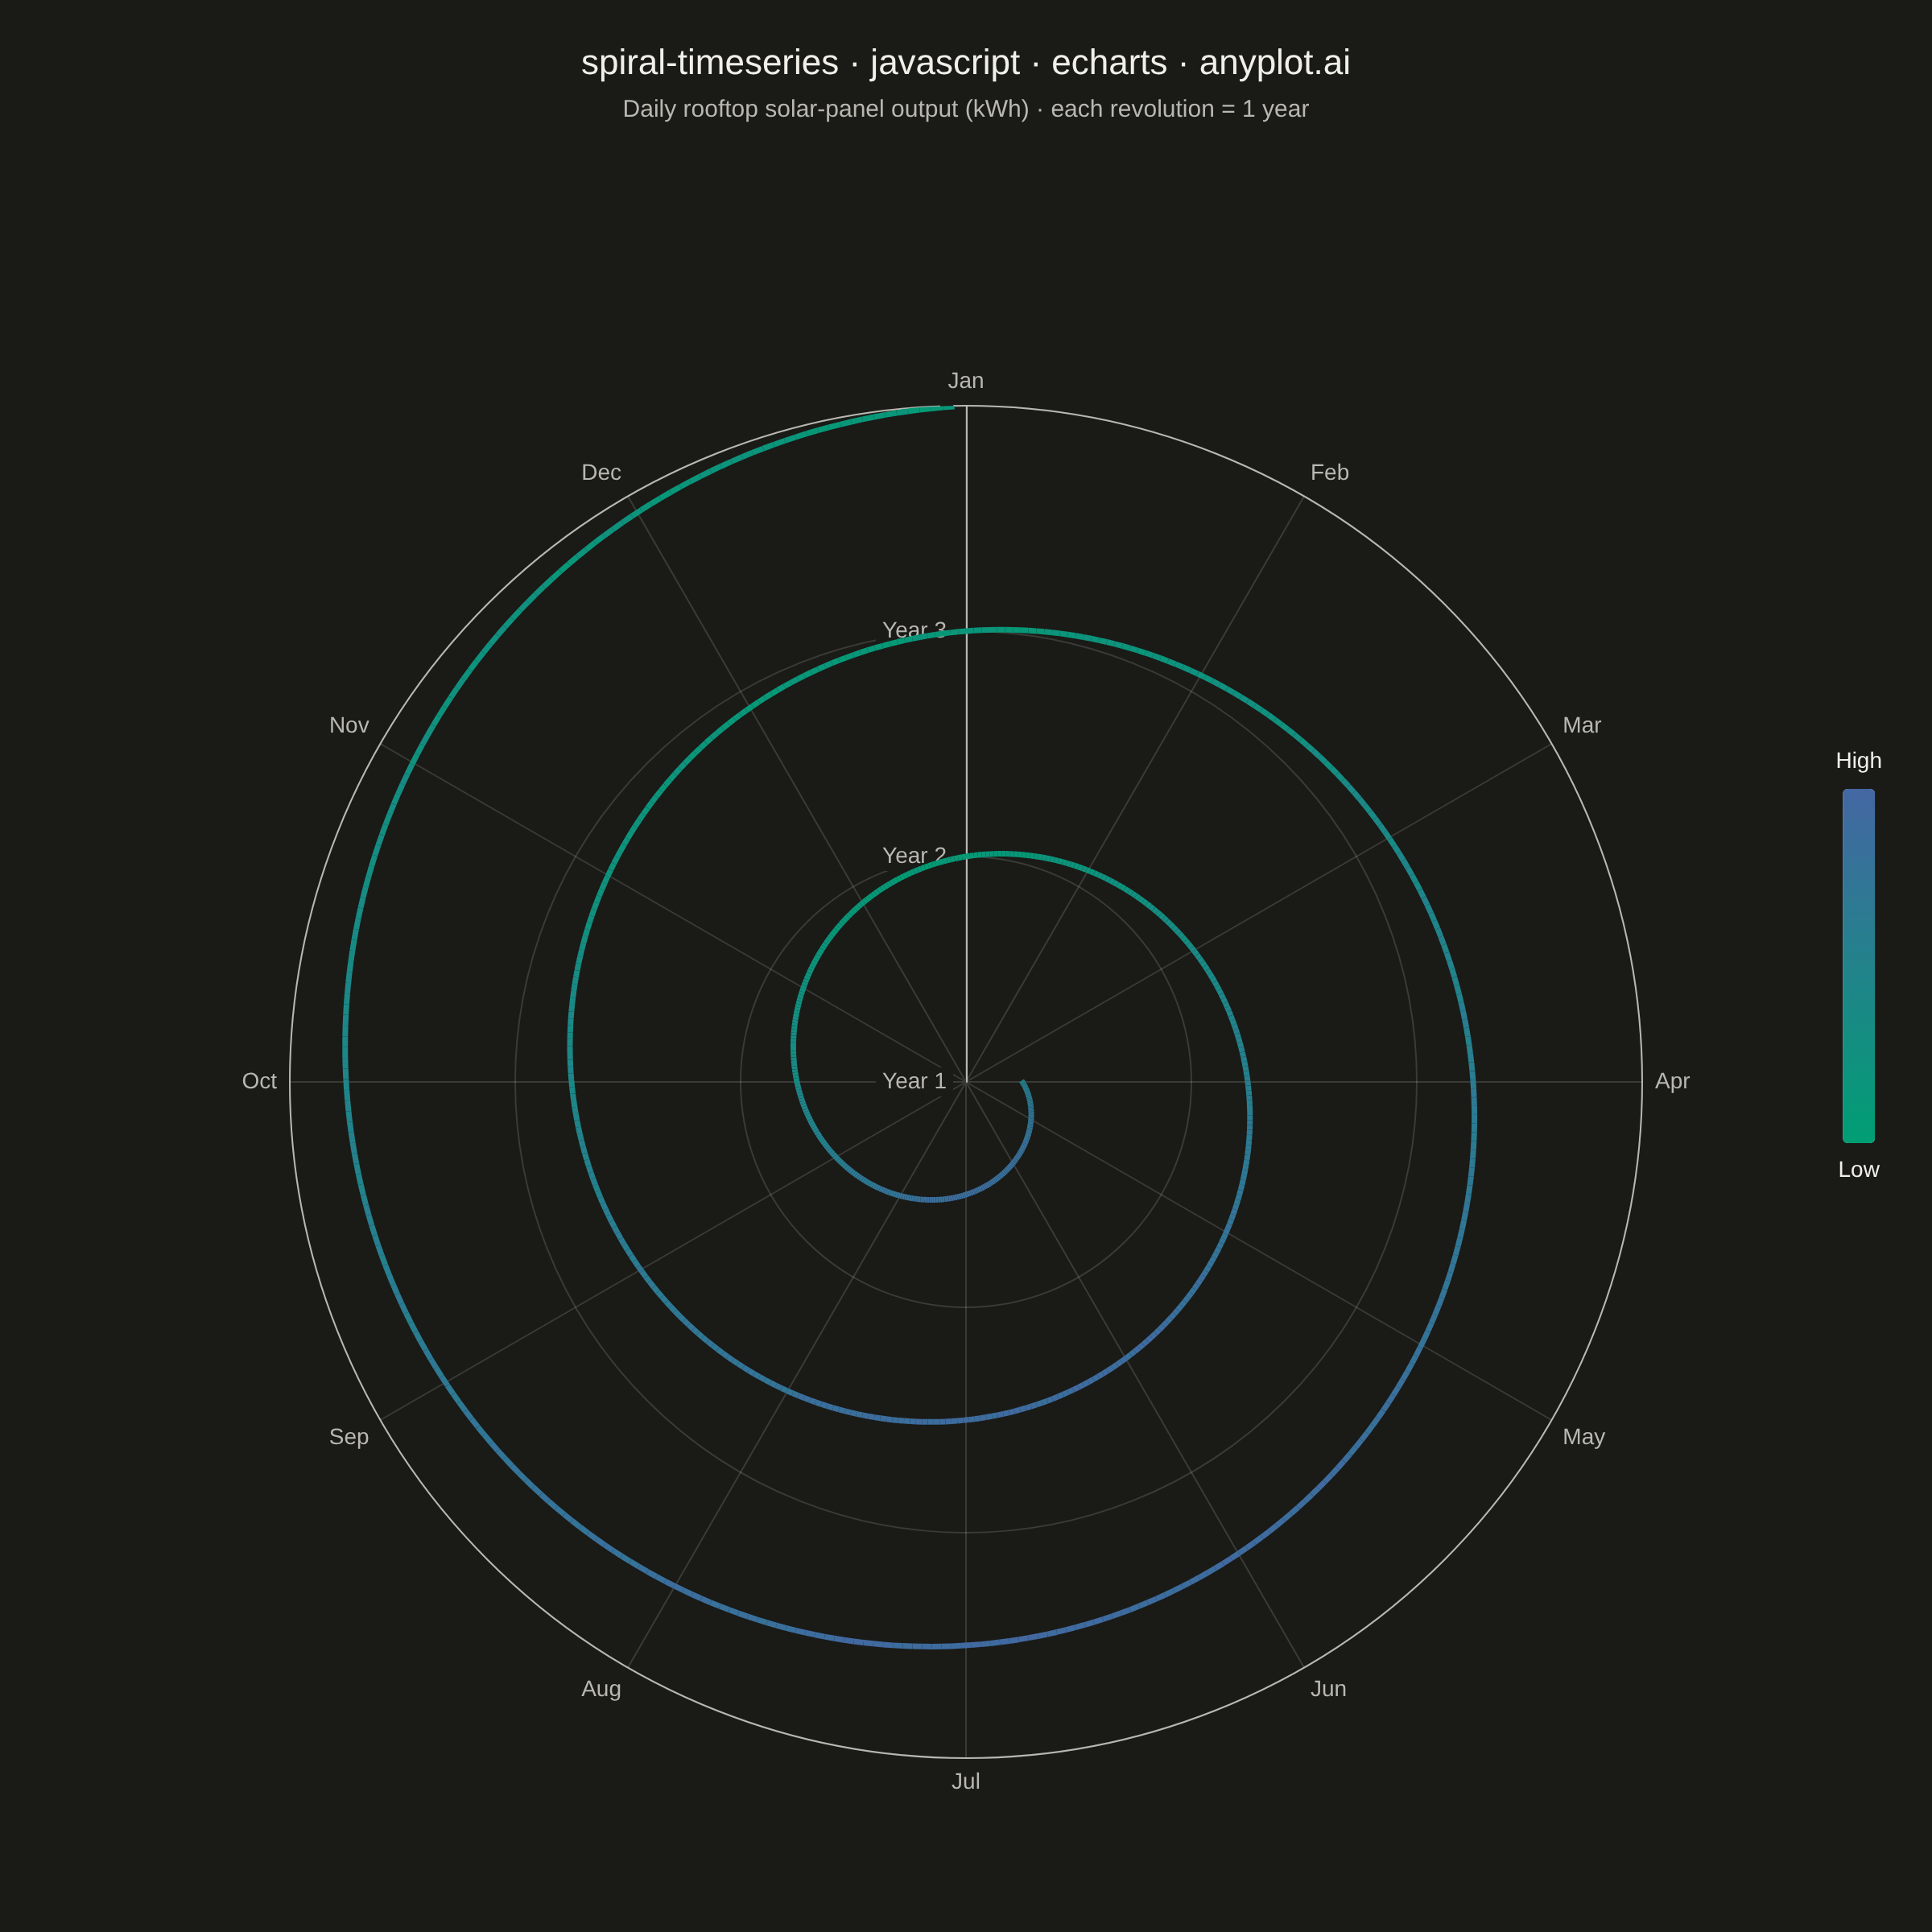
A time series plotted along a spiral (Archimedean or logarithmic), where each full revolution represents one cycle period (e.g., one year). By wrapping temporal data around a spiral, corresponding periods from different cycles align vertically, making recurring seasonal or periodic patterns immediately visible. This layout provides a compact alternative to long horizontal time series for cyclic data, revealing periodicity and trend simultaneously.
// anyplot.ai
// spiral-timeseries: Spiral Time Series Chart
// Library: echarts 6.1.0 | JavaScript 22.23.2
// Quality: 88/100 | Created: 2026-09-09
//# anyplot-orientation: square

const t = window.ANYPLOT_TOKENS;

// --- Data (in-memory, deterministic) ----------------------------------------
// Daily rooftop solar-panel energy output over 3 years. Each full spiral
// revolution is one year, so the same calendar day in different years lines
// up radially.
const monthNames = ["Jan", "Feb", "Mar", "Apr", "May", "Jun", "Jul", "Aug", "Sep", "Oct", "Nov", "Dec"];
const cyclesCount = 3;
const daysPerCycle = 365;
const baseOutput = 28; // kWh/day
const seasonalAmplitude = 16; // summer peak vs. winter trough
const yearlyGrowth = 1.2; // added panel capacity per year
const noiseAmplitude = 3;

// mulberry32: tiny deterministic PRNG (avoids float-precision issues that a
// classic LCG hits in JS once seed * multiplier exceeds 2^53).
let seed = 42;
const nextRandom = () => {
  seed = (seed + 0x6d2b79f5) | 0;
  let x = Math.imul(seed ^ (seed >>> 15), 1 | seed);
  x = (x + Math.imul(x ^ (x >>> 7), 61 | x)) ^ x;
  return ((x ^ (x >>> 14)) >>> 0) / 4294967296;
};

const spiralData = [];
for (let i = 0; i < cyclesCount * daysPerCycle; i += 1) {
  const cycleIndex = Math.floor(i / daysPerCycle);
  const dayOfYear = i % daysPerCycle;
  const cycleFraction = dayOfYear / daysPerCycle;
  const angleDeg = cycleFraction * 360; // position within the current cycle
  const radius = cycleIndex + cycleFraction; // grows continuously -> Archimedean spiral
  const seasonal = Math.cos((2 * Math.PI * (dayOfYear - 172)) / daysPerCycle); // peaks ~Jun 21
  const noise = nextRandom() * 2 - 1;
  const output = baseOutput + yearlyGrowth * cycleIndex + seasonalAmplitude * seasonal + noiseAmplitude * noise;
  spiralData.push([radius, angleDeg, output]);
}
const outputValues = spiralData.map((d) => d[2]);
const valueMin = Math.min(...outputValues);
const valueMax = Math.max(...outputValues);

// ECharts' visualMap does not recolor a polar-coordinate line series (it only
// drives itemStyle on symbols/points, which are hidden here). To make the
// color-encodes-value requirement actually render, split the spiral into one
// tiny line segment per consecutive pair of points and color each segment
// explicitly by interpolating the Imprint sequential gradient (t.seq).
const seqStart = hexToRgb(t.seq[0]);
const seqEnd = hexToRgb(t.seq[1]);
function hexToRgb(hex) {
  const clean = hex.replace("#", "");
  return [parseInt(clean.slice(0, 2), 16), parseInt(clean.slice(2, 4), 16), parseInt(clean.slice(4, 6), 16)];
}
function lerpColor(a, b, ratio) {
  const r = Math.round(a[0] + (b[0] - a[0]) * ratio);
  const g = Math.round(a[1] + (b[1] - a[1]) * ratio);
  const bl = Math.round(a[2] + (b[2] - a[2]) * ratio);
  return `rgb(${r}, ${g}, ${bl})`;
}

const spiralSegments = [];
for (let i = 0; i < spiralData.length - 1; i += 1) {
  const [r1, a1, v1] = spiralData[i];
  const [r2, a2, v2] = spiralData[i + 1];
  const ratio = ((v1 + v2) / 2 - valueMin) / (valueMax - valueMin);
  spiralSegments.push({
    type: "line",
    coordinateSystem: "polar",
    data: [
      [r1, a1],
      [r2, a2],
    ],
    encode: { radius: 0, angle: 1 },
    showSymbol: false,
    smooth: false,
    silent: true,
    lineStyle: { width: 3.5, color: lerpColor(seqStart, seqEnd, ratio) },
  });
}

// --- Init --------------------------------------------------------------------
const chart = echarts.init(document.getElementById("container"));

// --- Option --------------------------------------------------------------------
chart.setOption({
  animation: false,
  backgroundColor: "transparent",
  title: {
    text: "spiral-timeseries · javascript · echarts · anyplot.ai",
    subtext: "Daily rooftop solar-panel output (kWh) · each revolution = 1 year",
    left: "center",
    top: 24,
    textStyle: { color: t.ink, fontSize: 22, fontWeight: 500 },
    subtextStyle: { color: t.inkSoft, fontSize: 15 },
  },
  polar: {
    center: ["50%", "56%"],
    radius: "70%",
  },
  angleAxis: {
    type: "value",
    min: 0,
    max: 360,
    interval: 30,
    startAngle: 90,
    clockwise: true,
    axisLabel: {
      color: t.inkSoft,
      fontSize: 14,
      formatter: (value) => monthNames[Math.round(value / 30) % 12],
    },
    axisLine: { lineStyle: { color: t.inkSoft } },
    axisTick: { show: false },
    splitLine: { show: true, lineStyle: { color: t.grid } },
  },
  radiusAxis: {
    type: "value",
    min: 0,
    max: cyclesCount,
    interval: 1,
    axisLabel: {
      color: t.inkSoft,
      fontSize: 14,
      formatter: (value) => (value < cyclesCount ? `Year ${Math.round(value) + 1}` : ""),
      backgroundColor: t.pageBg,
      padding: [2, 4],
    },
    axisLine: { lineStyle: { color: t.inkSoft } },
    axisTick: { show: false },
    splitLine: { show: true, lineStyle: { color: t.grid } },
  },
  series: spiralSegments,
  visualMap: {
    type: "continuous",
    seriesIndex: [],
    min: valueMin,
    max: valueMax,
    orient: "vertical",
    right: 16,
    top: "middle",
    itemWidth: 20,
    itemHeight: 220,
    text: ["High", "Low"],
    inRange: { color: t.seq },
    textStyle: { color: t.ink, fontSize: 14 },
  },
});
Runnable source as JSON, for any HTTP client: https://api.anyplot.ai/specs/spiral-timeseries/echarts/code. Any spec id and library id listed in llms-full.txt fit the same URL shape; every URL below is complete and callable.
{
  "spec_id": "spiral-timeseries",
  "language": "javascript",
  "library": "echarts",
  "page": "https://anyplot.ai/spiral-timeseries/javascript/echarts",
  "hub": "https://anyplot.ai/spiral-timeseries",
  "code_json": "https://api.anyplot.ai/specs/spiral-timeseries/echarts/code",
  "spec_json": "https://api.anyplot.ai/specs/spiral-timeseries",
  "render_light_png": "https://storage.googleapis.com/anyplot-images/plots/spiral-timeseries/javascript/echarts/plot-light.png",
  "render_dark_png": "https://storage.googleapis.com/anyplot-images/plots/spiral-timeseries/javascript/echarts/plot-dark.png",
  "interactive_light_html": "https://storage.googleapis.com/anyplot-images/plots/spiral-timeseries/javascript/echarts/plot-light.html",
  "interactive_dark_html": "https://storage.googleapis.com/anyplot-images/plots/spiral-timeseries/javascript/echarts/plot-dark.html",
  "quality_score": 88.0,
  "license": "MIT",
  "guide": "https://anyplot.ai/llms.txt"
}
Part of Spiral Time Series Chart on anyplot.ai.