The same plot in 14 other libraries — JavaScript: Chart.js, D3.js, Apache ECharts, Highcharts; Python: Altair, Bokeh, lets-plot, Matplotlib, Plotly, plotnine, Pygal, Seaborn; R: ggplot2; Julia: Makie.jl. Compare all 15 side by side: Spiral Time Series Chart in Python, R, Julia and JavaScript.
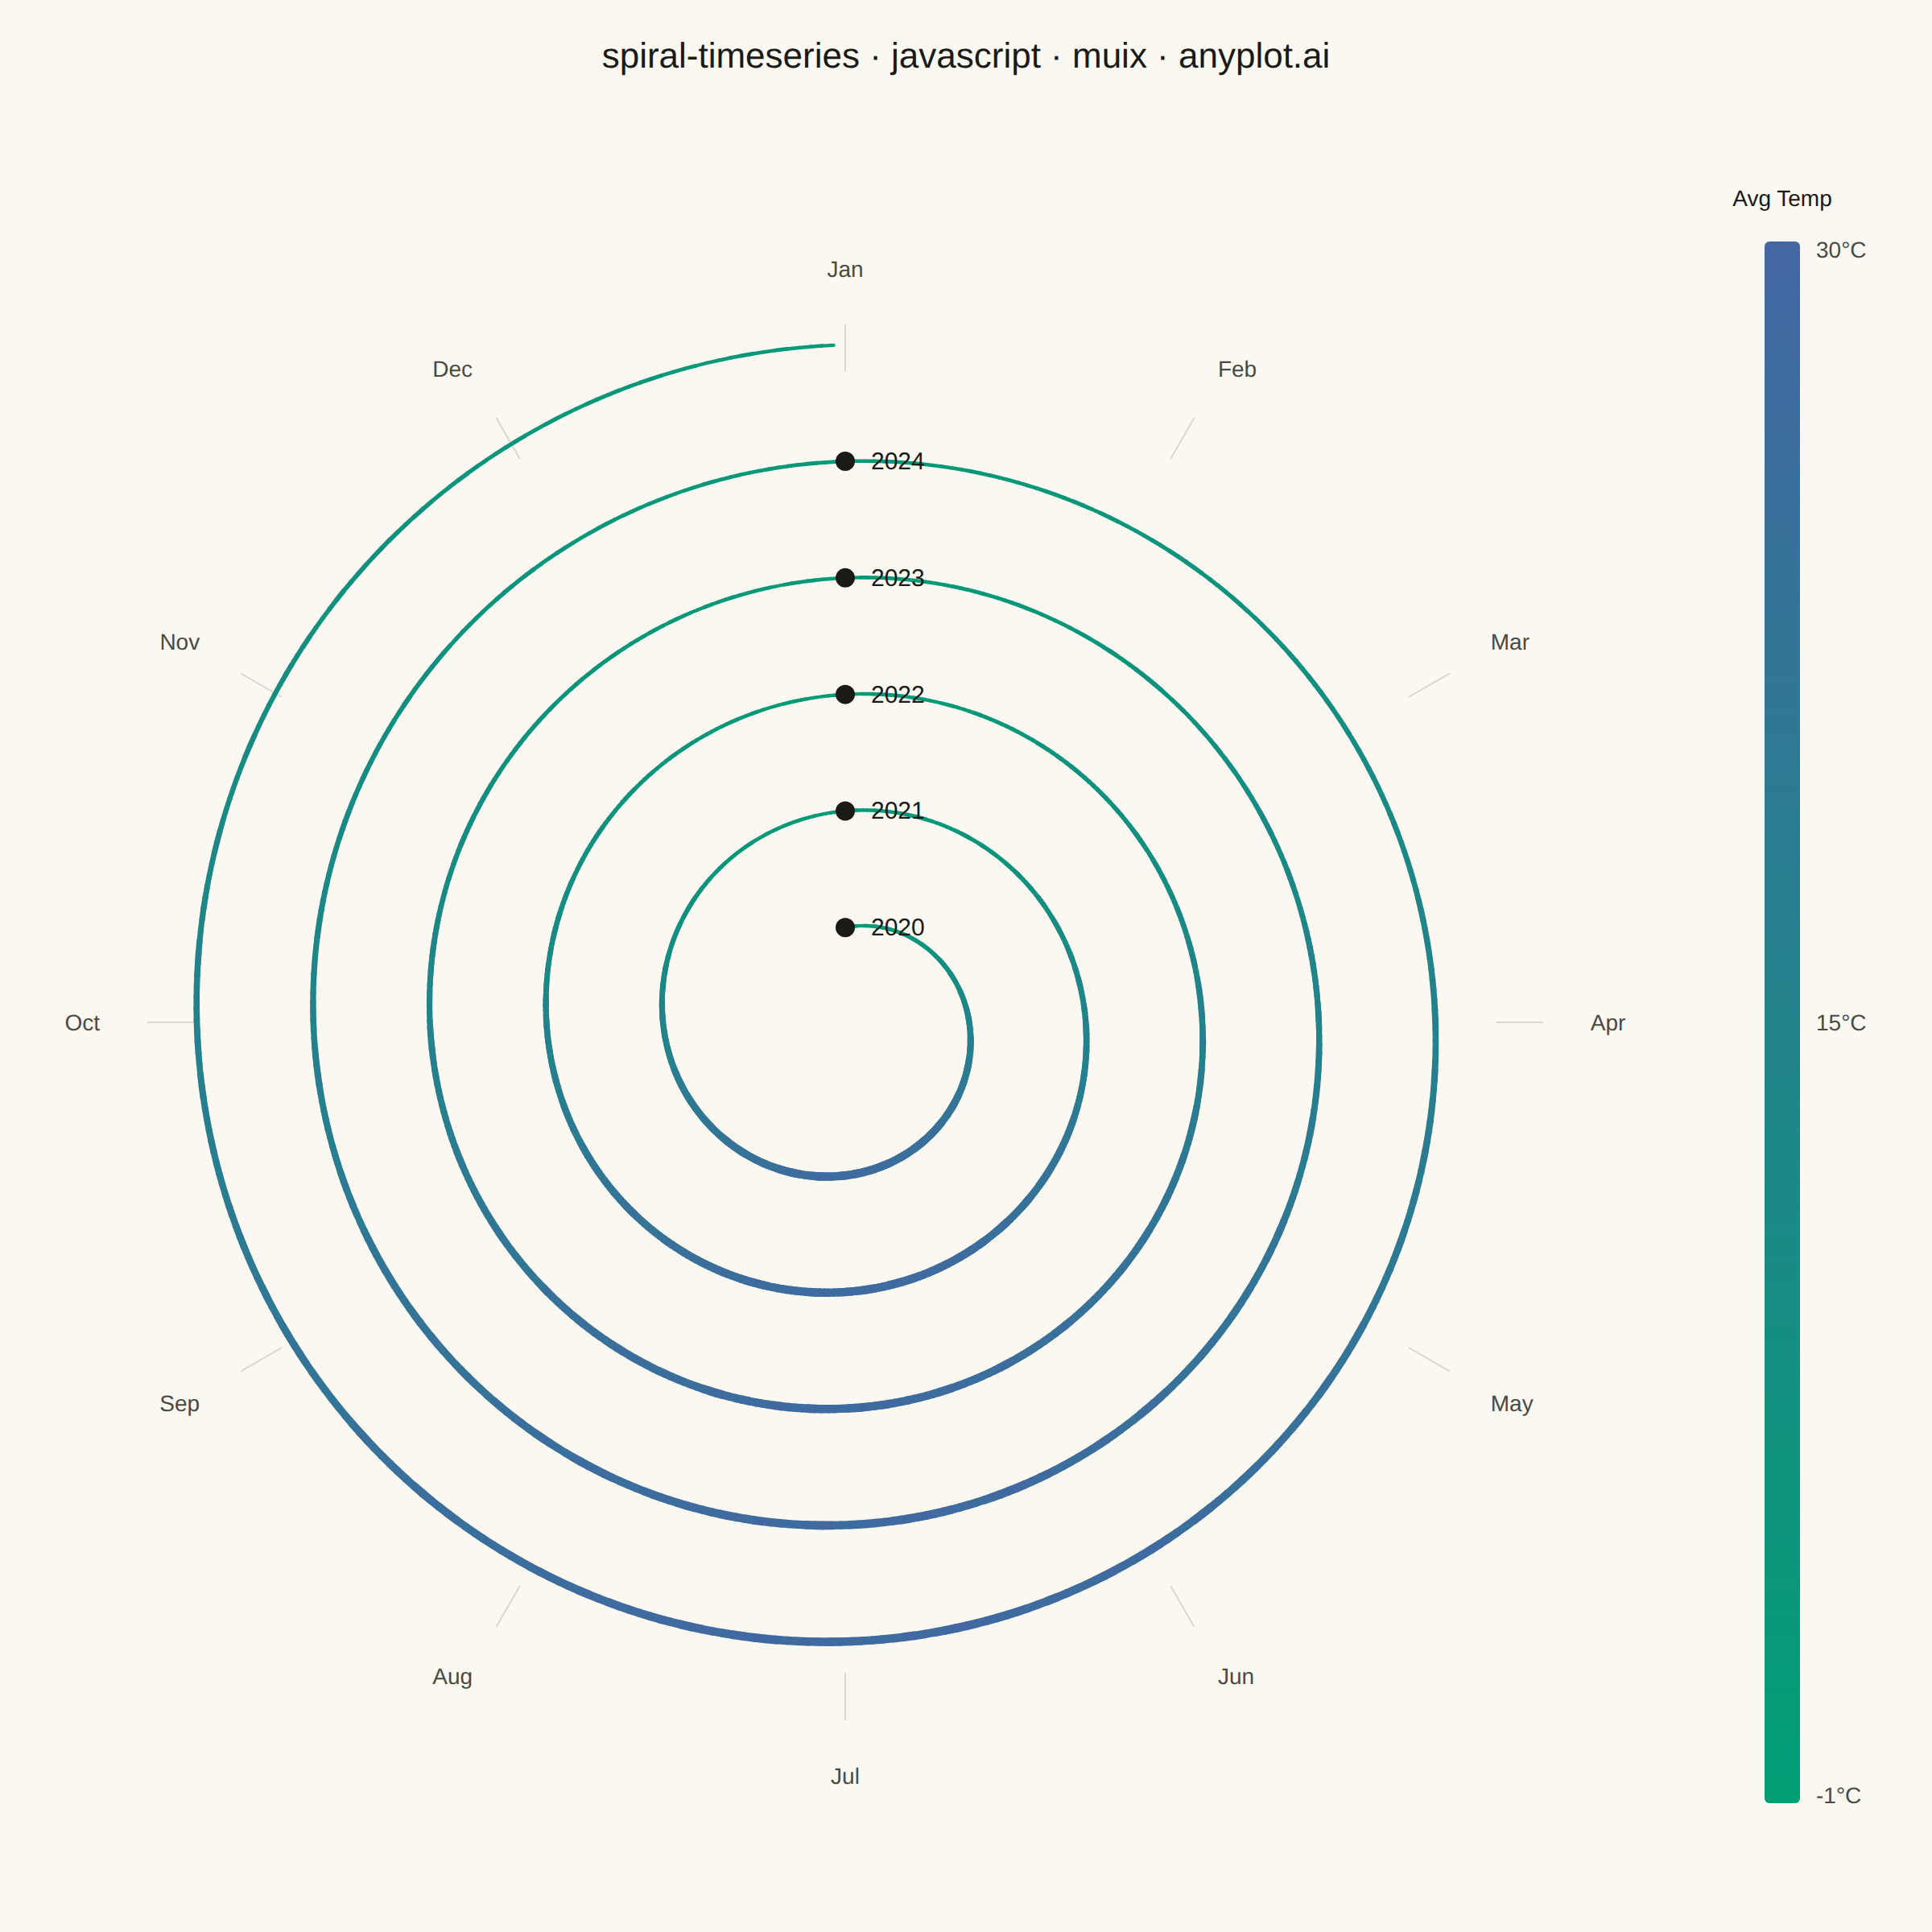
A time series plotted along a spiral (Archimedean or logarithmic), where each full revolution represents one cycle period (e.g., one year). By wrapping temporal data around a spiral, corresponding periods from different cycles align vertically, making recurring seasonal or periodic patterns immediately visible. This layout provides a compact alternative to long horizontal time series for cyclic data, revealing periodicity and trend simultaneously.
// anyplot.ai
// spiral-timeseries: Spiral Time Series Chart
// Library: muix 7.29.1 | JavaScript 22.23.2
// Quality: 87/100 | Created: 2026-09-09
//# anyplot-orientation: square
import { ChartContainer } from "@mui/x-charts/ChartContainer";
import { ChartsText } from "@mui/x-charts/ChartsText";
import { ScatterPlot } from "@mui/x-charts/ScatterChart";
import { ChartsTooltip } from "@mui/x-charts/ChartsTooltip";
import { useXScale, useYScale } from "@mui/x-charts/hooks";

const t = window.ANYPLOT_TOKENS;

// --- Daily average temperature, 5 years, deterministic (in-memory) ----------
// cycle_period = "year" — every full revolution of the spiral is one year, so
// seasons from different years line up radially and the multi-year warming
// trend shows up as later revolutions running consistently warmer.
const DAYS_PER_YEAR = 365;
const NUM_YEARS = 5;
const TOTAL_DAYS = DAYS_PER_YEAR * NUM_YEARS; // 1825 points — within the spec's 100–3000 range
const START_YEAR = 2020;

const BASE_TEMP_C = 14; // annual mean, mid-latitude climate
const SEASONAL_AMPLITUDE_C = 13; // coldest ~Jan, warmest ~Jul
const WARMING_PER_YEAR_C = 0.35; // slow trend, visible as outer revolutions running warmer
const NOISE_AMPLITUDE_C = 3.5;

// Tiny fixed-seed LCG — the browser has no seeded Math.random().
let lcgState = 42;
function nextRandom() {
  lcgState = (lcgState * 1103515245 + 12345) % 2147483648;
  return lcgState / 2147483648;
}

const dailyTemps = [];
for (let day = 0; day < TOTAL_DAYS; day++) {
  const dayOfYear = day % DAYS_PER_YEAR;
  const yearIndex = Math.floor(day / DAYS_PER_YEAR);
  const seasonal = -Math.cos((2 * Math.PI * dayOfYear) / DAYS_PER_YEAR) * SEASONAL_AMPLITUDE_C;
  const trend = WARMING_PER_YEAR_C * yearIndex;
  const noise = (nextRandom() - 0.5) * NOISE_AMPLITUDE_C;
  dailyTemps.push(BASE_TEMP_C + seasonal + trend + noise);
}
const V_MIN = Math.min(...dailyTemps);
const V_MAX = Math.max(...dailyTemps);

// --- Archimedean spiral geometry (constant spacing between revolutions) -----
// Radius grows continuously with elapsed time (not reset per cycle), so the
// earliest data sits closest to the center and each revolution is one year.
const R_MAX = 1;
const R_INNER = 0.14;
const REV_GAP = (R_MAX - R_INNER) / NUM_YEARS;

const spiralPoints = dailyTemps.map((value, day) => {
  const revolutions = day / DAYS_PER_YEAR;
  const angle = Math.PI / 2 - 2 * Math.PI * revolutions; // day 0 at top, clockwise like a clock face
  const radius = R_INNER + REV_GAP * revolutions;
  return { x: radius * Math.cos(angle), y: radius * Math.sin(angle), value };
});

// --- Imprint sequential colormap (green -> blue), value -> color ------------
function hexToRgb(hex) {
  const n = parseInt(hex.slice(1), 16);
  return [(n >> 16) & 255, (n >> 8) & 255, n & 255];
}
function mixColor(hexA, hexB, ratio) {
  const [ra, ga, ba] = hexToRgb(hexA);
  const [rb, gb, bb] = hexToRgb(hexB);
  const clamped = Math.min(1, Math.max(0, ratio));
  return `rgb(${Math.round(ra + (rb - ra) * clamped)}, ${Math.round(ga + (gb - ga) * clamped)}, ${Math.round(ba + (bb - ba) * clamped)})`;
}
function colorForValue(value) {
  return mixColor(t.seq[0], t.seq[1], (value - V_MIN) / (V_MAX - V_MIN));
}

const MONTH_LABELS = ["Jan", "Feb", "Mar", "Apr", "May", "Jun", "Jul", "Aug", "Sep", "Oct", "Nov", "Dec"];

// --- Overlay: the spiral itself, one short segment per day pair -------------
// Community `@mui/x-charts/hooks` (useXScale/useYScale) map the spiral's
// data-space (x, y) to pixels, same technique as the mohr-circle and
// smith-chart-basic implementations use for parametric curves.
function SpiralPath() {
  const xScale = useXScale();
  const yScale = useYScale();
  const toPx = (x, y) => ({ x: xScale(x), y: yScale(y) });

  const segments = [];
  for (let i = 1; i < spiralPoints.length; i++) {
    const a = spiralPoints[i - 1];
    const b = spiralPoints[i];
    const pa = toPx(a.x, a.y);
    const pb = toPx(b.x, b.y);
    const segValue = (a.value + b.value) / 2;
    // Color is the primary value encoding; a modest width ramp is a secondary one.
    const width = 2 + ((segValue - V_MIN) / (V_MAX - V_MIN)) * 3.5;
    segments.push(
      <line
        key={i}
        x1={pa.x}
        y1={pa.y}
        x2={pb.x}
        y2={pb.y}
        stroke={colorForValue(segValue)}
        strokeWidth={width}
        strokeLinecap="round"
      />,
    );
  }
  return <g>{segments}</g>;
}

// --- Overlay: radial grid lines subdividing each cycle into months ----------
function CycleGrid() {
  const xScale = useXScale();
  const yScale = useYScale();
  const toPx = (x, y) => ({ x: xScale(x), y: yScale(y) });
  const originPx = toPx(0, 0);

  return (
    <g>
      {MONTH_LABELS.map((label, m) => {
        const angle = Math.PI / 2 - (m / 12) * 2 * Math.PI;
        // Short tick near the outer rim (not a full-radius spoke) so the
        // grid marks the month position without cutting across all 5
        // spiral revolutions.
        const tickInnerPx = toPx(R_MAX * 0.96 * Math.cos(angle), R_MAX * 0.96 * Math.sin(angle));
        const tickOuterPx = toPx(R_MAX * 1.03 * Math.cos(angle), R_MAX * 1.03 * Math.sin(angle));
        const labelPx = toPx(R_MAX * 1.1 * Math.cos(angle), R_MAX * 1.1 * Math.sin(angle));
        const dx = labelPx.x - originPx.x;
        const dy = labelPx.y - originPx.y;
        const dist = Math.hypot(dx, dy) || 1;
        const ux = dx / dist;
        const uy = dy / dist;
        return (
          <g key={label}>
            <line x1={tickInnerPx.x} y1={tickInnerPx.y} x2={tickOuterPx.x} y2={tickOuterPx.y} stroke={t.grid} strokeWidth={1} />
            <ChartsText
              x={labelPx.x}
              y={labelPx.y}
              text={label}
              style={{
                fontSize: 14,
                fill: t.inkSoft,
                textAnchor: ux >= 0.3 ? "start" : ux <= -0.3 ? "end" : "middle",
                dominantBaseline: uy >= 0.3 ? "hanging" : uy <= -0.3 ? "auto" : "central",
              }}
            />
          </g>
        );
      })}
    </g>
  );
}

// --- Cycle-start (year) markers, as a real MUI X scatter series -------------
// Routed through the library's own scatter series/plugin (rendered by
// <ScatterPlot/> below) rather than hand-drawn <circle> elements, so the
// component exercises actual MUI X charting machinery — including its
// built-in item tooltip — not just the coordinate-scale hooks.
const cycleStartPoints = Array.from({ length: NUM_YEARS }, (_, k) => ({
  x: 0,
  y: R_INNER + REV_GAP * k, // angle = top spoke, where every cycle begins
  id: k,
  year: START_YEAR + k,
}));
const cycleStartSeries = [
  {
    type: "scatter",
    id: "cycle-start",
    label: "Cycle start (year)",
    color: t.ink,
    markerSize: 6,
    data: cycleStartPoints,
    valueFormatter: (point) => `${point.year}`,
  },
];

// --- Overlay: label the start of each cycle (year) for orientation ----------
// The scatter series above draws the marker dot; this only adds the year text.
function CycleStartLabels() {
  const xScale = useXScale();
  const yScale = useYScale();
  const toPx = (x, y) => ({ x: xScale(x), y: yScale(y) });

  return (
    <g>
      {cycleStartPoints.map((point) => {
        const pointPx = toPx(point.x, point.y);
        return (
          <ChartsText
            key={point.id}
            x={pointPx.x + 16}
            y={pointPx.y}
            text={String(point.year)}
            style={{ fontSize: 15, fontWeight: 500, fill: t.ink, dominantBaseline: "central" }}
          />
        );
      })}
    </g>
  );
}

// --- Overlay: color legend for the value-to-color mapping -------------------
// Drawn in the SVG's own pixel space (no data scale) inside the right margin
// reserved by MARGIN below.
function ColorLegend() {
  const legendX = window.ANYPLOT_SIZE.width - LEGEND_WIDTH + 46;
  const legendTop = BASE_MARGIN + 20;
  const legendBottom = CHART_HEIGHT - BASE_MARGIN - 20;
  const barWidth = 22;

  return (
    <g>
      <defs>
        <linearGradient id="spiralTempScale" x1="0" y1="0" x2="0" y2="1">
          <stop offset="0%" stopColor={t.seq[1]} />
          <stop offset="100%" stopColor={t.seq[0]} />
        </linearGradient>
      </defs>
      <ChartsText
        x={legendX + barWidth / 2}
        y={legendTop - 22}
        text="Avg Temp"
        style={{ fontSize: 14, fontWeight: 500, fill: t.ink, textAnchor: "middle" }}
      />
      <rect x={legendX} y={legendTop} width={barWidth} height={legendBottom - legendTop} fill="url(#spiralTempScale)" rx={3} />
      <ChartsText
        x={legendX + barWidth + 10}
        y={legendTop}
        text={`${Math.round(V_MAX)}°C`}
        style={{ fontSize: 14, fill: t.inkSoft, dominantBaseline: "hanging" }}
      />
      <ChartsText
        x={legendX + barWidth + 10}
        y={(legendTop + legendBottom) / 2}
        text={`${Math.round((V_MIN + V_MAX) / 2)}°C`}
        style={{ fontSize: 14, fill: t.inkSoft, dominantBaseline: "central" }}
      />
      <ChartsText
        x={legendX + barWidth + 10}
        y={legendBottom}
        text={`${Math.round(V_MIN)}°C`}
        style={{ fontSize: 14, fill: t.inkSoft, dominantBaseline: "auto" }}
      />
    </g>
  );
}

const TITLE = "spiral-timeseries · javascript · muix · anyplot.ai";
const TITLE_HEIGHT = 70;
const LEGEND_WIDTH = 150;
const BASE_MARGIN = 60;
const CHART_HEIGHT = window.ANYPLOT_SIZE.height - TITLE_HEIGHT;

// Equal-size square drawing area (left/right margins absorb the legend
// gutter) is required for the spiral to render as a true circle, not an oval.
const AVAILABLE_WIDTH = window.ANYPLOT_SIZE.width - LEGEND_WIDTH;
const SQUARE_SIDE = CHART_HEIGHT - 2 * BASE_MARGIN;
const SIDE_MARGIN = (AVAILABLE_WIDTH - SQUARE_SIDE) / 2;
const MARGIN = { top: BASE_MARGIN, bottom: BASE_MARGIN, left: SIDE_MARGIN, right: SIDE_MARGIN + LEGEND_WIDTH };

// --- Chart (default-exported component — the harness mounts it) -------------
export default function Chart() {
  return (
    <div
      style={{
        width: window.ANYPLOT_SIZE.width,
        height: window.ANYPLOT_SIZE.height,
        display: "flex",
        flexDirection: "column",
      }}
    >
      <div
        style={{
          height: TITLE_HEIGHT,
          display: "flex",
          alignItems: "center",
          justifyContent: "center",
          fontSize: 22,
          fontWeight: 500,
          color: t.ink,
        }}
      >
        {TITLE}
      </div>
      <ChartContainer
        width={window.ANYPLOT_SIZE.width}
        height={CHART_HEIGHT}
        margin={MARGIN}
        series={cycleStartSeries}
        skipAnimation
        disableVoronoi
        xAxis={[{ scaleType: "linear", min: -R_MAX * 1.2, max: R_MAX * 1.2 }]}
        yAxis={[{ scaleType: "linear", min: -R_MAX * 1.2, max: R_MAX * 1.2 }]}
      >
        <CycleGrid />
        <SpiralPath />
        <ScatterPlot />
        <CycleStartLabels />
        <ColorLegend />
        <ChartsTooltip trigger="item" />
      </ChartContainer>
    </div>
  );
}
Runnable source as JSON, for any HTTP client: https://api.anyplot.ai/specs/spiral-timeseries/muix/code. Any spec id and library id listed in llms-full.txt fit the same URL shape; every URL below is complete and callable.
{
  "spec_id": "spiral-timeseries",
  "language": "javascript",
  "library": "muix",
  "page": "https://anyplot.ai/spiral-timeseries/javascript/muix",
  "hub": "https://anyplot.ai/spiral-timeseries",
  "code_json": "https://api.anyplot.ai/specs/spiral-timeseries/muix/code",
  "spec_json": "https://api.anyplot.ai/specs/spiral-timeseries",
  "render_light_png": "https://storage.googleapis.com/anyplot-images/plots/spiral-timeseries/javascript/muix/plot-light.png",
  "render_dark_png": "https://storage.googleapis.com/anyplot-images/plots/spiral-timeseries/javascript/muix/plot-dark.png",
  "interactive_light_html": "https://storage.googleapis.com/anyplot-images/plots/spiral-timeseries/javascript/muix/plot-light.html",
  "interactive_dark_html": "https://storage.googleapis.com/anyplot-images/plots/spiral-timeseries/javascript/muix/plot-dark.html",
  "quality_score": 87.0,
  "license": "MIT",
  "guide": "https://anyplot.ai/llms.txt"
}
Part of Spiral Time Series Chart on anyplot.ai.