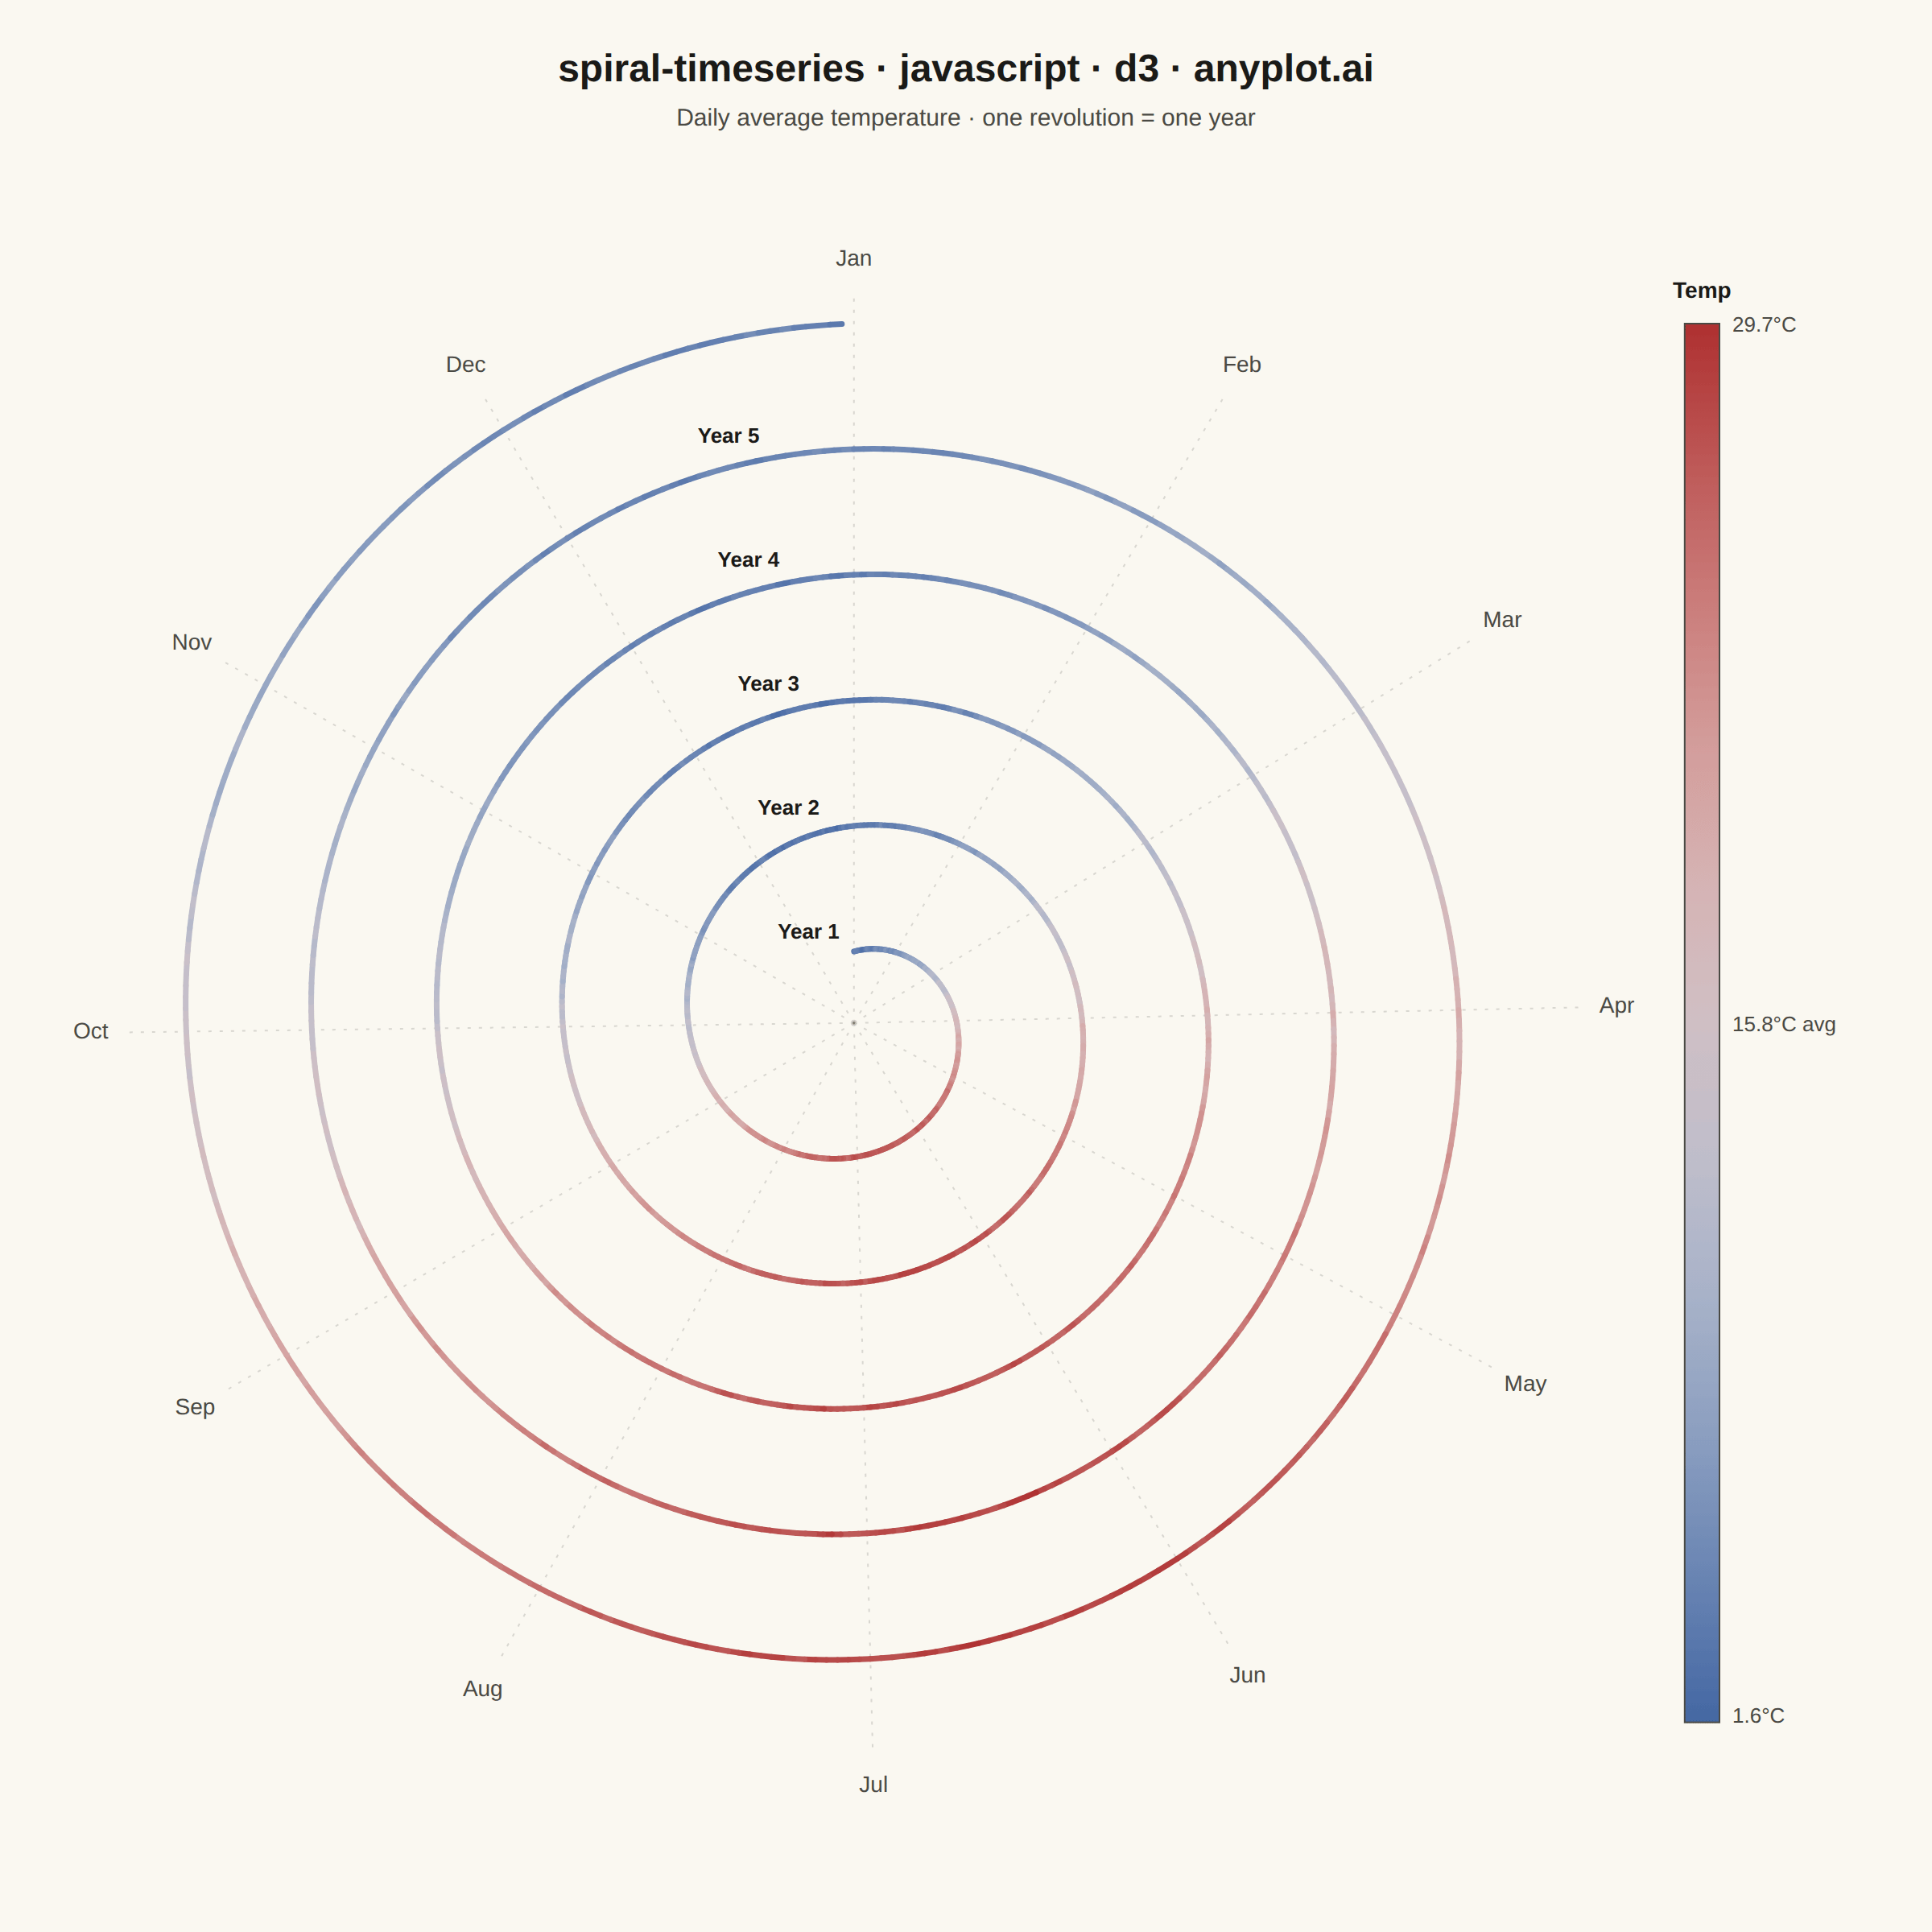
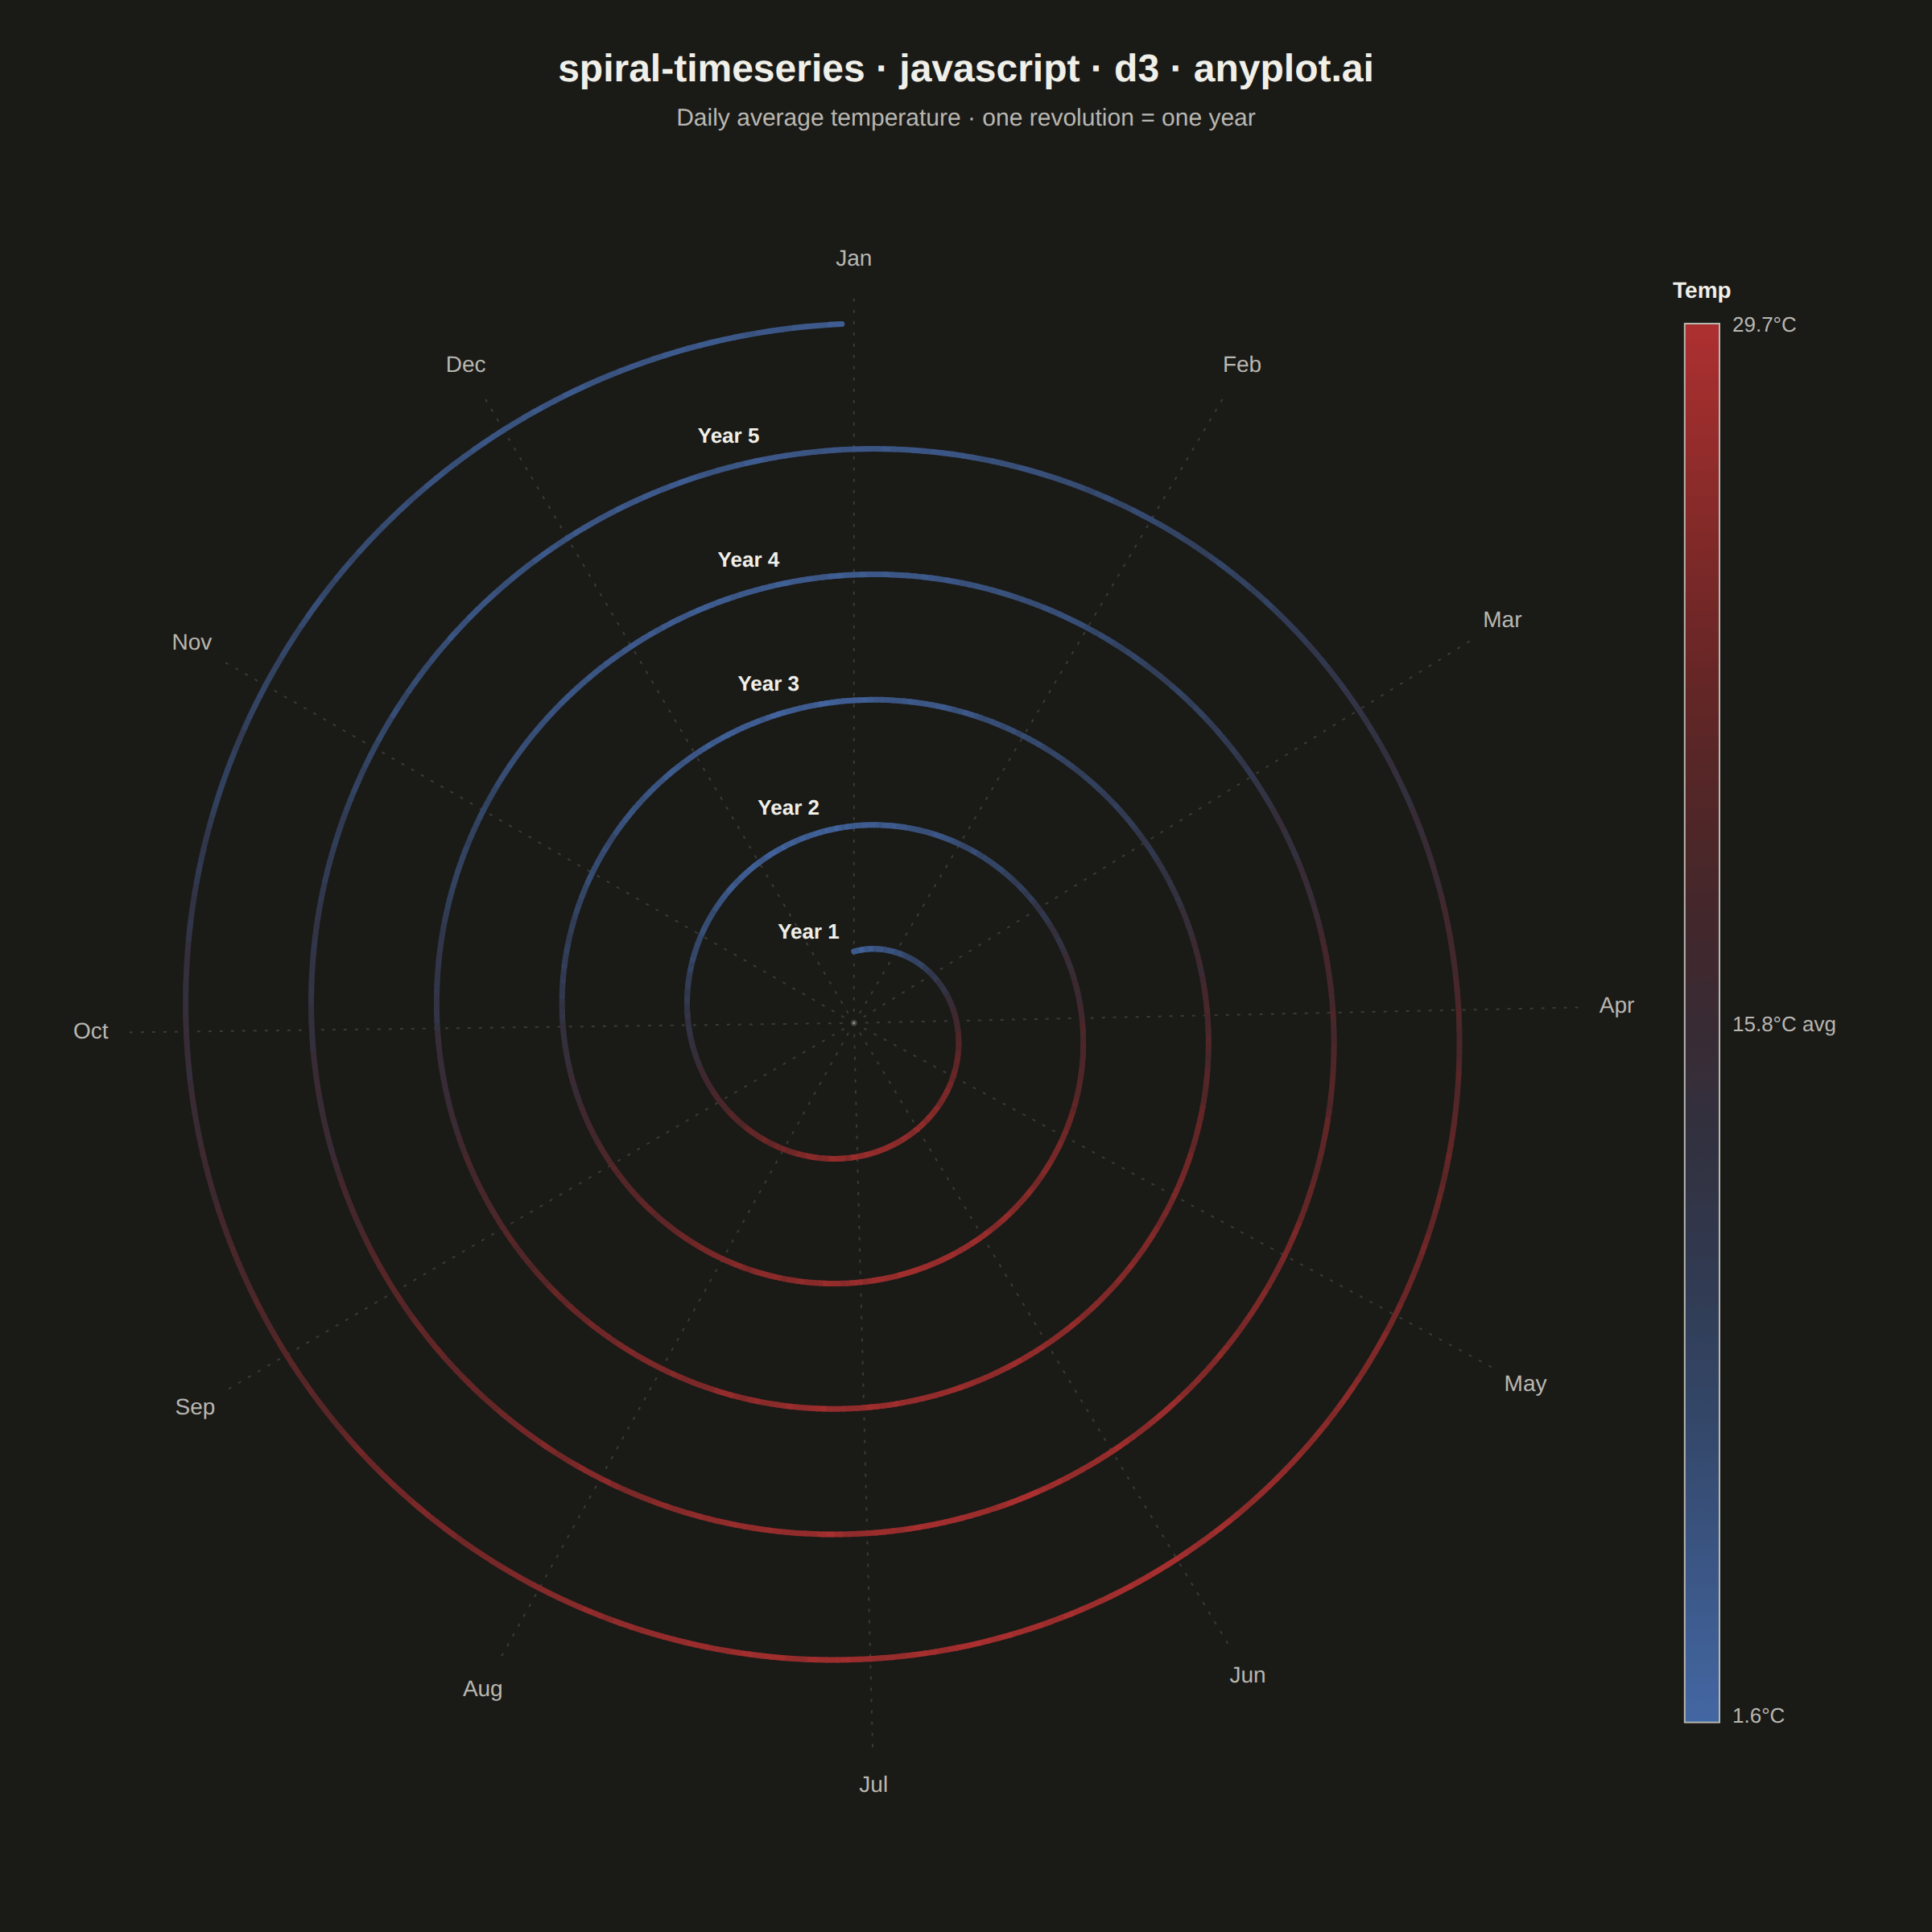
The same plot in 14 other libraries — JavaScript: Chart.js, Apache ECharts, Highcharts, MUI X Charts; Python: Altair, Bokeh, lets-plot, Matplotlib, Plotly, plotnine, Pygal, Seaborn; R: ggplot2; Julia: Makie.jl. Compare all 15 side by side: Spiral Time Series Chart in Python, R, Julia and JavaScript.
A time series plotted along a spiral (Archimedean or logarithmic), where each full revolution represents one cycle period (e.g., one year). By wrapping temporal data around a spiral, corresponding periods from different cycles align vertically, making recurring seasonal or periodic patterns immediately visible. This layout provides a compact alternative to long horizontal time series for cyclic data, revealing periodicity and trend simultaneously.
// anyplot.ai
// spiral-timeseries: Spiral Time Series Chart
// Library: d3 7.9.0 | JavaScript 22.23.2
// Quality: 90/100 | Created: 2026-09-09

//# anyplot-orientation: square
const t = window.ANYPLOT_TOKENS;
const { width, height } = window.ANYPLOT_SIZE;

// --- Data (in-memory, deterministic) ----------------------------------------
// Daily average temperature over 5 years — one spiral revolution per year, so
// seasons align vertically across turns.
const YEARS = 5;
const DAYS_PER_YEAR = 365;
const N = YEARS * DAYS_PER_YEAR;

let seed = 42;
const rand = () => {
  seed = (seed * 1103515245 + 12345) & 0x7fffffff;
  return seed / 0x7fffffff;
};

const MONTH_LENGTHS = [31, 28, 31, 30, 31, 30, 31, 31, 30, 31, 30, 31];
const MONTH_NAMES = ["Jan", "Feb", "Mar", "Apr", "May", "Jun", "Jul", "Aug", "Sep", "Oct", "Nov", "Dec"];
const monthStartDay = [];
let cumDays = 0;
for (const len of MONTH_LENGTHS) {
  monthStartDay.push(cumDays);
  cumDays += len;
}

const series = [];
for (let i = 0; i < N; i++) {
  const year = Math.floor(i / DAYS_PER_YEAR);
  const dayOfYear = i % DAYS_PER_YEAR;
  const seasonal = 15 + 12 * Math.sin((2 * Math.PI * (dayOfYear - 80)) / DAYS_PER_YEAR);
  const warmingTrend = year * 0.4;
  const dailyNoise = (rand() - 0.5) * 3;
  series.push({ year, dayOfYear, value: seasonal + warmingTrend + dailyNoise });
}

// --- Spiral geometry ---------------------------------------------------------
const margin = { top: height * 0.092, right: width * 0.158, bottom: height * 0.033, left: width * 0.042 };
const plotL = margin.left, plotR = width - margin.right;
const plotT = margin.top, plotB = height - margin.bottom;
const cx = (plotL + plotR) / 2;
const cy = (plotT + plotB) / 2;
const maxR = Math.min(plotR - plotL, plotB - plotT) / 2 - width * 0.038;
const r0 = width * 0.037;

const totalAngle = YEARS * 2 * Math.PI;
const k = (maxR - r0) / totalAngle;

const points = series.map((d) => {
  const theta = d.year * 2 * Math.PI + (d.dayOfYear / DAYS_PER_YEAR) * 2 * Math.PI;
  const r = r0 + k * theta;
  const a = theta - Math.PI / 2; // Jan 1 at the top, clockwise like a calendar
  return { x: cx + r * Math.cos(a), y: cy + r * Math.sin(a), r, value: d.value };
});

// --- Color scale: diverging around the 5-year mean, hot -> red, cold -> blue -
const values = series.map((d) => d.value);
const minV = d3.min(values);
const maxV = d3.max(values);
const meanV = d3.mean(values);
const colorScale = d3
  .scaleDiverging(d3.interpolateRgbBasis([t.div[2], t.div[1], t.div[0]]))
  .domain([minV, meanV, maxV]);

// --- SVG mount ----------------------------------------------------------------
const svg = d3.select("#container").append("svg").attr("width", width).attr("height", height);
const g = svg.append("g");

// --- Radial grid: month boundaries (same angle every revolution) -------------
g.selectAll("line.month-spoke")
  .data(monthStartDay)
  .join("line")
  .attr("class", "month-spoke")
  .attr("x1", cx)
  .attr("y1", cy)
  .attr("x2", (d) => cx + (maxR + width * 0.015) * Math.cos((d / DAYS_PER_YEAR) * 2 * Math.PI - Math.PI / 2))
  .attr("y2", (d) => cy + (maxR + width * 0.015) * Math.sin((d / DAYS_PER_YEAR) * 2 * Math.PI - Math.PI / 2))
  .attr("stroke", t.grid)
  .attr("stroke-width", 1)
  .attr("stroke-dasharray", "2,5");

g.selectAll("text.month-label")
  .data(MONTH_NAMES)
  .join("text")
  .attr("class", "month-label")
  .attr("x", (_, i) => cx + (maxR + width * 0.033) * Math.cos((monthStartDay[i] / DAYS_PER_YEAR) * 2 * Math.PI - Math.PI / 2))
  .attr("y", (_, i) => cy + (maxR + width * 0.033) * Math.sin((monthStartDay[i] / DAYS_PER_YEAR) * 2 * Math.PI - Math.PI / 2))
  .attr("text-anchor", "middle")
  .attr("dominant-baseline", "middle")
  .attr("fill", t.inkSoft)
  .style("font-size", "14px")
  .text((d) => d);

// --- Spiral line, colored by temperature along its length --------------------
g.selectAll("line.segment")
  .data(d3.pairs(points))
  .join("line")
  .attr("class", "segment")
  .attr("x1", (d) => d[0].x)
  .attr("y1", (d) => d[0].y)
  .attr("x2", (d) => d[1].x)
  .attr("y2", (d) => d[1].y)
  .attr("stroke", (d) => colorScale((d[0].value + d[1].value) / 2))
  .attr("stroke-width", 3.5)
  .attr("stroke-linecap", "round");

// --- Cycle-start labels: identify which turn is which year -------------------
for (let year = 0; year < YEARS; year++) {
  const r = r0 + k * (year * 2 * Math.PI);
  const angle = -Math.PI / 2 - 0.16;
  g.append("text")
    .attr("x", cx + (r + width * 0.01) * Math.cos(angle))
    .attr("y", cy + (r + width * 0.01) * Math.sin(angle))
    .attr("text-anchor", "end")
    .attr("dominant-baseline", "middle")
    .attr("fill", t.ink)
    .style("font-size", "13px")
    .style("font-weight", "600")
    .text(`Year ${year + 1}`);
}

// --- Color legend (vertical gradient bar) -------------------------------------
const legendX = plotR + width * 0.03;
const legendTop = cy - maxR;
const legendBottom = cy + maxR;
const legendWidth = width * 0.018;

const gradient = svg
  .append("defs")
  .append("linearGradient")
  .attr("id", "tempGradient")
  .attr("x1", "0%")
  .attr("y1", "100%")
  .attr("x2", "0%")
  .attr("y2", "0%");

gradient
  .selectAll("stop")
  .data(d3.range(0, 1.0001, 0.1))
  .join("stop")
  .attr("offset", (d) => `${d * 100}%`)
  .attr("stop-color", (d) => colorScale(minV + d * (maxV - minV)));

svg
  .append("rect")
  .attr("x", legendX)
  .attr("y", legendTop)
  .attr("width", legendWidth)
  .attr("height", legendBottom - legendTop)
  .attr("fill", "url(#tempGradient)")
  .attr("stroke", t.inkSoft)
  .attr("stroke-width", 1);

svg
  .append("text")
  .attr("x", legendX + legendWidth / 2)
  .attr("y", legendTop - 16)
  .attr("text-anchor", "middle")
  .attr("fill", t.ink)
  .style("font-size", "14px")
  .style("font-weight", "600")
  .text("Temp");

svg
  .append("text")
  .attr("x", legendX + legendWidth + 8)
  .attr("y", legendTop + 5)
  .attr("fill", t.inkSoft)
  .style("font-size", "13px")
  .text(`${maxV.toFixed(1)}°C`);

svg
  .append("text")
  .attr("x", legendX + legendWidth + 8)
  .attr("y", (legendTop + legendBottom) / 2 + 5)
  .attr("fill", t.inkSoft)
  .style("font-size", "13px")
  .text(`${meanV.toFixed(1)}°C avg`);

svg
  .append("text")
  .attr("x", legendX + legendWidth + 8)
  .attr("y", legendBottom)
  .attr("fill", t.inkSoft)
  .style("font-size", "13px")
  .text(`${minV.toFixed(1)}°C`);

// --- Title ---------------------------------------------------------------------
svg
  .append("text")
  .attr("x", width / 2)
  .attr("y", height * 0.042)
  .attr("text-anchor", "middle")
  .attr("fill", t.ink)
  .style("font-size", "24px")
  .style("font-weight", "600")
  .text("spiral-timeseries · javascript · d3 · anyplot.ai");

svg
  .append("text")
  .attr("x", width / 2)
  .attr("y", height * 0.065)
  .attr("text-anchor", "middle")
  .attr("fill", t.inkSoft)
  .style("font-size", "15px")
  .text("Daily average temperature · one revolution = one year");
Runnable source as JSON, for any HTTP client: https://api.anyplot.ai/specs/spiral-timeseries/d3/code. Any spec id and library id listed in llms-full.txt fit the same URL shape; every URL below is complete and callable.
{
  "spec_id": "spiral-timeseries",
  "language": "javascript",
  "library": "d3",
  "page": "https://anyplot.ai/spiral-timeseries/javascript/d3",
  "hub": "https://anyplot.ai/spiral-timeseries",
  "code_json": "https://api.anyplot.ai/specs/spiral-timeseries/d3/code",
  "spec_json": "https://api.anyplot.ai/specs/spiral-timeseries",
  "render_light_png": "https://storage.googleapis.com/anyplot-images/plots/spiral-timeseries/javascript/d3/plot-light.png",
  "render_dark_png": "https://storage.googleapis.com/anyplot-images/plots/spiral-timeseries/javascript/d3/plot-dark.png",
  "interactive_light_html": "https://storage.googleapis.com/anyplot-images/plots/spiral-timeseries/javascript/d3/plot-light.html",
  "interactive_dark_html": "https://storage.googleapis.com/anyplot-images/plots/spiral-timeseries/javascript/d3/plot-dark.html",
  "quality_score": 90.0,
  "license": "MIT",
  "guide": "https://anyplot.ai/llms.txt"
}
Part of Spiral Time Series Chart on anyplot.ai.