The same plot in 14 other libraries — JavaScript: D3.js, Apache ECharts, Highcharts, MUI X Charts; Python: Altair, Bokeh, lets-plot, Matplotlib, Plotly, plotnine, Pygal, Seaborn; R: ggplot2; Julia: Makie.jl. Compare all 15 side by side: Spiral Time Series Chart in Python, R, Julia and JavaScript.
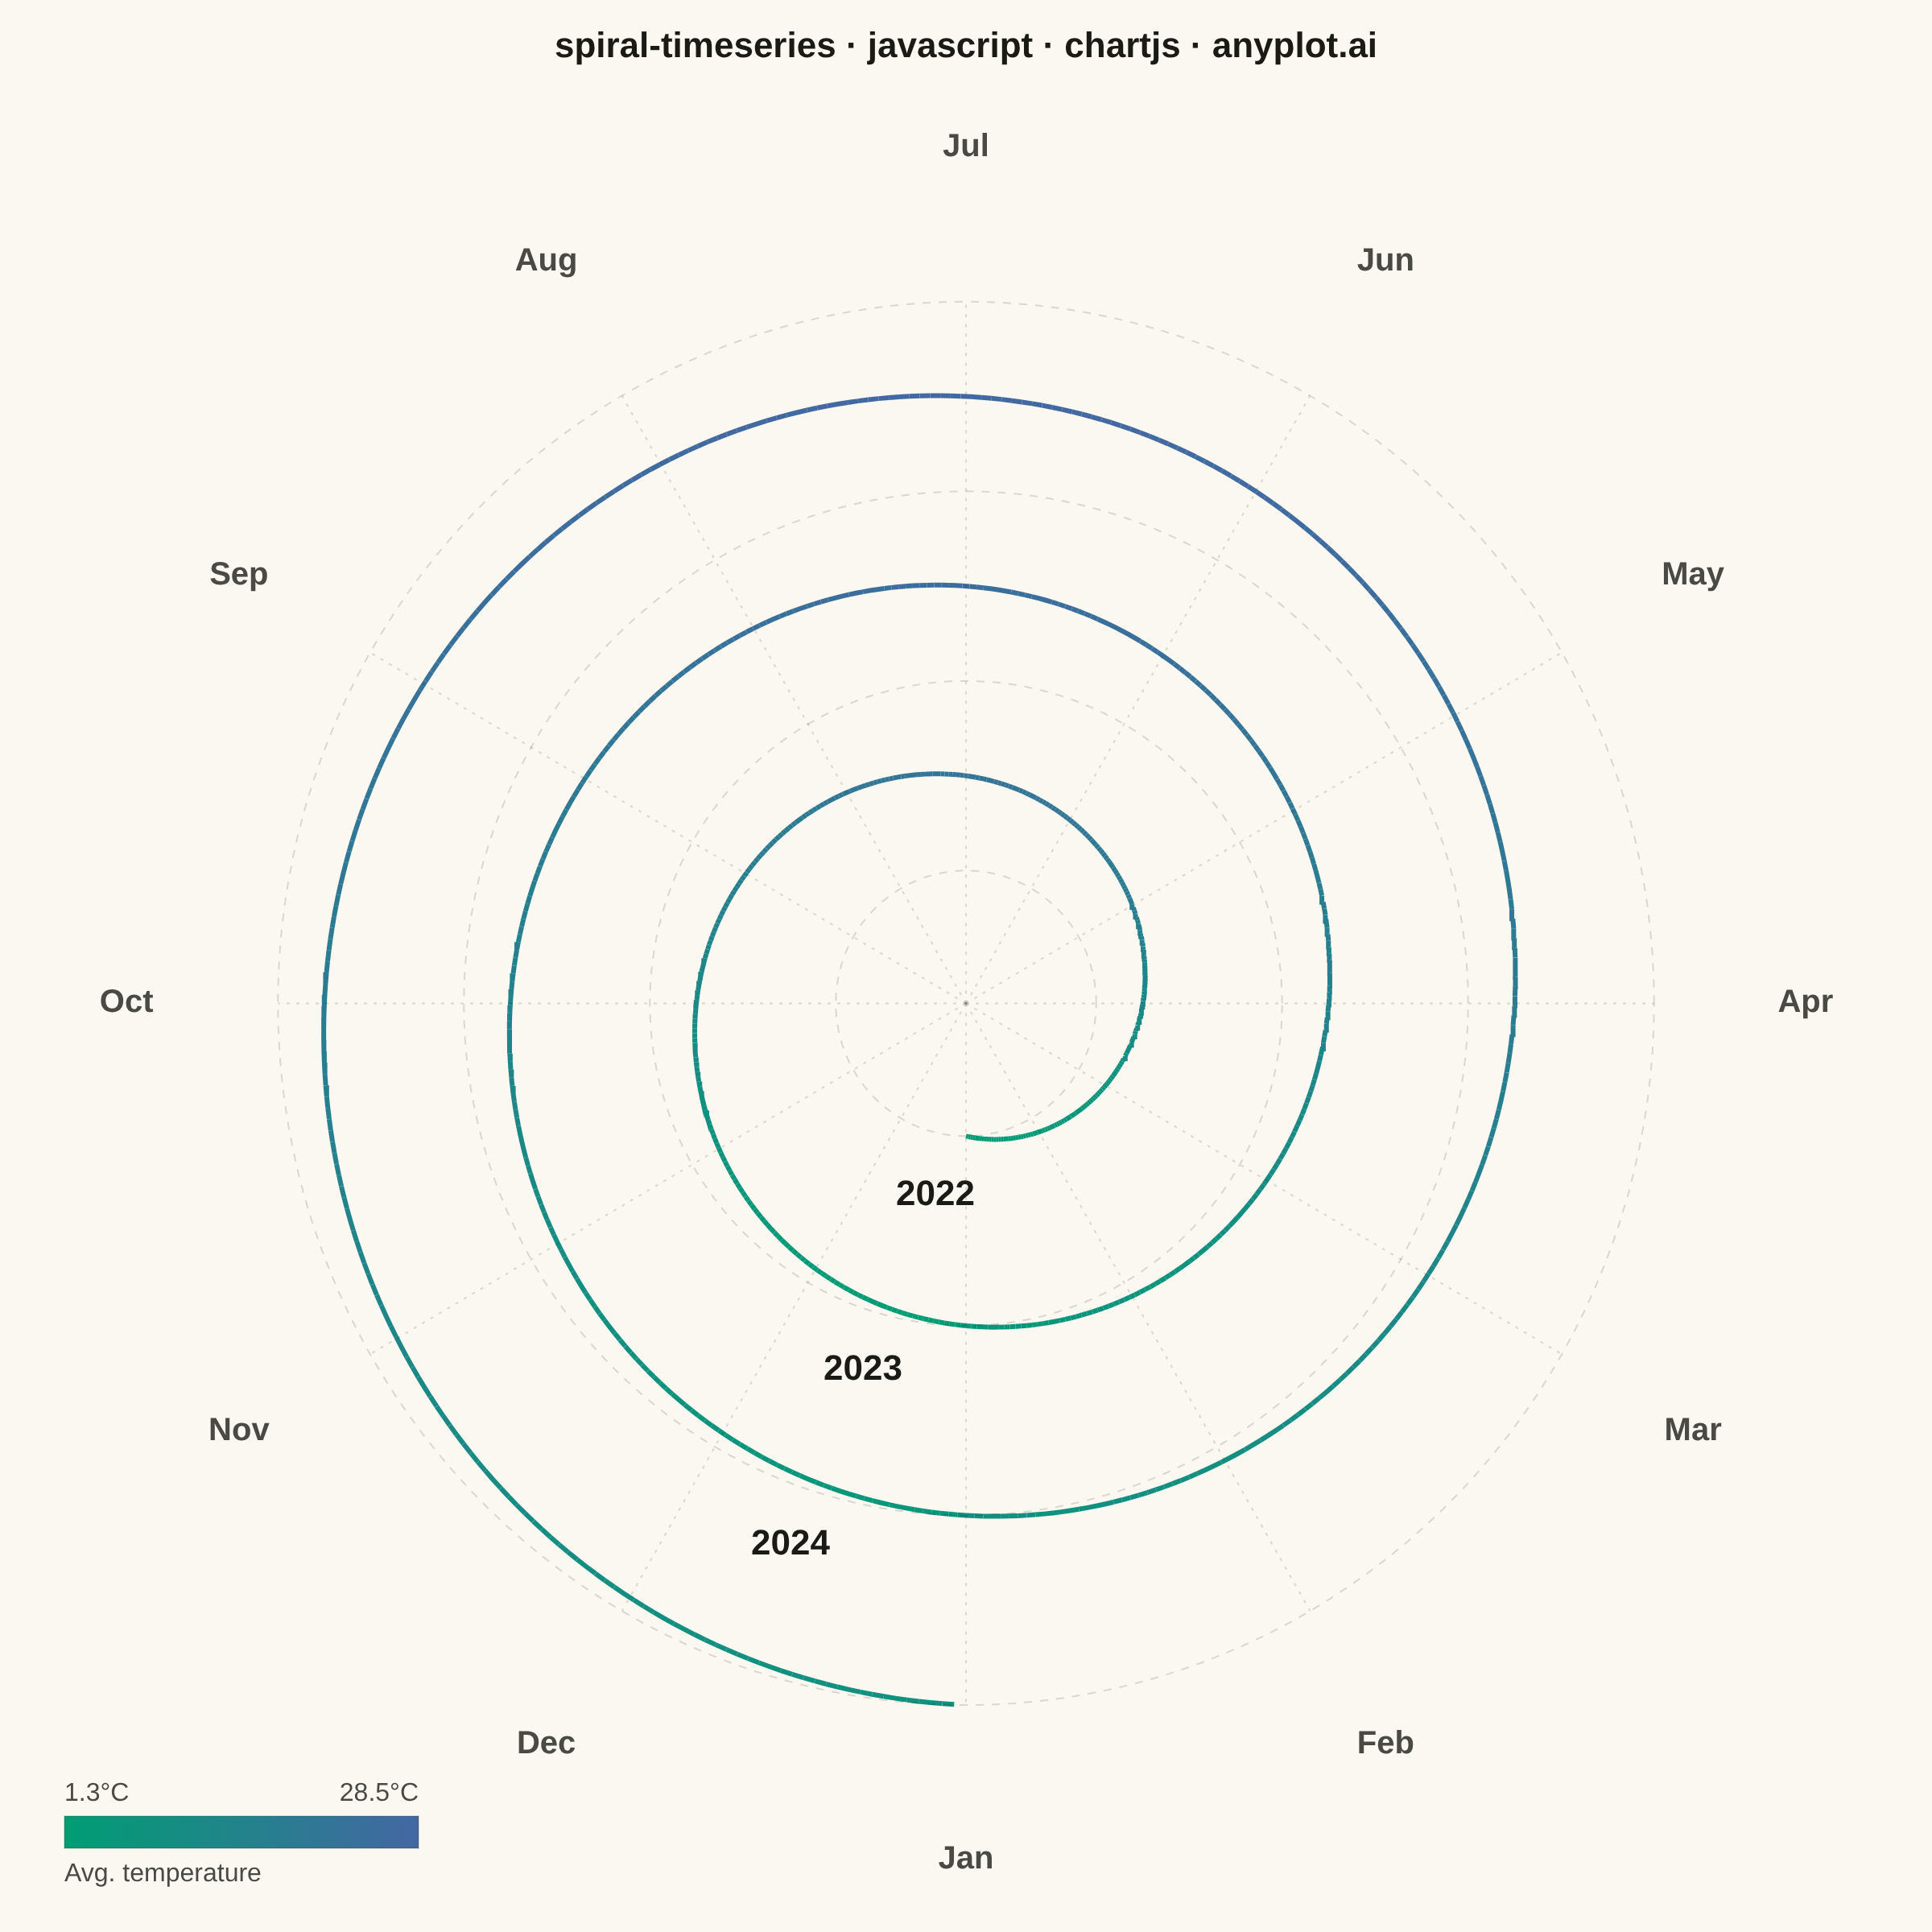
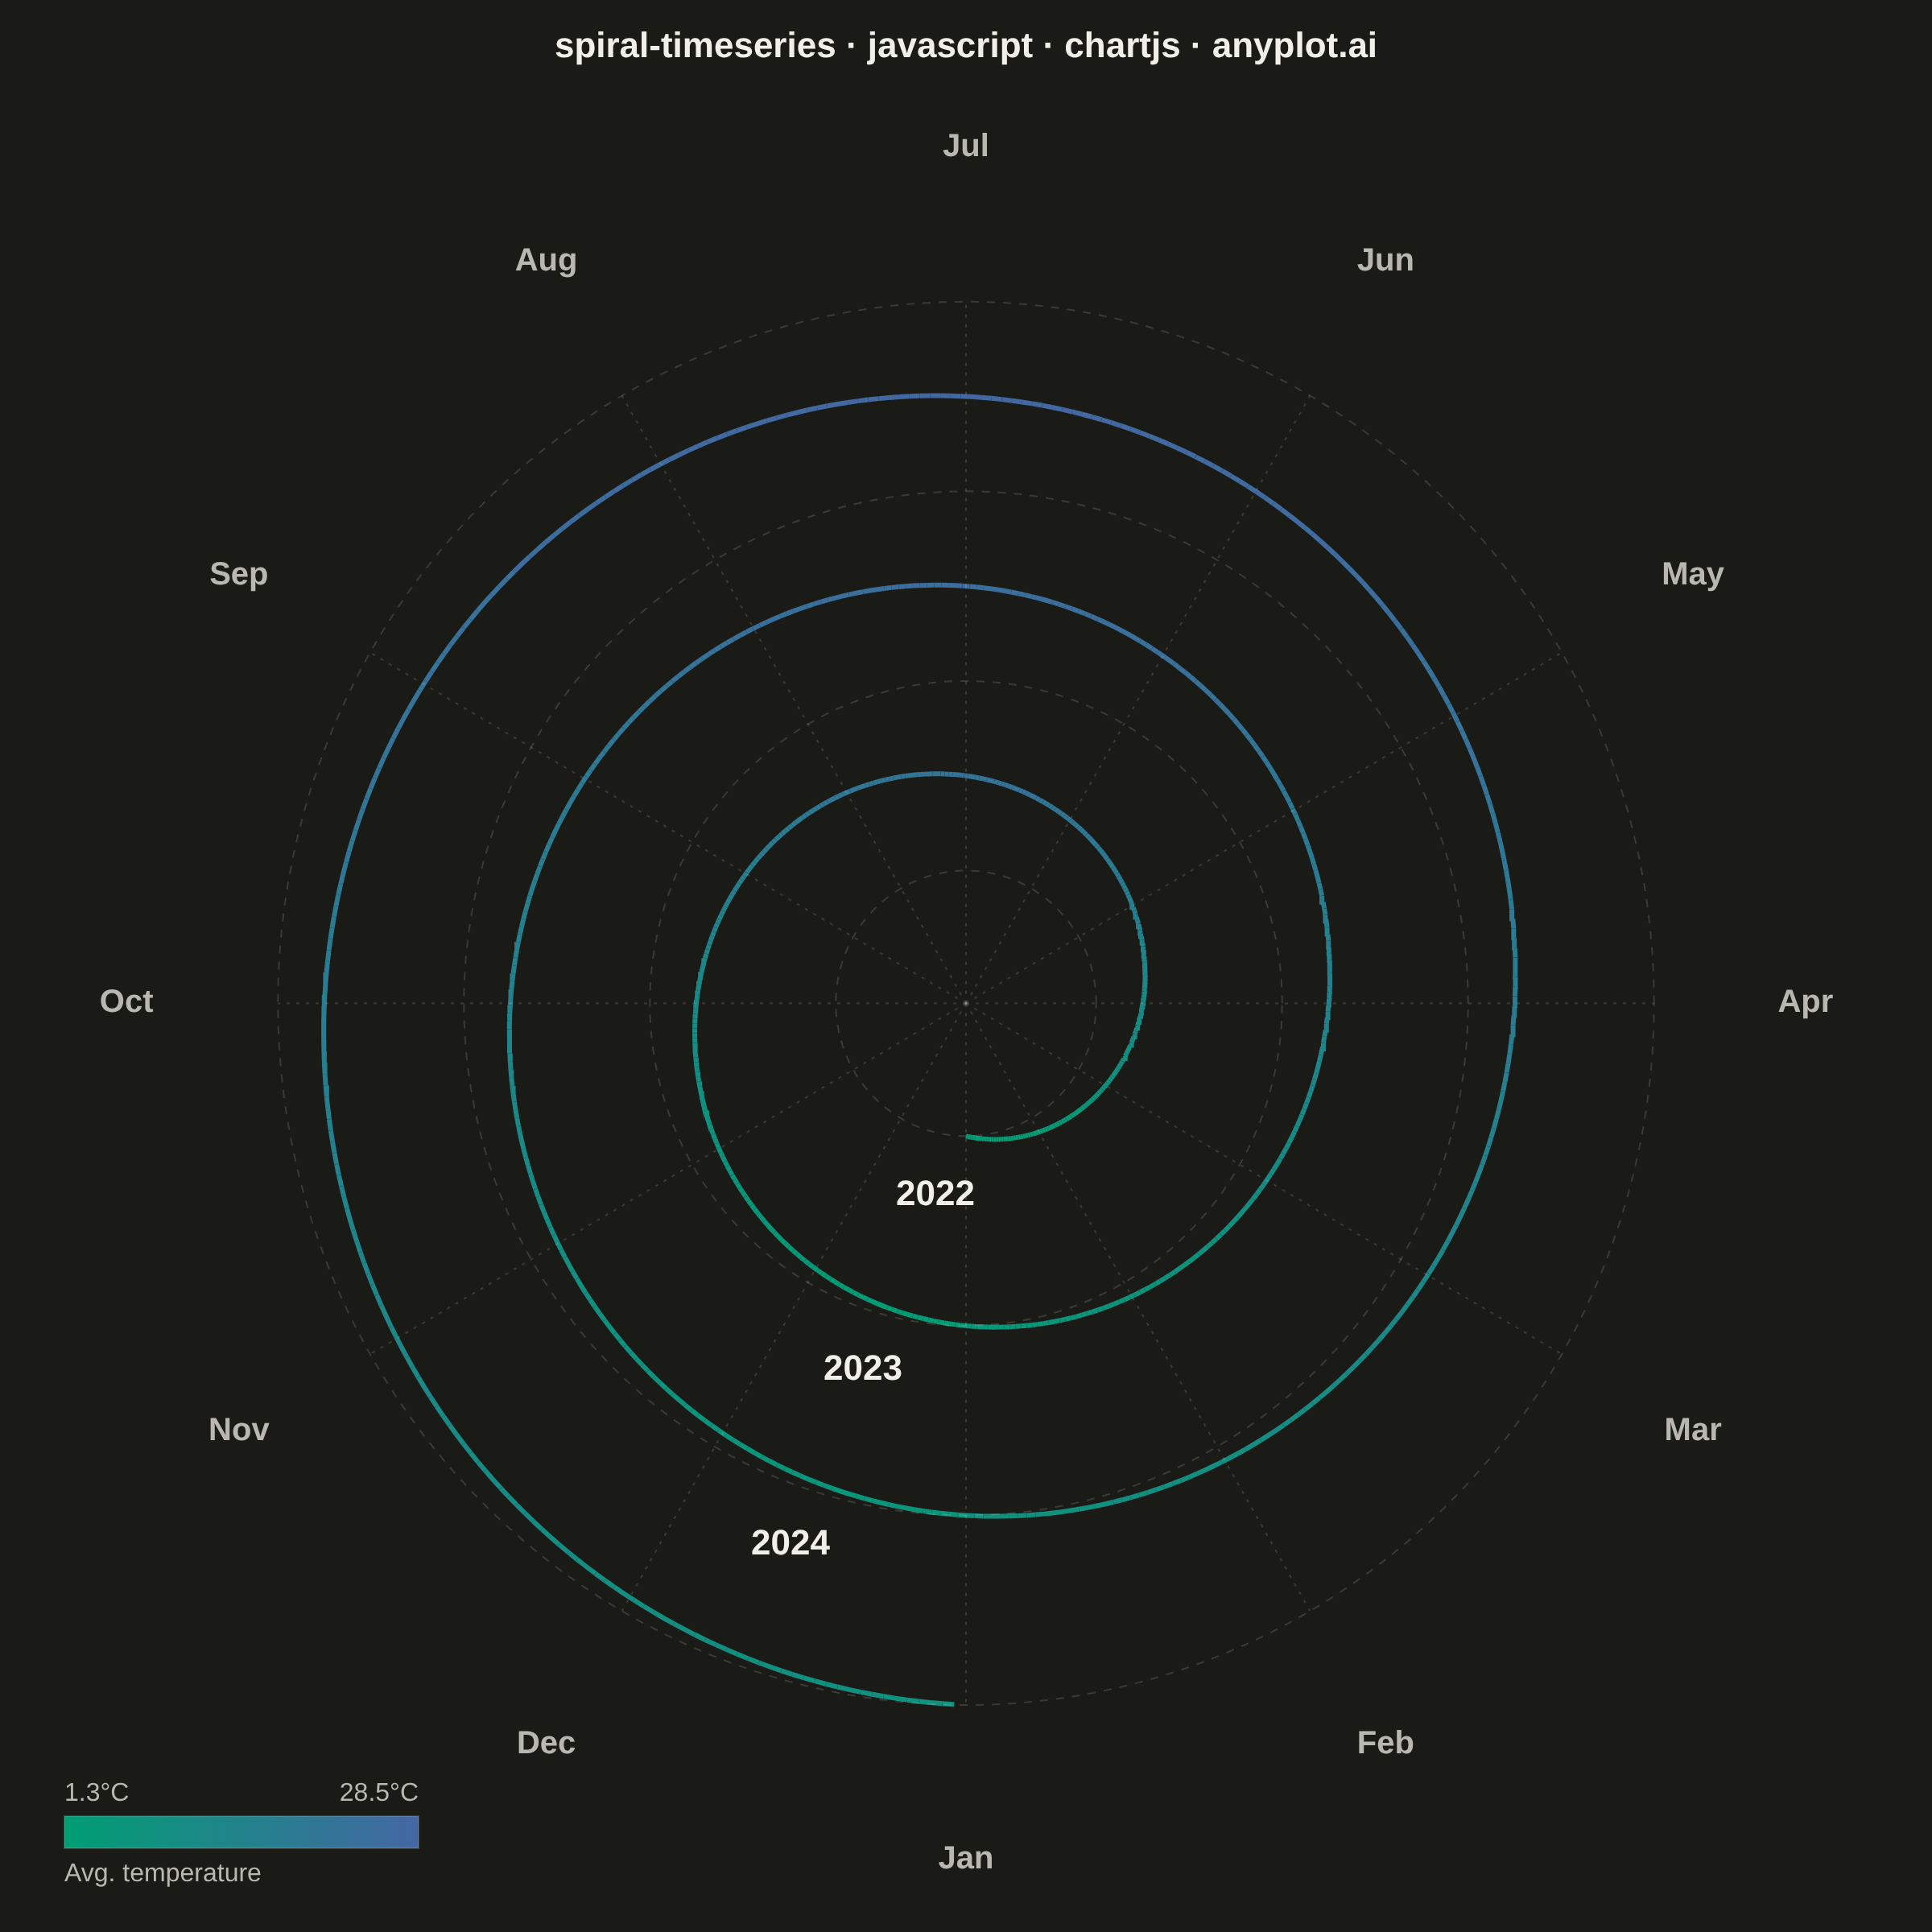
A time series plotted along a spiral (Archimedean or logarithmic), where each full revolution represents one cycle period (e.g., one year). By wrapping temporal data around a spiral, corresponding periods from different cycles align vertically, making recurring seasonal or periodic patterns immediately visible. This layout provides a compact alternative to long horizontal time series for cyclic data, revealing periodicity and trend simultaneously.
// anyplot.ai
// spiral-timeseries: Spiral Time Series Chart
// Library: chartjs 4.4.7 | JavaScript 22.23.2
// Quality: 90/100 | Created: 2026-09-09
//# anyplot-orientation: square

const t = window.ANYPLOT_TOKENS;
const size = window.ANYPLOT_SIZE;

// --- Data (in-memory, deterministic) ----------------------------------------
// Daily average temperature over 3 years — each revolution is one year, so the
// same calendar day from different years lines up along the same spoke.
const DAYS_PER_CYCLE = 365;
const NUM_CYCLES = 3;
const TOTAL_DAYS = DAYS_PER_CYCLE * NUM_CYCLES;
const START_YEAR = 2022;
const MONTH_NAMES = ["Jan", "Feb", "Mar", "Apr", "May", "Jun", "Jul", "Aug", "Sep", "Oct", "Nov", "Dec"];

// Tiny fixed-seed LCG — the browser has no seeded Math.random().
let lcgSeed = 20220101;
function lcgNoise() {
  lcgSeed = (lcgSeed * 1103515245 + 12345) & 0x7fffffff;
  return (lcgSeed / 0x7fffffff) * 2 - 1; // [-1, 1]
}

const temperatures = [];
for (let day = 0; day < TOTAL_DAYS; day++) {
  const dayOfYear = day % DAYS_PER_CYCLE;
  const yearIndex = Math.floor(day / DAYS_PER_CYCLE);
  const seasonal = 12 - 10 * Math.cos((2 * Math.PI * dayOfYear) / DAYS_PER_CYCLE);
  const warmingTrend = yearIndex * 3;
  temperatures.push(seasonal + warmingTrend + lcgNoise() * 0.8);
}
const minTemp = Math.min(...temperatures);
const maxTemp = Math.max(...temperatures);

function dateLabel(dayIndex) {
  const yearIndex = Math.floor(dayIndex / DAYS_PER_CYCLE);
  const dayOfYear = dayIndex % DAYS_PER_CYCLE;
  const monthIdx = Math.min(11, Math.floor(dayOfYear / 30.44));
  return `${MONTH_NAMES[monthIdx]} ${START_YEAR + yearIndex}`;
}

// --- Archimedean spiral geometry --------------------------------------------
// r = R0 + RING * theta/(2π), theta = 2π * day/DAYS_PER_CYCLE (continuously
// increasing across the whole series), rotated so day 1 sits at the top.
const R0 = 14;
const RING = 20;
const maxR = R0 + RING * NUM_CYCLES;

const spiralPoints = [];
for (let day = 0; day < TOTAL_DAYS; day++) {
  const cycleFrac = day / DAYS_PER_CYCLE;
  const theta = 2 * Math.PI * cycleFrac - Math.PI / 2;
  const r = R0 + RING * cycleFrac;
  spiralPoints.push({ x: r * Math.cos(theta), y: r * Math.sin(theta) });
}

function circlePoints(r) {
  const pts = [];
  const STEPS = 180;
  for (let s = 0; s <= STEPS; s++) {
    const a = (2 * Math.PI * s) / STEPS;
    pts.push({ x: r * Math.cos(a), y: r * Math.sin(a) });
  }
  return pts;
}

// Concentric rings mark each cycle boundary (one per year, plus the start).
const cycleRingDatasets = [];
for (let k = 0; k <= NUM_CYCLES; k++) {
  cycleRingDatasets.push({
    label: `cycle-boundary-${k}`,
    data: circlePoints(R0 + RING * k),
    borderColor: t.grid,
    borderWidth: 1,
    borderDash: [5, 5],
    pointRadius: 0,
    fill: false,
  });
}

// Month spokes subdivide each cycle radially.
const labelR = maxR * 1.22;
const monthSpokeDatasets = MONTH_NAMES.map((_, m) => {
  const angle = (2 * Math.PI * m) / 12 - Math.PI / 2;
  return {
    label: `month-spoke-${m}`,
    data: [
      { x: 0, y: 0 },
      { x: maxR * Math.cos(angle), y: maxR * Math.sin(angle) },
    ],
    borderColor: t.grid,
    borderWidth: 1,
    borderDash: [2, 4],
    pointRadius: 0,
    fill: false,
  };
});

// --- Color encodes value magnitude (Imprint sequential ramp) ---------------
function hexToRgb(hex) {
  const n = parseInt(hex.slice(1), 16);
  return [(n >> 16) & 255, (n >> 8) & 255, n & 255];
}
const [seqR0, seqG0, seqB0] = hexToRgb(t.seq[0]);
const [seqR1, seqG1, seqB1] = hexToRgb(t.seq[1]);
function valueColor(v) {
  const tt = Math.min(1, Math.max(0, (v - minTemp) / (maxTemp - minTemp)));
  const r = Math.round(seqR0 + (seqR1 - seqR0) * tt);
  const g = Math.round(seqG0 + (seqG1 - seqG0) * tt);
  const b = Math.round(seqB0 + (seqB1 - seqB0) * tt);
  return `rgb(${r}, ${g}, ${b})`;
}

const spiralDataset = {
  label: "Daily average temperature",
  data: spiralPoints,
  borderWidth: 3,
  pointRadius: 0,
  fill: false,
  tension: 0,
  segment: {
    borderColor: (ctx) => valueColor(temperatures[ctx.p1DataIndex]),
  },
};

// --- Mount -------------------------------------------------------------------
const canvas = document.createElement("canvas");
document.getElementById("container").appendChild(canvas);

// --- Axis extents (keep the spiral visually circular on the square canvas) --
// Cartesian x/y scales have no built-in "equal aspect" option; approximate it
// from the known CSS mount size minus the title bar the mandated title reserves.
const axisMax = labelR * 1.12;
const titleReservePx = 70;
const aspectComp = Math.max(0.75, (size.height - titleReservePx) / size.width);
const yAxisMax = axisMax * aspectComp;

// --- Custom plugin: month/year labels + color-bar legend --------------------
// Native Chart.js plugin API (inline object passed to `plugins:`), not a
// chartjs-chart-* community package — draws directly with the canvas 2D API.
const spiralAnnotationsPlugin = {
  id: "spiralAnnotations",
  afterDraw(chart) {
    const { ctx, scales } = chart;
    const xScale = scales.x;
    const yScale = scales.y;
    ctx.save();

    // Month labels around the outer ring.
    ctx.font = "600 20px sans-serif";
    ctx.fillStyle = t.inkSoft;
    ctx.textAlign = "center";
    ctx.textBaseline = "middle";
    MONTH_NAMES.forEach((name, m) => {
      const angle = (2 * Math.PI * m) / 12 - Math.PI / 2;
      const px = xScale.getPixelForValue(labelR * Math.cos(angle));
      const py = yScale.getPixelForValue(labelR * Math.sin(angle));
      ctx.fillText(name, px, py);
    });

    // Cycle-start (year) labels, nudged off the 12-o'clock spoke.
    ctx.font = "600 22px sans-serif";
    ctx.fillStyle = t.ink;
    ctx.textAlign = "left";
    ctx.textBaseline = "middle";
    for (let k = 0; k < NUM_CYCLES; k++) {
      const r = R0 + RING * k + RING * 0.4;
      const angle = -Math.PI / 2 - 0.4;
      const px = xScale.getPixelForValue(r * Math.cos(angle));
      const py = yScale.getPixelForValue(r * Math.sin(angle));
      ctx.fillText(String(START_YEAR + k), px + 6, py);
    }

    // Color-bar legend in the empty corner outside the circular spiral.
    const barX = chart.chartArea.left + 24;
    const barY = chart.chartArea.bottom - 56;
    const barW = 220;
    const barH = 20;
    const gradient = ctx.createLinearGradient(barX, 0, barX + barW, 0);
    gradient.addColorStop(0, t.seq[0]);
    gradient.addColorStop(1, t.seq[1]);
    ctx.fillStyle = gradient;
    ctx.fillRect(barX, barY, barW, barH);
    ctx.strokeStyle = t.grid;
    ctx.lineWidth = 1;
    ctx.strokeRect(barX, barY, barW, barH);

    ctx.font = "500 16px sans-serif";
    ctx.fillStyle = t.inkSoft;
    ctx.textBaseline = "bottom";
    ctx.textAlign = "left";
    ctx.fillText(`${minTemp.toFixed(1)}°C`, barX, barY - 6);
    ctx.textAlign = "right";
    ctx.fillText(`${maxTemp.toFixed(1)}°C`, barX + barW, barY - 6);
    ctx.textAlign = "left";
    ctx.textBaseline = "top";
    ctx.fillText("Avg. temperature", barX, barY + barH + 8);

    ctx.restore();
  },
};

// --- Chart -------------------------------------------------------------------
new Chart(canvas, {
  type: "line",
  data: {
    datasets: [...cycleRingDatasets, ...monthSpokeDatasets, spiralDataset],
  },
  options: {
    responsive: true,
    maintainAspectRatio: false,
    animation: false,
    layout: { padding: 16 },
    plugins: {
      title: {
        display: true,
        text: "spiral-timeseries · javascript · chartjs · anyplot.ai",
        color: t.ink,
        font: { size: 22, weight: "600" },
        padding: { bottom: 20 },
      },
      legend: { display: false },
      tooltip: {
        filter: (item) => item.dataset.label === "Daily average temperature",
        callbacks: {
          title: (items) => dateLabel(items[0].dataIndex),
          label: (item) => `${temperatures[item.dataIndex].toFixed(1)}°C`,
        },
      },
    },
    scales: {
      x: { type: "linear", display: false, min: -axisMax, max: axisMax },
      y: { type: "linear", display: false, min: -yAxisMax, max: yAxisMax },
    },
  },
  plugins: [spiralAnnotationsPlugin],
});
Runnable source as JSON, for any HTTP client: https://api.anyplot.ai/specs/spiral-timeseries/chartjs/code. Any spec id and library id listed in llms-full.txt fit the same URL shape; every URL below is complete and callable.
{
  "spec_id": "spiral-timeseries",
  "language": "javascript",
  "library": "chartjs",
  "page": "https://anyplot.ai/spiral-timeseries/javascript/chartjs",
  "hub": "https://anyplot.ai/spiral-timeseries",
  "code_json": "https://api.anyplot.ai/specs/spiral-timeseries/chartjs/code",
  "spec_json": "https://api.anyplot.ai/specs/spiral-timeseries",
  "render_light_png": "https://storage.googleapis.com/anyplot-images/plots/spiral-timeseries/javascript/chartjs/plot-light.png",
  "render_dark_png": "https://storage.googleapis.com/anyplot-images/plots/spiral-timeseries/javascript/chartjs/plot-dark.png",
  "interactive_light_html": "https://storage.googleapis.com/anyplot-images/plots/spiral-timeseries/javascript/chartjs/plot-light.html",
  "interactive_dark_html": "https://storage.googleapis.com/anyplot-images/plots/spiral-timeseries/javascript/chartjs/plot-dark.html",
  "quality_score": 90.0,
  "license": "MIT",
  "guide": "https://anyplot.ai/llms.txt"
}
Part of Spiral Time Series Chart on anyplot.ai.