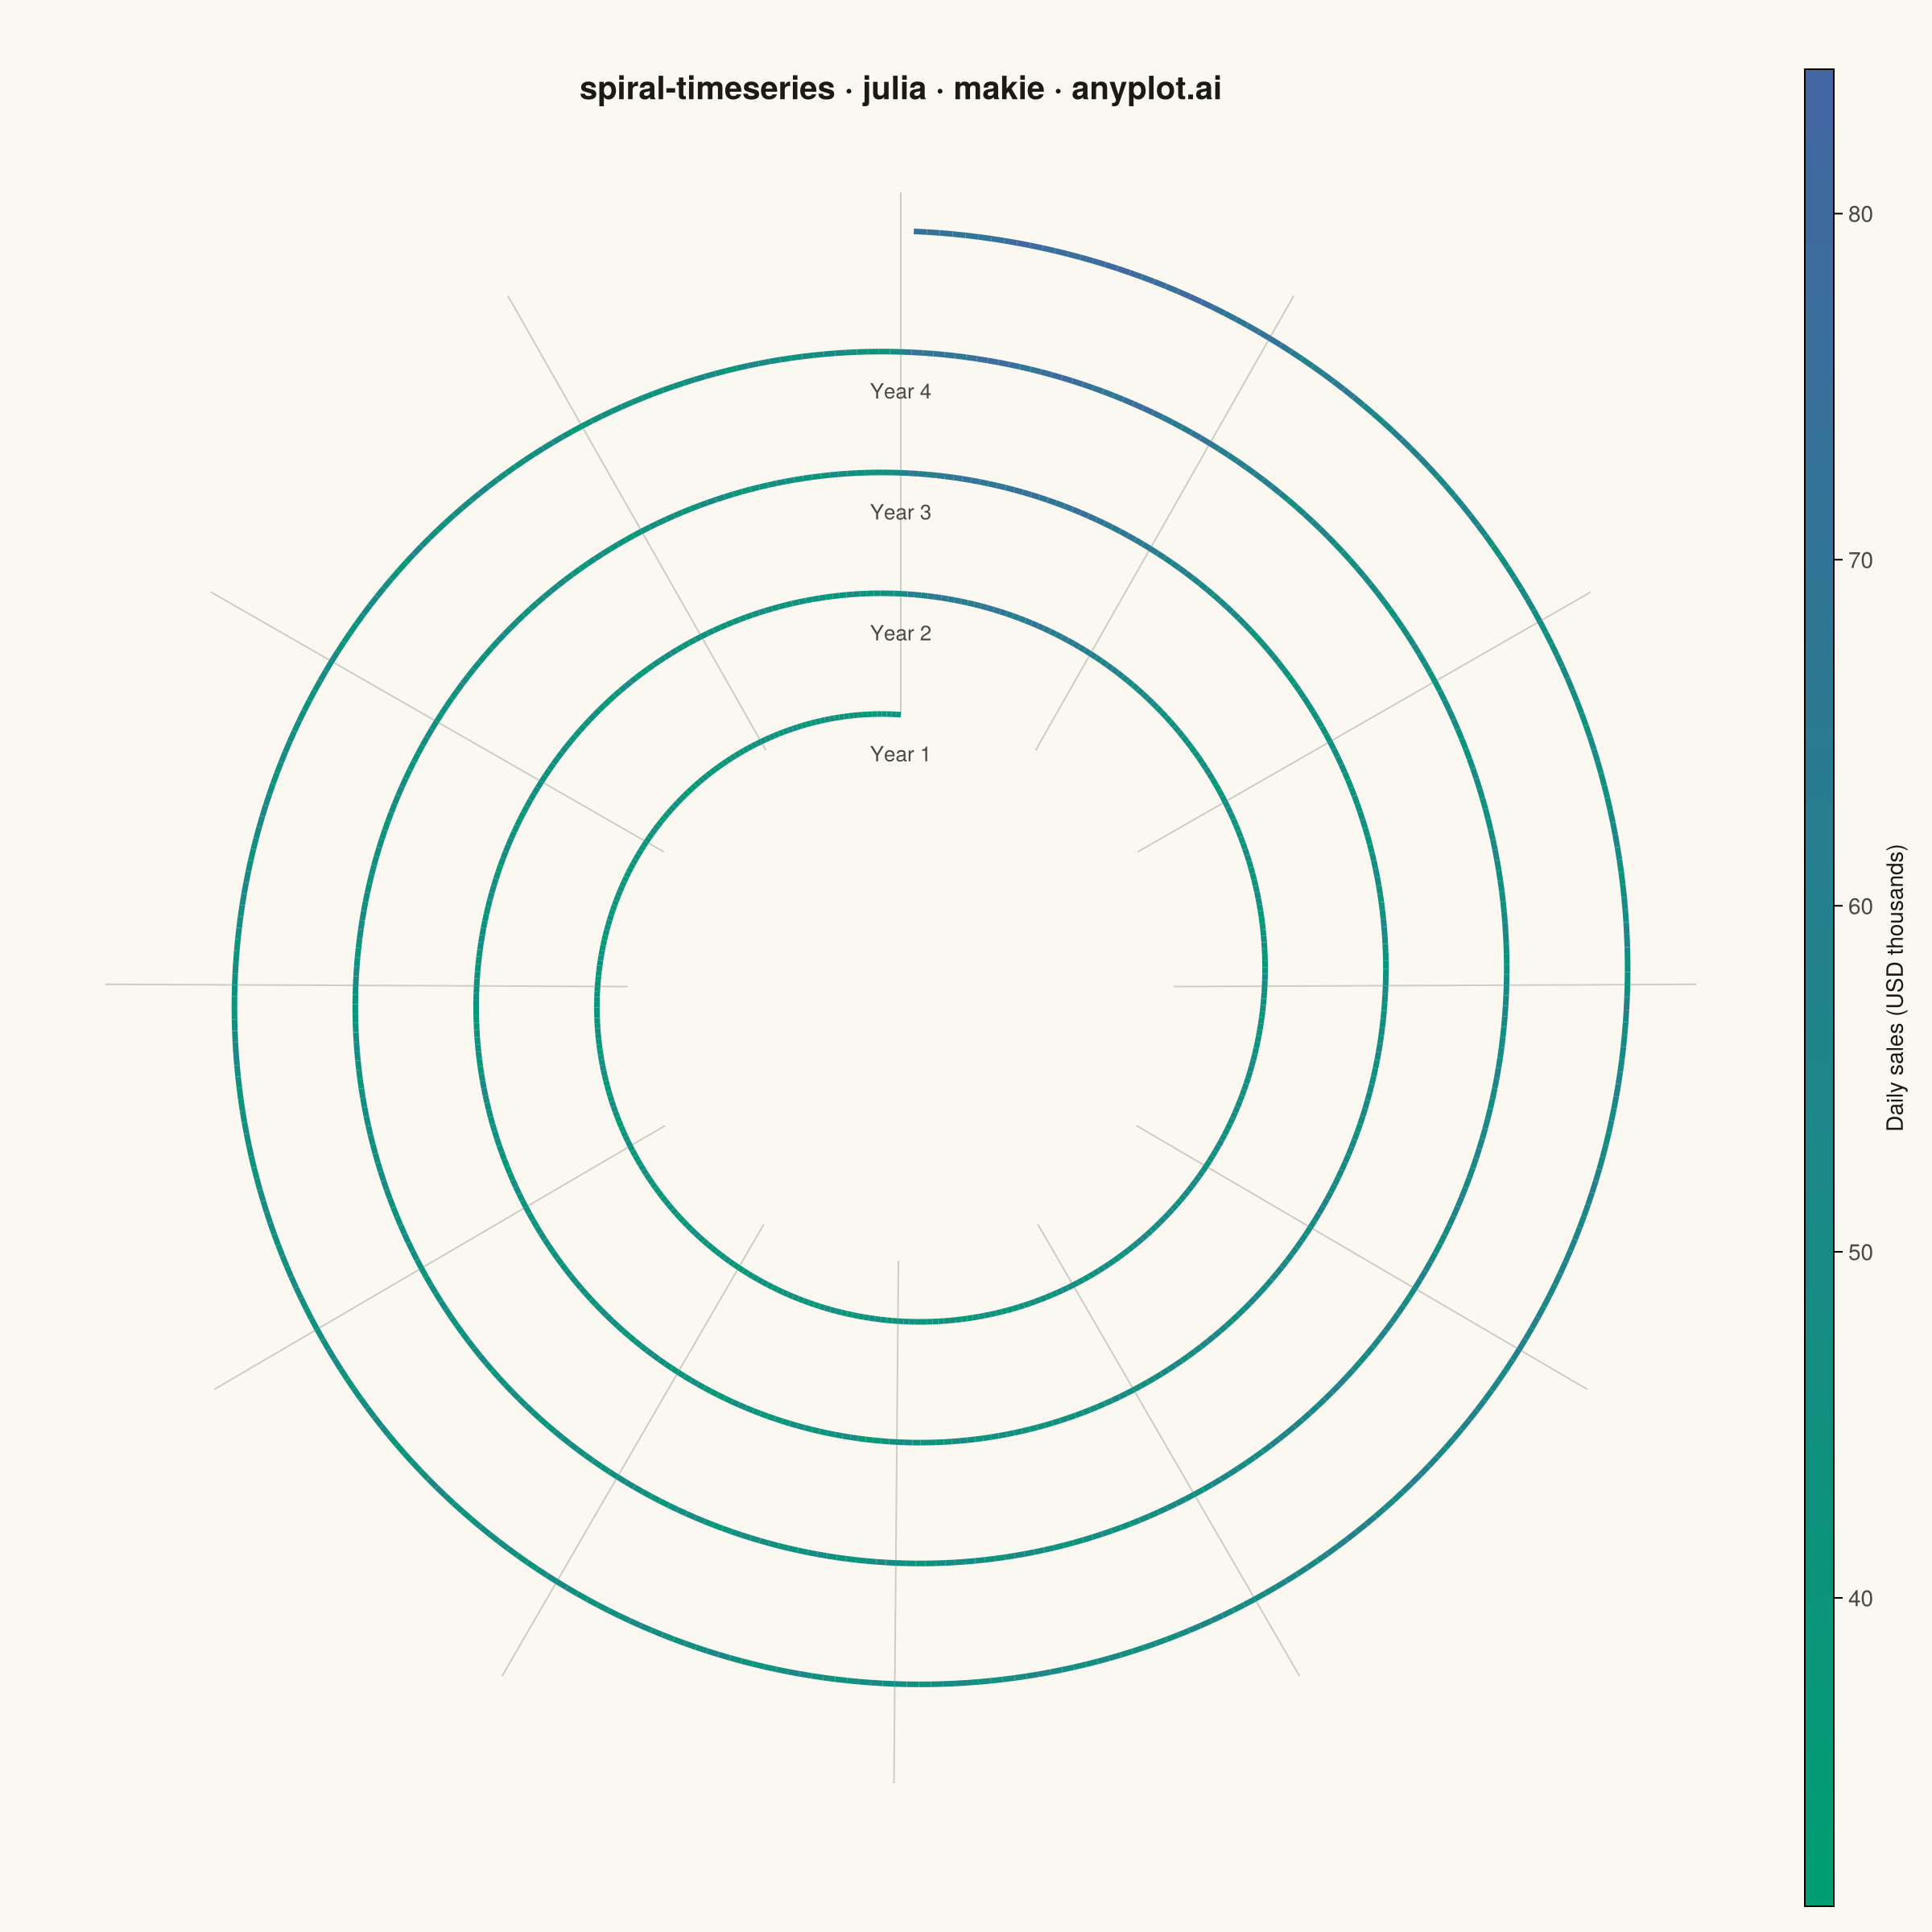
The same plot in 14 other libraries — Python: Altair, Bokeh, lets-plot, Matplotlib, Plotly, plotnine, Pygal, Seaborn; R: ggplot2; JavaScript: Chart.js, D3.js, Apache ECharts, Highcharts, MUI X Charts. Compare all 15 side by side: Spiral Time Series Chart in Python, R, Julia and JavaScript.
A time series plotted along a spiral (Archimedean or logarithmic), where each full revolution represents one cycle period (e.g., one year). By wrapping temporal data around a spiral, corresponding periods from different cycles align vertically, making recurring seasonal or periodic patterns immediately visible. This layout provides a compact alternative to long horizontal time series for cyclic data, revealing periodicity and trend simultaneously.
# anyplot.ai
# spiral-timeseries: Spiral Time Series Chart
# Library: makie 0.21.9 | Julia 1.11.9
# Quality: 89/100 | Created: 2026-09-09

using CairoMakie
using Colors
using Random
using Statistics

Random.seed!(42)

# --- Theme tokens -----------------------------------------------------------
const THEME = get(ENV, "ANYPLOT_THEME", "light")
const PAGE_BG = THEME == "light" ? colorant"#FAF8F1" : colorant"#1A1A17"
const INK = THEME == "light" ? colorant"#1A1A17" : colorant"#F0EFE8"
const INK_SOFT = THEME == "light" ? colorant"#4A4A44" : colorant"#B8B7B0"
const IMPRINT_SEQ = cgrad([colorant"#009E73", colorant"#4467A3"])

# --- Data: daily retail sales over 4 years, one revolution per year --------
n_years = 4
days_per_year = 365
n_days = n_years * days_per_year

day_index = 0:(n_days-1)
day_of_year = mod.(day_index, days_per_year)

trend = 1.0 .+ 0.05 .* (day_index ./ days_per_year)
weekly_pattern = 0.10 .* sin.(2π .* day_index ./ 7)
holiday_peak = 0.65 .* exp.(-((day_of_year .- 350) .^ 2) ./ (2 * 16^2))
back_to_school = 0.20 .* exp.(-((day_of_year .- 240) .^ 2) ./ (2 * 20^2))
noise = 3.0 .* randn(n_days)

daily_sales = 40.0 .* trend .* (1.0 .+ holiday_peak .+ back_to_school .+ weekly_pattern) .+ noise
daily_sales = max.(daily_sales, 5.0)

# --- Spiral geometry (Archimedean: constant radial spacing per revolution) -
theta = 2π .* day_index ./ days_per_year        # continuously increasing angle
r_inner = 0.35
r_growth_per_cycle = 0.62 / n_years
radius = r_inner .+ r_growth_per_cycle .* (theta ./ 2π)

phi = theta .+ π / 2                            # rotate so each cycle starts at the top
x = radius .* cos.(phi)
y = radius .* sin.(phi)

# --- Figure -------------------------------------------------------------------
fig = Figure(resolution=(1200, 1200), fontsize=14, backgroundcolor=PAGE_BG)

ax = Axis(
    fig[1, 1];
    title="spiral-timeseries · julia · makie · anyplot.ai",
    titlesize=20,
    titlecolor=INK,
    backgroundcolor=PAGE_BG,
    aspect=DataAspect(),
)
hidedecorations!(ax)
hidespines!(ax)

# Radial grid lines mark month boundaries within each yearly cycle
r_outer = maximum(radius) + 0.05
month_days = round.(Int, range(0, days_per_year, length=13))[1:12]
for d in month_days
    ang = 2π * d / days_per_year + π / 2
    lines!(
        ax,
        [r_inner * cos(ang), r_outer * cos(ang)],
        [r_inner * sin(ang), r_outer * sin(ang)];
        color=(INK_SOFT, 0.25),
        linewidth=1,
    )
end

# Spiral line — color encodes daily sales magnitude. The range is clamped to
# the 5th-95th percentile (rather than full min/max) so day-to-day variation
# stays visible instead of being washed out by the single yearly holiday spike.
color_range = (quantile(daily_sales, 0.05), quantile(daily_sales, 0.95))
lines!(
    ax, x, y;
    color=daily_sales,
    colormap=IMPRINT_SEQ,
    colorrange=color_range,
    linewidth=3.5,
)

# Label the start of each yearly cycle for orientation
for cycle in 0:(n_years-1)
    label_radius = r_inner + r_growth_per_cycle * cycle - 0.05
    text!(
        ax,
        0.0,
        label_radius;
        text="Year $(cycle + 1)",
        color=INK_SOFT,
        fontsize=13,
        align=(:center, :center),
    )
end

Colorbar(
    fig[1, 2],
    limits=color_range,
    colormap=IMPRINT_SEQ,
    label="Daily sales (USD thousands)",
    labelcolor=INK,
    ticklabelcolor=INK_SOFT,
    width=18,
)

# --- Save -------------------------------------------------------------------
save("plot-$(THEME).png", fig; px_per_unit=2)
Runnable source as JSON, for any HTTP client: https://api.anyplot.ai/specs/spiral-timeseries/makie/code. Any spec id and library id listed in llms-full.txt fit the same URL shape; every URL below is complete and callable.
{
  "spec_id": "spiral-timeseries",
  "language": "julia",
  "library": "makie",
  "page": "https://anyplot.ai/spiral-timeseries/julia/makie",
  "hub": "https://anyplot.ai/spiral-timeseries",
  "code_json": "https://api.anyplot.ai/specs/spiral-timeseries/makie/code",
  "spec_json": "https://api.anyplot.ai/specs/spiral-timeseries",
  "render_light_png": "https://storage.googleapis.com/anyplot-images/plots/spiral-timeseries/julia/makie/plot-light.png",
  "render_dark_png": "https://storage.googleapis.com/anyplot-images/plots/spiral-timeseries/julia/makie/plot-dark.png",
  "quality_score": 89.0,
  "license": "MIT",
  "guide": "https://anyplot.ai/llms.txt"
}
Part of Spiral Time Series Chart on anyplot.ai.