The same plot in 14 other libraries — JavaScript: Chart.js, D3.js, Apache ECharts, MUI X Charts; Python: Altair, Bokeh, lets-plot, Matplotlib, Plotly, plotnine, Pygal, Seaborn; R: ggplot2; Julia: Makie.jl. Compare all 15 side by side: Spiral Time Series Chart in Python, R, Julia and JavaScript.
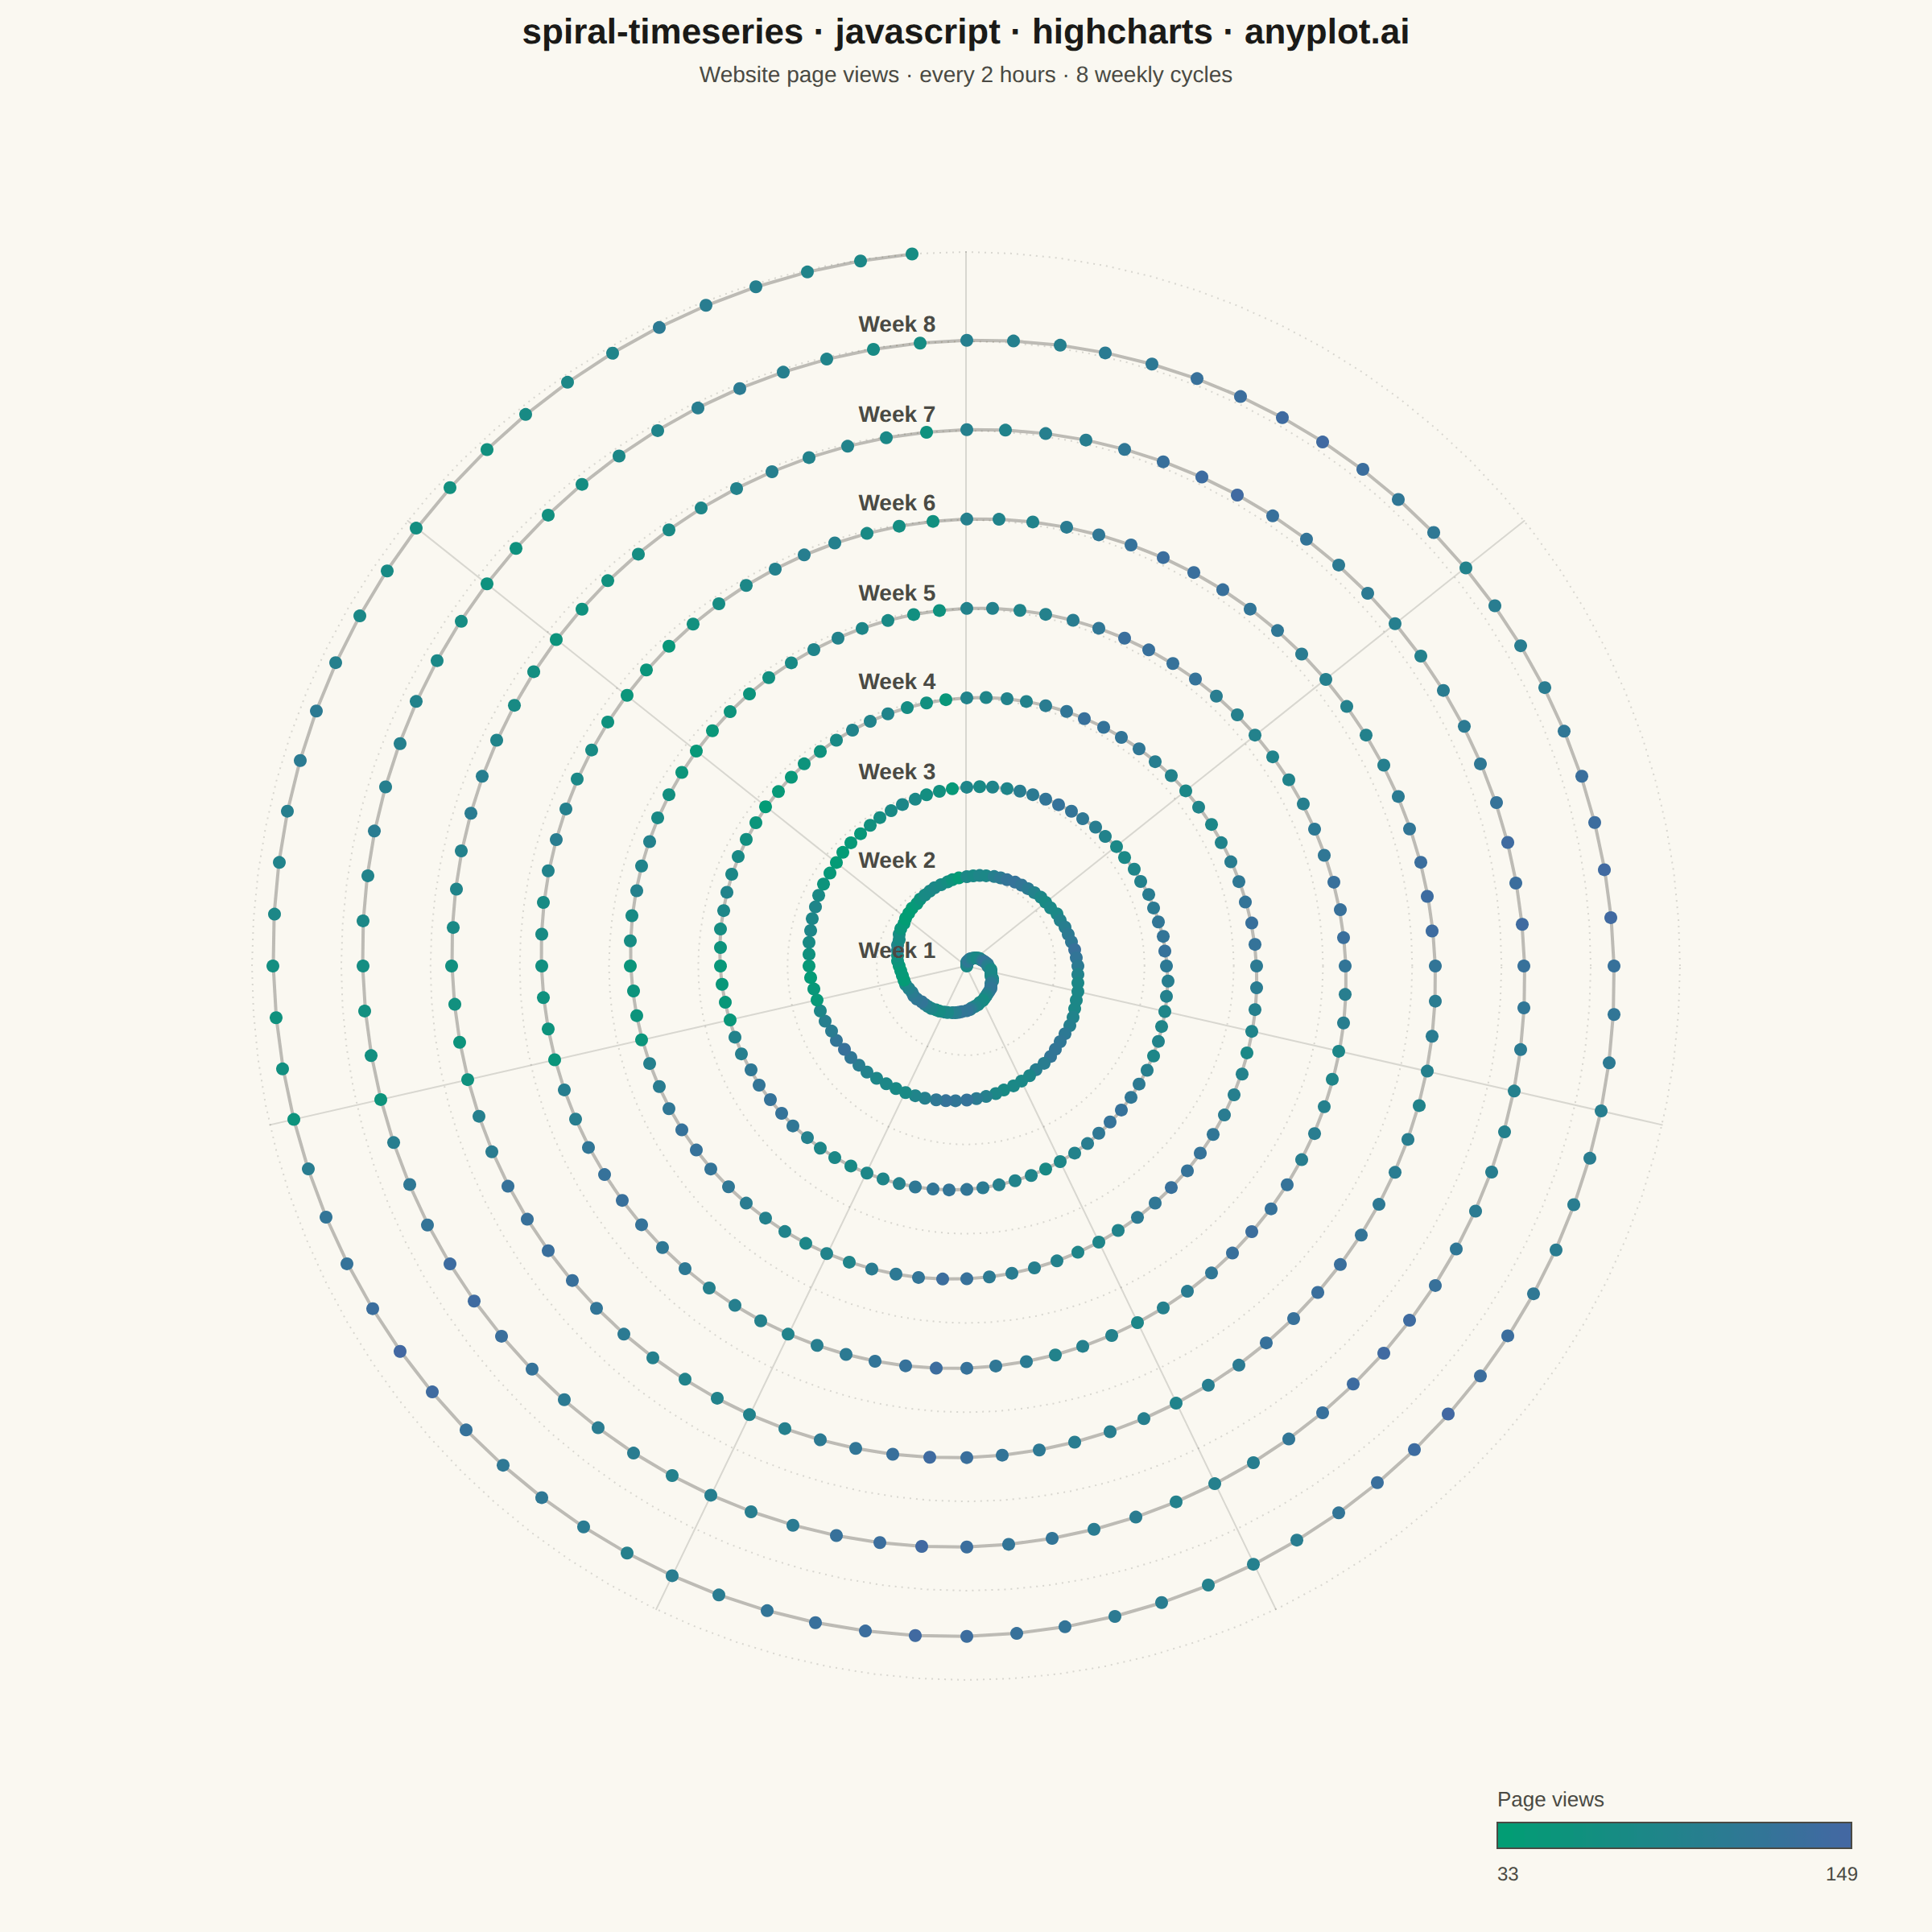
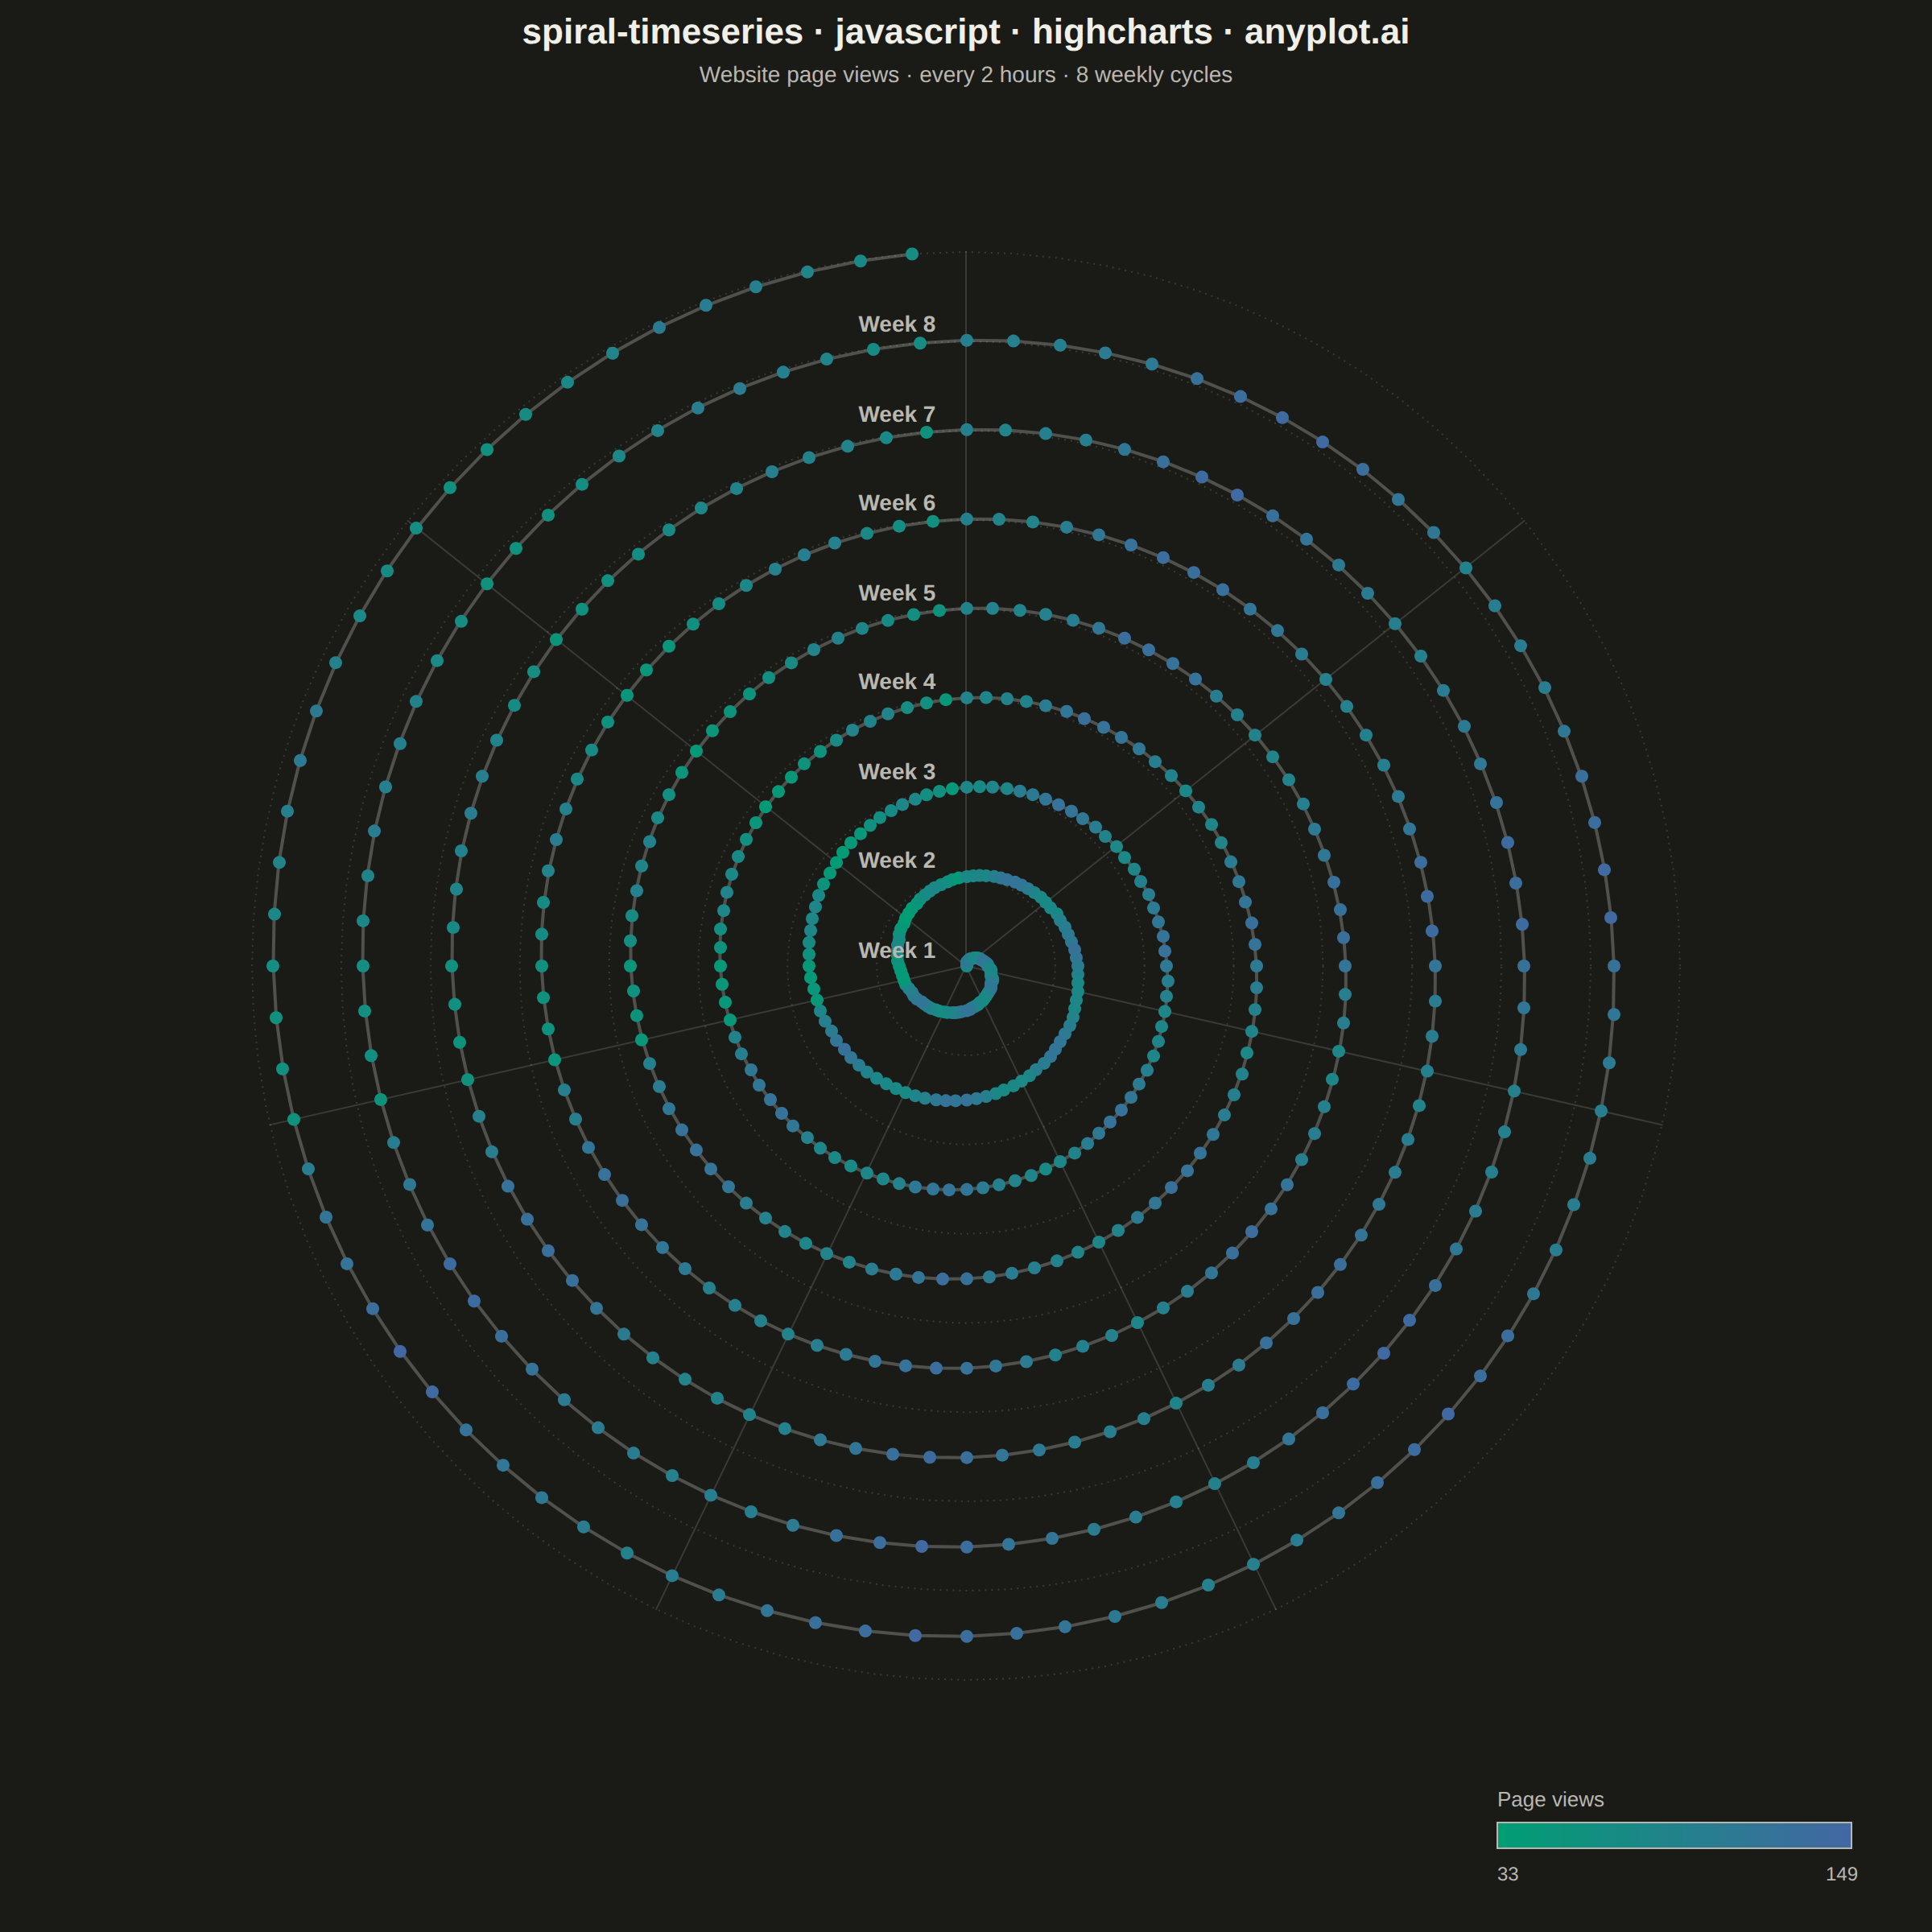
A time series plotted along a spiral (Archimedean or logarithmic), where each full revolution represents one cycle period (e.g., one year). By wrapping temporal data around a spiral, corresponding periods from different cycles align vertically, making recurring seasonal or periodic patterns immediately visible. This layout provides a compact alternative to long horizontal time series for cyclic data, revealing periodicity and trend simultaneously.
// anyplot.ai
// spiral-timeseries: Spiral Time Series Chart
// Library: highcharts 12.6.0 | JavaScript 22.23.2
// Quality: 91/100 | Created: 2026-09-09
//# anyplot-orientation: square

const t = window.ANYPLOT_TOKENS;

// --- Data (in-memory, deterministic LCG) ------------------------------------
// Website page views sampled every 2 hours over 8 weekly cycles. One full
// spiral revolution = one week, so weekday/weekend and time-of-day patterns
// line up radially across cycles.
let seed = 42;
function random() {
  seed = (seed * 1103515245 + 12345) & 0x7fffffff;
  return seed / 0x7fffffff;
}

const POINTS_PER_DAY = 12; // every 2 hours
const DAYS_PER_CYCLE = 7; // one revolution = one week
const NUM_CYCLES = 8;
const POINTS_PER_CYCLE = POINTS_PER_DAY * DAYS_PER_CYCLE;
const TOTAL_POINTS = POINTS_PER_CYCLE * NUM_CYCLES;
const DAY_NAMES = ["Mon", "Tue", "Wed", "Thu", "Fri", "Sat", "Sun"];

const pageViews = [];
for (let i = 0; i < TOTAL_POINTS; i++) {
  const hourOfDay = (i % POINTS_PER_DAY) * (24 / POINTS_PER_DAY);
  const dayOfWeek = Math.floor(i / POINTS_PER_DAY) % DAYS_PER_CYCLE;
  const weekIndex = Math.floor(i / POINTS_PER_CYCLE);

  const dailyPattern = 45 * Math.exp(-((hourOfDay - 14) ** 2) / 40); // midday/afternoon peak
  const weekendDip = dayOfWeek >= 5 ? -22 : 14; // lower traffic on Sat/Sun
  const growthTrend = weekIndex * 3.5; // gradual week-over-week growth
  const noise = (random() - 0.5) * 12;

  pageViews.push(Math.max(5, 60 + dailyPattern + weekendDip + growthTrend + noise));
}

const minValue = Math.min(...pageViews);
const maxValue = Math.max(...pageViews);

// --- Spiral geometry (Archimedean: radius grows linearly with angle) -------
// Earliest data sits at the center; each full revolution advances one week.
const RADIUS_MAX = 10;
const AXIS_EXTENT = 11.5;

function hexToRgb(hex) {
  const n = parseInt(hex.slice(1), 16);
  return [(n >> 16) & 255, (n >> 8) & 255, n & 255];
}
function mixColor(hexA, hexB, ratio) {
  const [r1, g1, b1] = hexToRgb(hexA);
  const [r2, g2, b2] = hexToRgb(hexB);
  const r = Math.round(r1 + (r2 - r1) * ratio);
  const g = Math.round(g1 + (g2 - g1) * ratio);
  const b = Math.round(b1 + (b2 - b1) * ratio);
  return `rgb(${r},${g},${b})`;
}

const spiralPoints = [];
const structurePath = [];
for (let i = 0; i < TOTAL_POINTS; i++) {
  const theta = (2 * Math.PI * i) / POINTS_PER_CYCLE;
  const radius = (RADIUS_MAX * i) / (TOTAL_POINTS - 1);
  const screenAngle = Math.PI / 2 - theta; // start at 12 o'clock, sweep clockwise
  const x = radius * Math.cos(screenAngle);
  const y = radius * Math.sin(screenAngle);
  const value = pageViews[i];
  const dayOfWeek = Math.floor(i / POINTS_PER_DAY) % DAYS_PER_CYCLE;
  const weekIndex = Math.floor(i / POINTS_PER_CYCLE);
  const hourOfDay = (i % POINTS_PER_DAY) * (24 / POINTS_PER_DAY);

  const point = {
    x,
    y,
    value,
    dayOfWeek,
    weekIndex,
    hourOfDay,
    marker: { fillColor: mixColor(t.seq[0], t.seq[1], (value - minValue) / (maxValue - minValue)) },
  };
  // Label the start of each cycle (top spoke, where every week begins).
  if (i % POINTS_PER_CYCLE === 0) {
    point.name = `Week ${weekIndex + 1}`;
    point.dataLabels = {
      enabled: true,
      format: "{point.name}",
      align: "right",
      x: -14,
      y: 2,
      style: { color: t.inkSoft, fontSize: "14px", fontWeight: "600", textOutline: "none" },
    };
  }
  spiralPoints.push(point);
  structurePath.push([x, y]);
}

// Radial grid lines — one spoke per day-of-week subdivision within a cycle.
const spokeSeries = DAY_NAMES.map((_, dayIndex) => {
  const screenAngle = Math.PI / 2 - (2 * Math.PI * dayIndex) / DAYS_PER_CYCLE;
  return {
    type: "line",
    data: [
      [0, 0],
      [RADIUS_MAX * Math.cos(screenAngle), RADIUS_MAX * Math.sin(screenAngle)],
    ],
    color: t.grid,
    lineWidth: 1,
    marker: { enabled: false },
    enableMouseTracking: false,
    showInLegend: false,
  };
});

// Concentric rings mark each completed cycle (one full revolution = one week).
const ringSeries = Array.from({ length: NUM_CYCLES }, (_, cycleIndex) => {
  const radius = (RADIUS_MAX * (cycleIndex + 1)) / NUM_CYCLES;
  const segments = 96;
  const data = Array.from({ length: segments + 1 }, (_, s) => {
    const a = (2 * Math.PI * s) / segments;
    return [radius * Math.cos(a), radius * Math.sin(a)];
  });
  return {
    type: "line",
    data,
    color: t.grid,
    lineWidth: 1,
    dashStyle: "Dot",
    marker: { enabled: false },
    enableMouseTracking: false,
    showInLegend: false,
  };
});

// --- Chart -------------------------------------------------------------------
const chart = Highcharts.chart("container", {
  chart: {
    type: "scatter",
    backgroundColor: "transparent",
    animation: false,
    margin: [90, 90, 90, 90],
    style: { fontFamily: "inherit" },
  },
  credits: { enabled: false },
  colors: t.palette,
  title: {
    text: "spiral-timeseries · javascript · highcharts · anyplot.ai",
    style: { color: t.ink, fontSize: "22px", fontWeight: "600" },
  },
  subtitle: {
    text: "Website page views · every 2 hours · 8 weekly cycles",
    style: { color: t.inkSoft, fontSize: "14px" },
  },
  xAxis: { min: -AXIS_EXTENT, max: AXIS_EXTENT, visible: false, startOnTick: false, endOnTick: false },
  yAxis: {
    min: -AXIS_EXTENT,
    max: AXIS_EXTENT,
    visible: false,
    startOnTick: false,
    endOnTick: false,
    title: { text: null },
  },
  legend: { enabled: false },
  tooltip: {
    backgroundColor: t.elevatedBg,
    borderColor: t.inkSoft,
    style: { color: t.ink, fontSize: "13px" },
    formatter: function () {
      const p = this.point;
      return (
        `Week ${p.weekIndex + 1}, ${DAY_NAMES[p.dayOfWeek]} ${String(p.hourOfDay).padStart(2, "0")}:00<br/>` +
        `<b>${Math.round(p.value)}</b> page views`
      );
    },
  },
  plotOptions: {
    series: { animation: false },
    line: { enableMouseTracking: false },
  },
  series: [
    ...ringSeries,
    ...spokeSeries,
    {
      name: "Spiral path",
      type: "line",
      data: structurePath,
      color: t.inkSoft,
      opacity: 0.35,
      lineWidth: 2,
      marker: { enabled: false },
      enableMouseTracking: false,
      showInLegend: false,
    },
    {
      name: "Page views",
      type: "scatter",
      data: spiralPoints,
      marker: { radius: 4, symbol: "circle", lineWidth: 0 },
      showInLegend: false,
    },
  ],
});

// Manual color bar — the core Highcharts bundle has no colorAxis/heatmap
// module, so the Imprint sequential gradient is drawn directly with the SVG
// renderer instead of relying on a colorAxis legend.
const barWidth = 220;
const barHeight = 16;
const barX = chart.chartWidth - barWidth - 50;
const barY = chart.chartHeight - 68;

chart.renderer
  .text("Page views", barX, barY - 10)
  .css({ color: t.inkSoft, fontSize: "13px" })
  .add();
chart.renderer
  .rect(barX, barY, barWidth, barHeight, 0)
  .attr({
    fill: {
      linearGradient: { x1: 0, y1: 0, x2: 1, y2: 0 },
      stops: [
        [0, t.seq[0]],
        [1, t.seq[1]],
      ],
    },
    stroke: t.inkSoft,
    "stroke-width": 1,
  })
  .add();
chart.renderer
  .text(`${Math.round(minValue)}`, barX, barY + barHeight + 20)
  .css({ color: t.inkSoft, fontSize: "12px" })
  .add();
chart.renderer
  .text(`${Math.round(maxValue)}`, barX + barWidth - 16, barY + barHeight + 20)
  .css({ color: t.inkSoft, fontSize: "12px" })
  .add();
Runnable source as JSON, for any HTTP client: https://api.anyplot.ai/specs/spiral-timeseries/highcharts/code. Any spec id and library id listed in llms-full.txt fit the same URL shape; every URL below is complete and callable.
{
  "spec_id": "spiral-timeseries",
  "language": "javascript",
  "library": "highcharts",
  "page": "https://anyplot.ai/spiral-timeseries/javascript/highcharts",
  "hub": "https://anyplot.ai/spiral-timeseries",
  "code_json": "https://api.anyplot.ai/specs/spiral-timeseries/highcharts/code",
  "spec_json": "https://api.anyplot.ai/specs/spiral-timeseries",
  "render_light_png": "https://storage.googleapis.com/anyplot-images/plots/spiral-timeseries/javascript/highcharts/plot-light.png",
  "render_dark_png": "https://storage.googleapis.com/anyplot-images/plots/spiral-timeseries/javascript/highcharts/plot-dark.png",
  "interactive_light_html": "https://storage.googleapis.com/anyplot-images/plots/spiral-timeseries/javascript/highcharts/plot-light.html",
  "interactive_dark_html": "https://storage.googleapis.com/anyplot-images/plots/spiral-timeseries/javascript/highcharts/plot-dark.html",
  "quality_score": 91.0,
  "license": "MIT",
  "guide": "https://anyplot.ai/llms.txt"
}
Part of Spiral Time Series Chart on anyplot.ai.