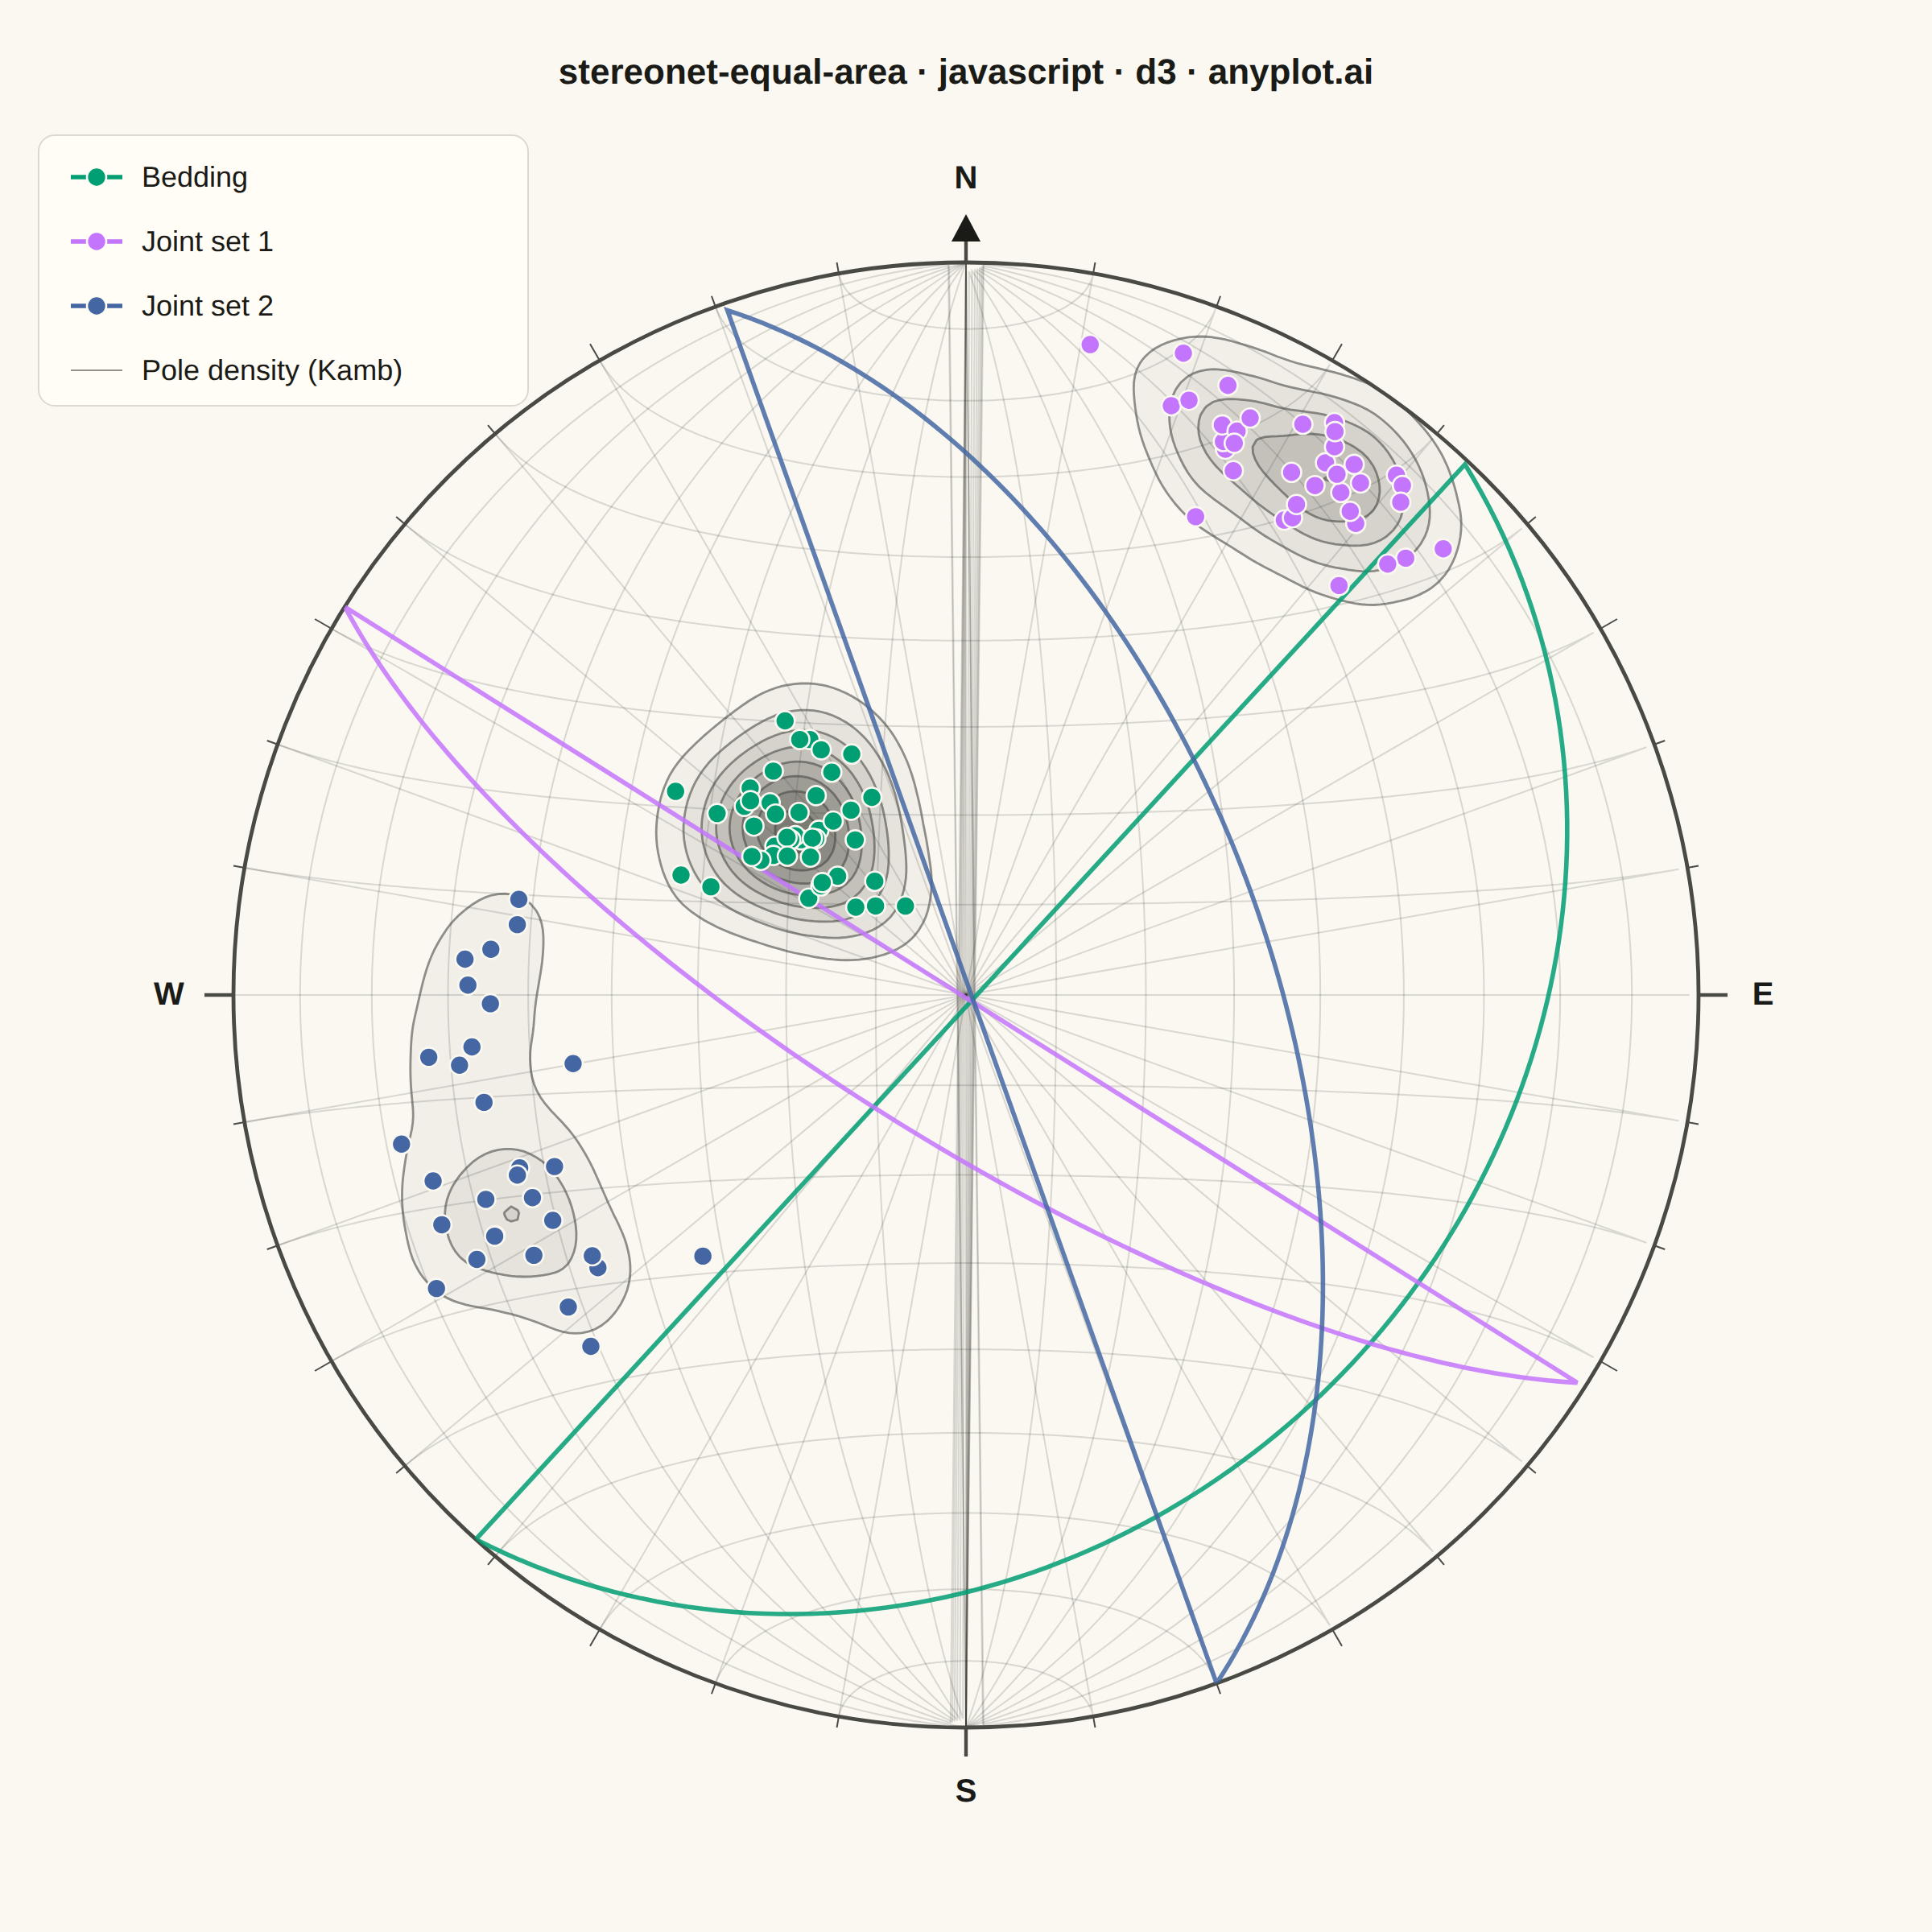
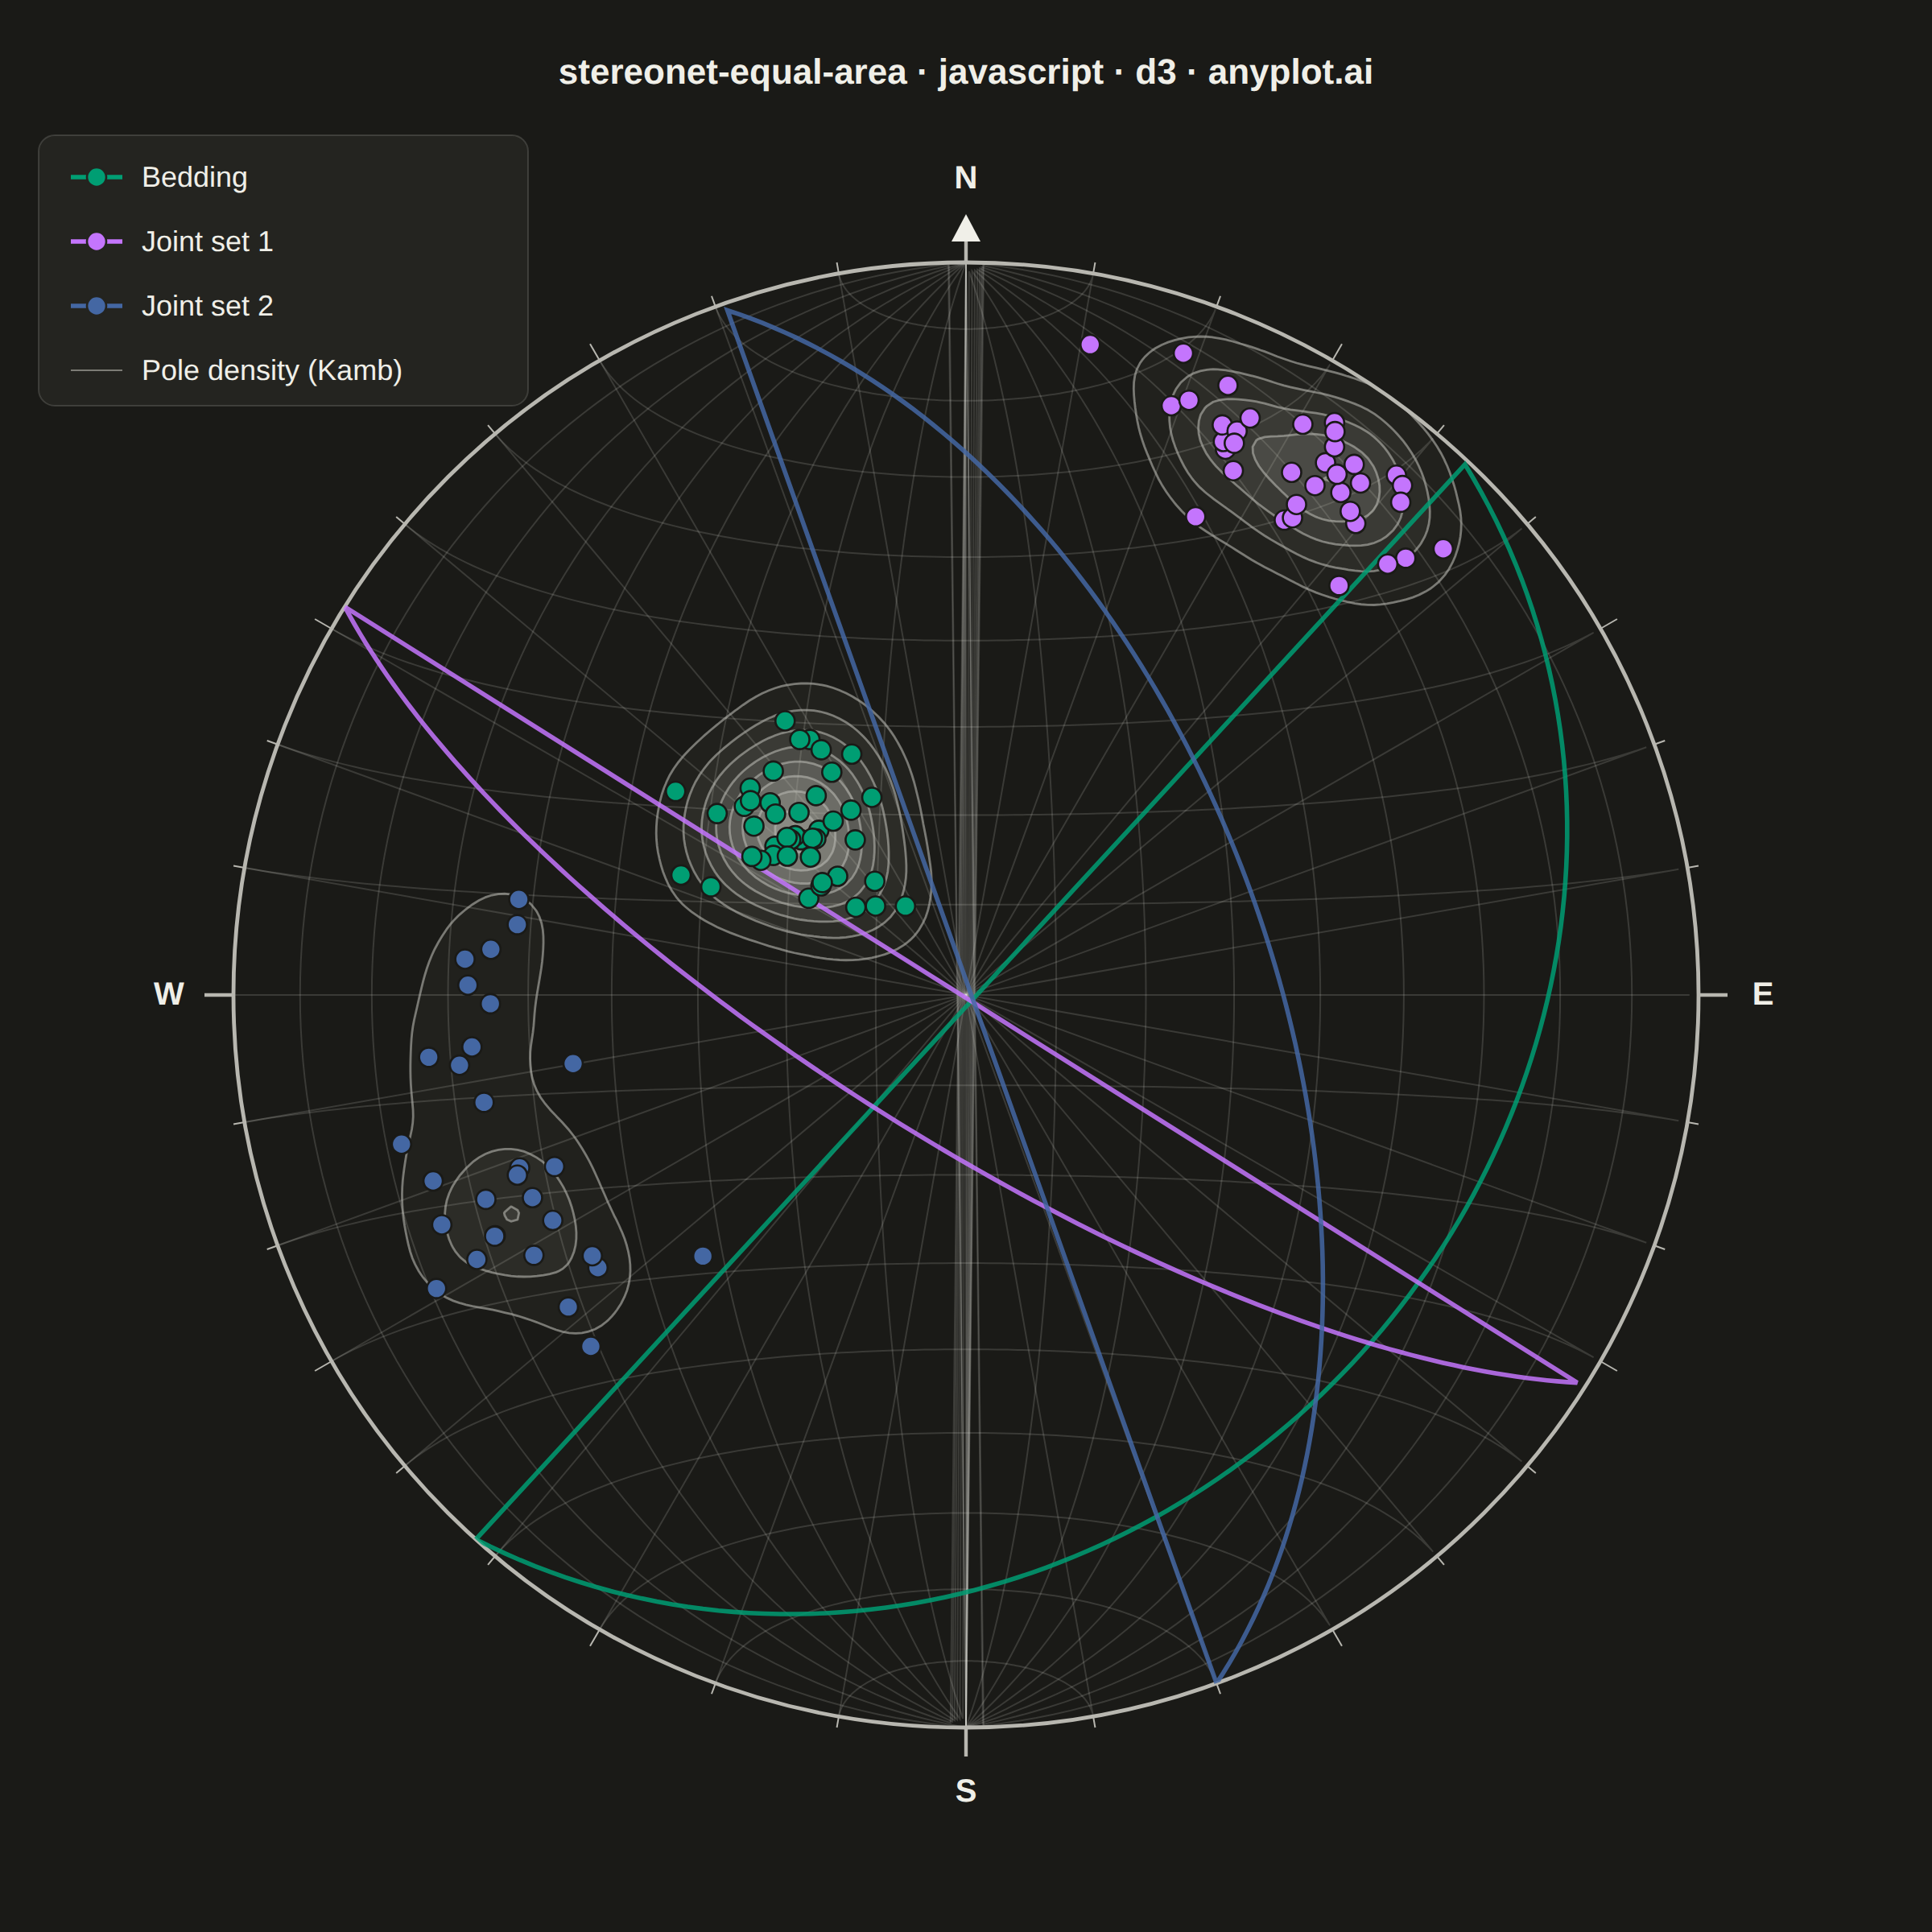
A Schmidt equal-area (lower-hemisphere) stereographic projection for plotting geological structural data. Great circles represent planar features (bedding, faults, joints) by their strike and dip, while poles to planes are plotted as points showing the orientation of the normal to each plane. Density contours highlight preferred orientations in clustered data. This is the standard projection used in structural geology for analyzing fabric elements and kinematic indicators.
// anyplot.ai
// stereonet-equal-area: Structural Geology Stereonet (Equal-Area Projection)
// Library: d3 7.9.0 | JavaScript 22.22.3
// Quality: 91/100 | Created: 2026-06-16
//# anyplot-orientation: square
// anyplot.ai
// stereonet-equal-area: Structural Geology Stereonet (Equal-Area Projection)
// Library: d3 7.9.0 | JavaScript 22
// Quality: pending | Created: 2026-06-16

const t = window.ANYPLOT_TOKENS;
const { width, height } = window.ANYPLOT_SIZE;

const DEG = Math.PI / 180;
const cx = width / 2;
const cy = height / 2 + 18;
const R = 455; // radius of the primitive (horizontal) circle

// --- Vector helpers (right-handed: x=North, y=East, z=Down) -----------------
// A line is a downward unit vector; planes are handled through their pole.
function vecTP(trendDeg, plungeDeg) {
  const tr = trendDeg * DEG;
  const pl = plungeDeg * DEG;
  return [Math.cos(pl) * Math.cos(tr), Math.cos(pl) * Math.sin(tr), Math.sin(pl)];
}
function cross(a, b) {
  return [a[1] * b[2] - a[2] * b[1], a[2] * b[0] - a[0] * b[2], a[0] * b[1] - a[1] * b[0]];
}
function norm(a) {
  const m = Math.hypot(a[0], a[1], a[2]) || 1;
  return [a[0] / m, a[1] / m, a[2] / m];
}
function poleVec(strike, dip) {
  // Pole (normal) plunges 90-dip opposite the dip direction (strike + 90 + 180).
  return vecTP(strike + 270, 90 - dip);
}

// Lower-hemisphere equal-area (Schmidt) projection of a unit vector to screen px.
function project(v) {
  let [n, e, d] = v;
  if (d < 0) {
    n = -n;
    e = -e;
    d = -d;
  }
  const trend = Math.atan2(e, n);
  const phi = Math.acos(Math.max(-1, Math.min(1, d))); // colatitude from down-vertical
  const r = R * Math.SQRT2 * Math.sin(phi / 2);
  return [cx + r * Math.sin(trend), cy - r * Math.cos(trend)];
}

// Sample a parametric curve t->unit vector; flag points on the lower hemisphere
// so the polyline breaks where the great/small circle leaves the net.
function sampleCurve(fn, steps) {
  const pts = [];
  for (let i = 0; i <= steps; i++) {
    const v = fn((i / steps) * 2 * Math.PI);
    const [x, y] = project(v);
    pts.push({ x, y, def: v[2] >= -1e-9 });
  }
  return pts;
}
function greatCircle(pole) {
  const P = norm(pole);
  const ref = Math.abs(P[2]) < 0.9 ? [0, 0, 1] : [1, 0, 0];
  const u1 = norm(cross(P, ref));
  const u2 = cross(P, u1);
  return sampleCurve(
    (a) => [
      u1[0] * Math.cos(a) + u2[0] * Math.sin(a),
      u1[1] * Math.cos(a) + u2[1] * Math.sin(a),
      u1[2] * Math.cos(a) + u2[2] * Math.sin(a),
    ],
    256,
  );
}
function smallCircle(axis, alphaDeg) {
  const A = norm(axis);
  const al = alphaDeg * DEG;
  const ref = Math.abs(A[2]) < 0.9 ? [0, 0, 1] : [1, 0, 0];
  const u1 = norm(cross(A, ref));
  const u2 = cross(A, u1);
  const c = Math.cos(al);
  const s = Math.sin(al);
  return sampleCurve(
    (a) => [
      c * A[0] + s * (Math.cos(a) * u1[0] + Math.sin(a) * u2[0]),
      c * A[1] + s * (Math.cos(a) * u1[1] + Math.sin(a) * u2[1]),
      c * A[2] + s * (Math.cos(a) * u1[2] + Math.sin(a) * u2[2]),
    ],
    256,
  );
}

const line = d3
  .line()
  .defined((d) => d.def)
  .x((d) => d.x)
  .y((d) => d.y);

// --- Data: simulated field campaign, three structural sets ------------------
// Deterministic LCG + Box-Muller for reproducible Gaussian scatter (no RNG seed
// in the browser, no network loads).
let seed = 42 >>> 0;
function rnd() {
  seed = (seed * 1664525 + 1013904223) >>> 0;
  return seed / 4294967296;
}
function gauss() {
  const u = Math.max(rnd(), 1e-9);
  const v = rnd();
  return Math.sqrt(-2 * Math.log(u)) * Math.cos(2 * Math.PI * v);
}

const sets = [
  { name: "Bedding", color: t.palette[0], strike: 42, dip: 28, sStrike: 12, sDip: 6, n: 44 },
  { name: "Joint set 1", color: t.palette[1], strike: 122, dip: 74, sStrike: 9, sDip: 6, n: 36 },
  { name: "Joint set 2", color: t.palette[2], strike: 340, dip: 56, sStrike: 13, sDip: 8, n: 30 },
];

const poles = [];
for (const s of sets) {
  for (let i = 0; i < s.n; i++) {
    const strike = s.strike + gauss() * s.sStrike;
    const dip = Math.max(2, Math.min(89, s.dip + gauss() * s.sDip));
    const [x, y] = project(poleVec(strike, dip));
    poles.push({ x, y, color: s.color });
  }
}

// --- SVG mount --------------------------------------------------------------
const svg = d3.select("#container").append("svg").attr("width", width).attr("height", height);
const defs = svg.append("defs");
defs.append("clipPath").attr("id", "primitive").append("circle").attr("cx", cx).attr("cy", cy).attr("r", R);

// --- Equal-area net grid (subtle): meridians + parallels --------------------
const netCurves = [];
for (const strike of [0, 180]) {
  for (const dip of [10, 20, 30, 40, 50, 60, 70, 80]) netCurves.push(greatCircle(poleVec(strike, dip)));
}
netCurves.push(greatCircle(poleVec(0, 90))); // vertical N–S meridian
for (const alpha of [10, 20, 30, 40, 50, 60, 70, 80, 90, 100, 110, 120, 130, 140, 150, 160, 170]) {
  netCurves.push(smallCircle([1, 0, 0], alpha)); // parallels about the N–S axis
}
svg
  .append("g")
  .attr("clip-path", "url(#primitive)")
  .selectAll("path")
  .data(netCurves)
  .join("path")
  .attr("fill", "none")
  .attr("stroke", t.grid)
  .attr("stroke-width", 1)
  .attr("d", line);

// --- Kamb-style density contours over all poles -----------------------------
const contours = d3
  .contourDensity()
  .x((d) => d.x)
  .y((d) => d.y)
  .size([width, height])
  .cellSize(4)
  .bandwidth(26)
  .thresholds(9)(poles);
// Graduated neutral shading: denser inner contours read darker so the three
// "preferred orientation" focal points pop, while strokes stay crisp.
const densityMax = d3.max(contours, (c) => c.value) || 1;
const densityFill = d3.scaleLinear().domain([0, densityMax]).range([0.02, 0.24]);
svg
  .append("g")
  .attr("clip-path", "url(#primitive)")
  .selectAll("path")
  .data(contours)
  .join("path")
  .attr("d", d3.geoPath())
  .attr("fill", t.inkSoft)
  .attr("fill-opacity", (c) => densityFill(c.value))
  .attr("stroke", t.inkSoft)
  .attr("stroke-opacity", 0.6)
  .attr("stroke-width", 1.4);

// --- Primitive circle + perimeter degree ticks (every 10°) ------------------
svg
  .append("circle")
  .attr("cx", cx)
  .attr("cy", cy)
  .attr("r", R)
  .attr("fill", "none")
  .attr("stroke", t.inkSoft)
  .attr("stroke-width", 2.4);

const ticks = svg.append("g");
for (let az = 0; az < 360; az += 10) {
  const a = az * DEG;
  const len = az % 90 === 0 ? 18 : az % 30 === 0 ? 12 : 7;
  ticks
    .append("line")
    .attr("x1", cx + R * Math.sin(a))
    .attr("y1", cy - R * Math.cos(a))
    .attr("x2", cx + (R + len) * Math.sin(a))
    .attr("y2", cy - (R + len) * Math.cos(a))
    .attr("stroke", t.inkSoft)
    .attr("stroke-width", az % 90 === 0 ? 2.2 : 1);
}

// --- Great circles of each set's mean plane ---------------------------------
svg
  .append("g")
  .attr("clip-path", "url(#primitive)")
  .selectAll("path")
  .data(sets)
  .join("path")
  .attr("fill", "none")
  .attr("stroke", (s) => s.color)
  .attr("stroke-width", 2.8)
  .attr("opacity", 0.85)
  .attr("d", (s) => line(greatCircle(poleVec(s.strike, s.dip))));

// --- Poles to planes (points) -----------------------------------------------
svg
  .append("g")
  .selectAll("circle")
  .data(poles)
  .join("circle")
  .attr("cx", (d) => d.x)
  .attr("cy", (d) => d.y)
  .attr("r", 6)
  .attr("fill", (d) => d.color)
  .attr("stroke", t.pageBg)
  .attr("stroke-width", 1.3);

// --- North arrow + cardinal labels ------------------------------------------
svg
  .append("path")
  .attr("d", `M ${cx} ${cy - R - 30} L ${cx - 9} ${cy - R - 13} L ${cx + 9} ${cy - R - 13} Z`)
  .attr("fill", t.ink);
const cardinals = [
  ["N", 0, R + 52],
  ["E", 90, R + 40],
  ["S", 180, R + 40],
  ["W", 270, R + 40],
];
for (const [label, az, rr] of cardinals) {
  const a = az * DEG;
  svg
    .append("text")
    .attr("x", cx + rr * Math.sin(a))
    .attr("y", cy - rr * Math.cos(a))
    .attr("text-anchor", "middle")
    .attr("dominant-baseline", "central")
    .attr("fill", t.ink)
    .style("font-size", "20px")
    .style("font-weight", "600")
    .text(label);
}

// --- Legend (top-left corner, on an elevated panel) -------------------------
const legendItems = [
  ...sets.map((s) => ({ label: s.name, color: s.color, kind: "plane" })),
  { label: "Pole density (Kamb)", color: t.inkSoft, kind: "contour" },
];
const legend = svg.append("g").attr("transform", "translate(44, 110)");
legend
  .append("rect")
  .attr("x", -20)
  .attr("y", -26)
  .attr("width", 304)
  .attr("height", legendItems.length * 40 + 8)
  .attr("rx", 10)
  .attr("fill", t.elevatedBg)
  .attr("stroke", t.grid)
  .attr("stroke-width", 1);
legendItems.forEach((it, i) => {
  const row = legend.append("g").attr("transform", `translate(0, ${i * 40})`);
  if (it.kind === "plane") {
    row.append("line").attr("x1", 0).attr("x2", 32).attr("y1", 0).attr("y2", 0).attr("stroke", it.color).attr("stroke-width", 2.8);
    row
      .append("circle")
      .attr("cx", 16)
      .attr("cy", 0)
      .attr("r", 6)
      .attr("fill", it.color)
      .attr("stroke", t.elevatedBg)
      .attr("stroke-width", 1.3);
  } else {
    row.append("line").attr("x1", 0).attr("x2", 32).attr("y1", 0).attr("y2", 0).attr("stroke", it.color).attr("stroke-width", 1).attr("opacity", 0.6);
  }
  row
    .append("text")
    .attr("x", 44)
    .attr("y", 0)
    .attr("dominant-baseline", "central")
    .attr("fill", t.ink)
    .style("font-size", "18px")
    .text(it.label);
});

// --- Title ------------------------------------------------------------------
svg
  .append("text")
  .attr("x", width / 2)
  .attr("y", 52)
  .attr("text-anchor", "middle")
  .attr("fill", t.ink)
  .style("font-size", "22px")
  .style("font-weight", "600")
  .text("stereonet-equal-area · javascript · d3 · anyplot.ai");
Runnable source as JSON, for any HTTP client: https://api.anyplot.ai/specs/stereonet-equal-area/d3/code. Any spec id and library id listed in llms-full.txt fit the same URL shape; every URL below is complete and callable.
{
  "spec_id": "stereonet-equal-area",
  "language": "javascript",
  "library": "d3",
  "page": "https://anyplot.ai/stereonet-equal-area/javascript/d3",
  "hub": "https://anyplot.ai/stereonet-equal-area",
  "code_json": "https://api.anyplot.ai/specs/stereonet-equal-area/d3/code",
  "spec_json": "https://api.anyplot.ai/specs/stereonet-equal-area",
  "render_light_png": "https://storage.googleapis.com/anyplot-images/plots/stereonet-equal-area/javascript/d3/plot-light.png",
  "render_dark_png": "https://storage.googleapis.com/anyplot-images/plots/stereonet-equal-area/javascript/d3/plot-dark.png",
  "interactive_light_html": "https://storage.googleapis.com/anyplot-images/plots/stereonet-equal-area/javascript/d3/plot-light.html",
  "interactive_dark_html": "https://storage.googleapis.com/anyplot-images/plots/stereonet-equal-area/javascript/d3/plot-dark.html",
  "quality_score": 91.0,
  "license": "MIT",
  "guide": "https://anyplot.ai/llms.txt"
}
Part of Structural Geology Stereonet (Equal-Area Projection) on anyplot.ai.