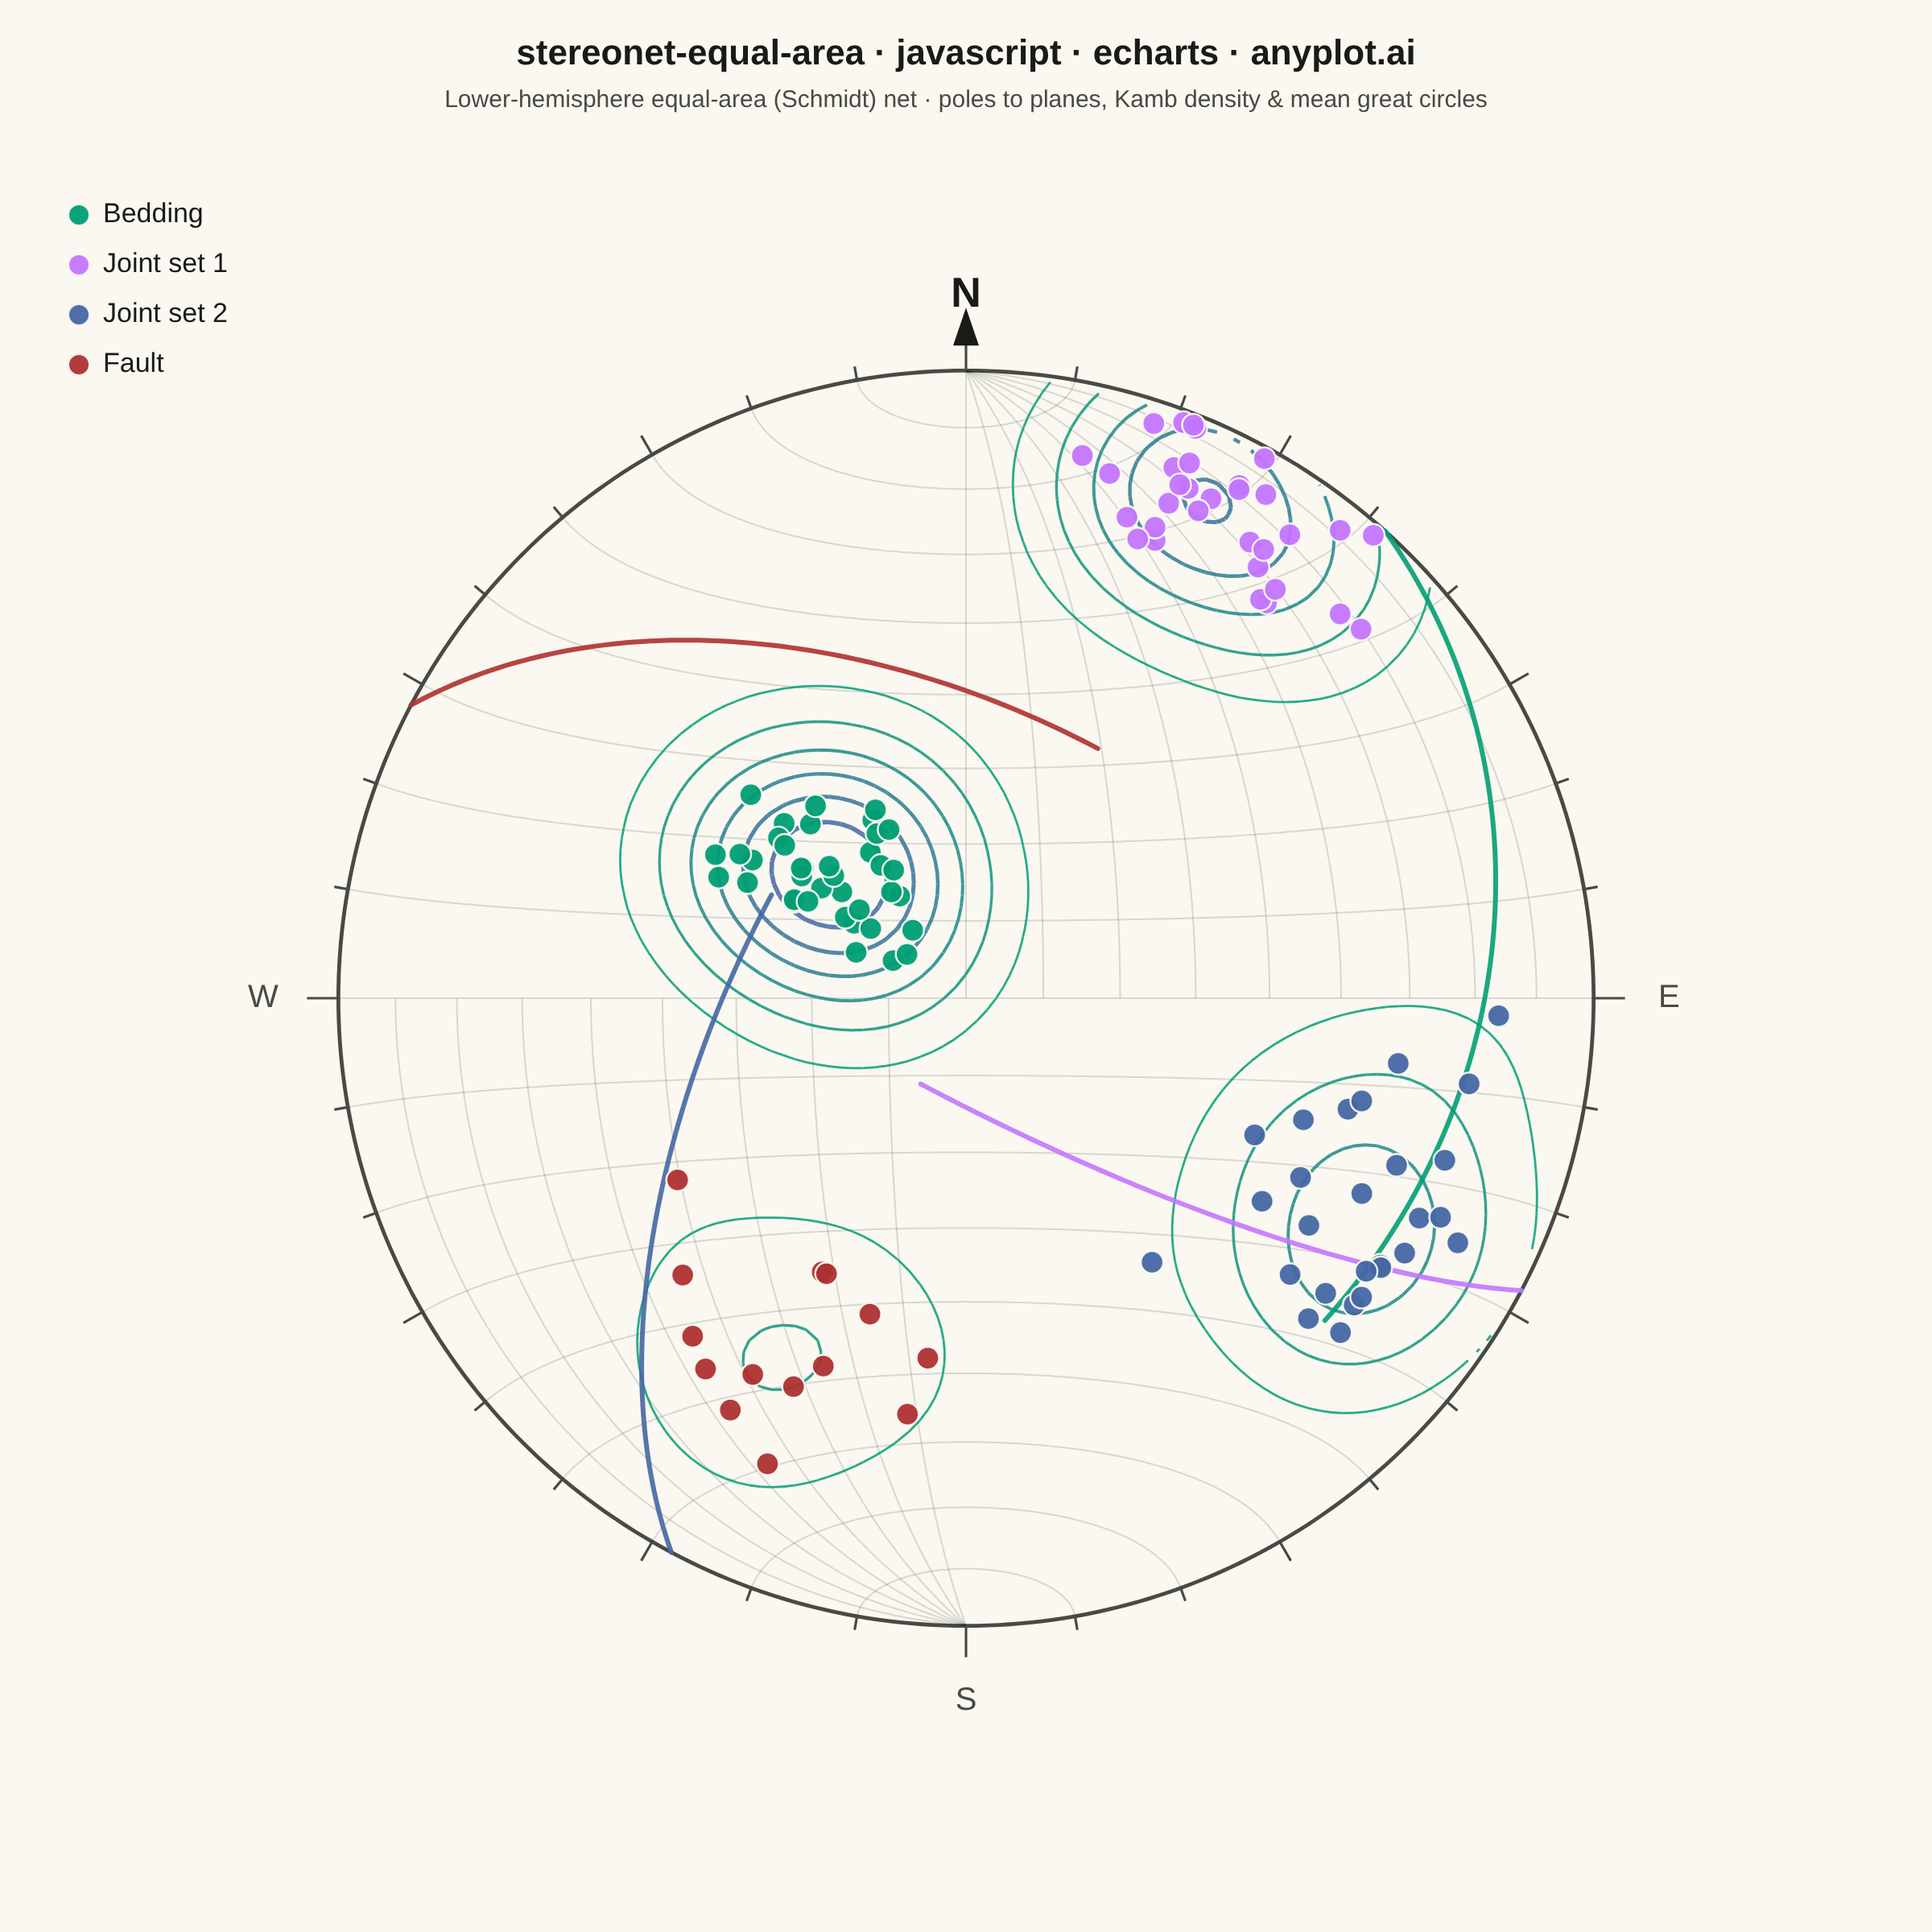
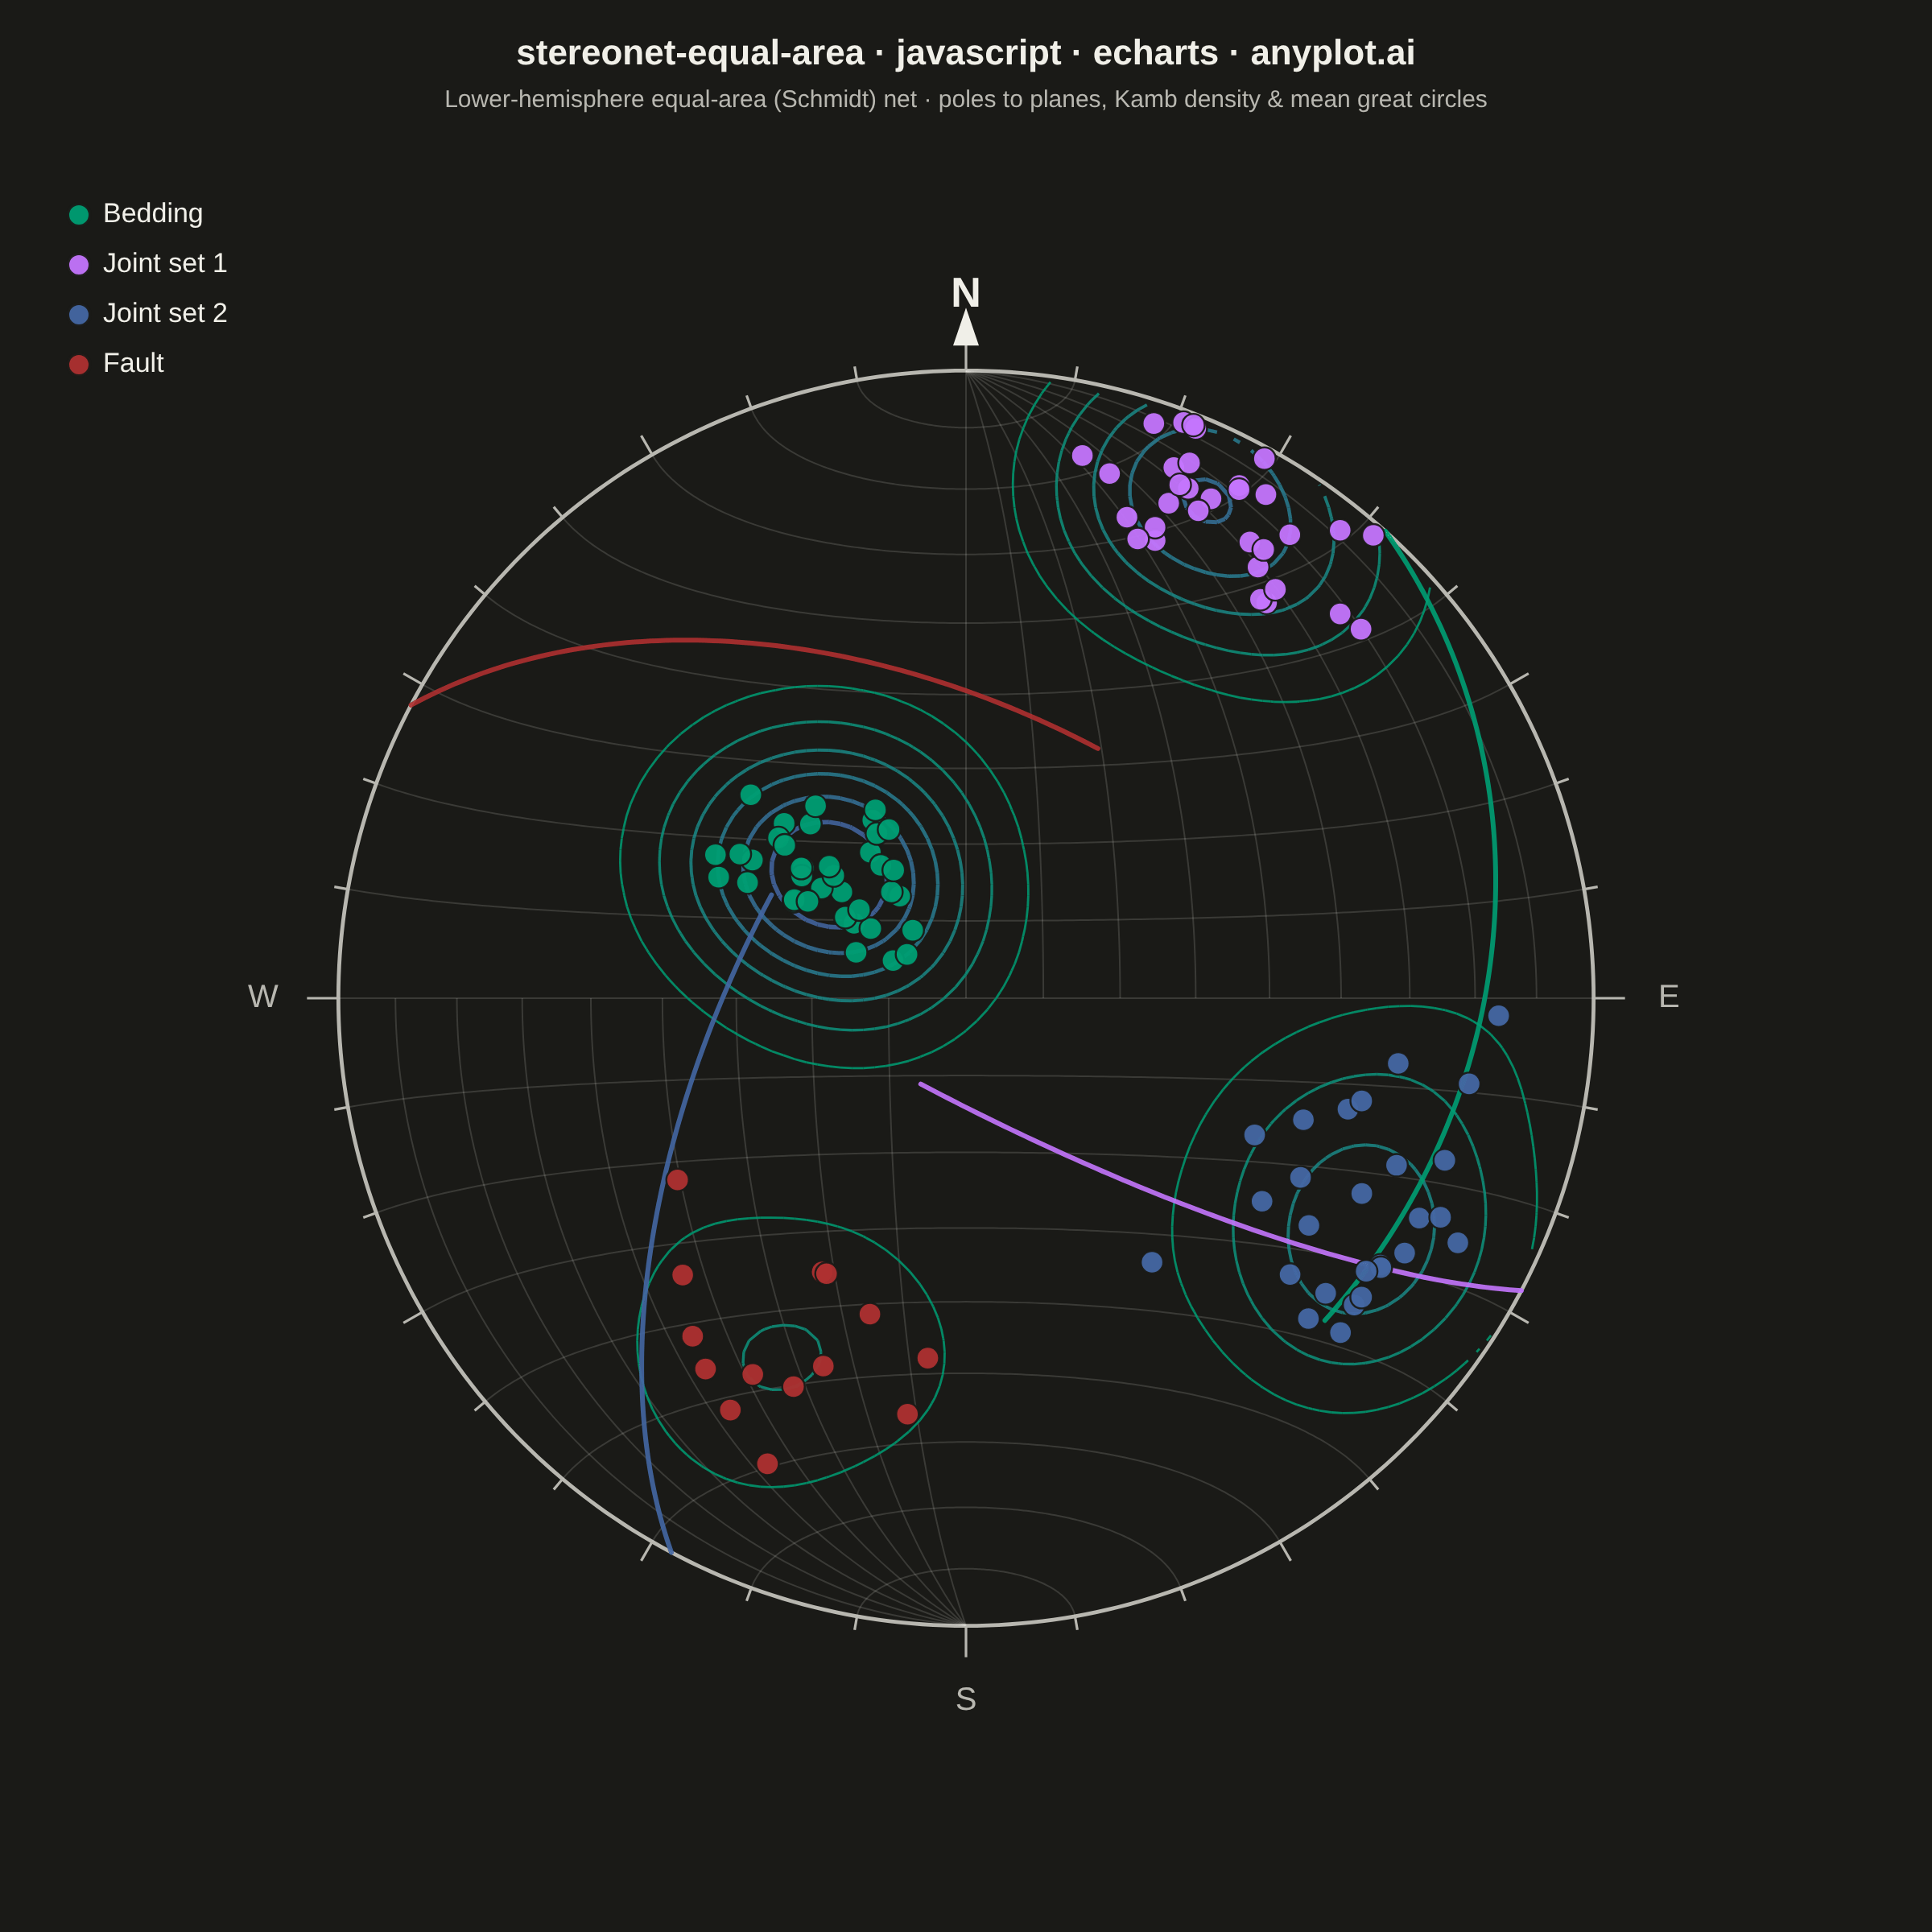
A Schmidt equal-area (lower-hemisphere) stereographic projection for plotting geological structural data. Great circles represent planar features (bedding, faults, joints) by their strike and dip, while poles to planes are plotted as points showing the orientation of the normal to each plane. Density contours highlight preferred orientations in clustered data. This is the standard projection used in structural geology for analyzing fabric elements and kinematic indicators.
// anyplot.ai
// stereonet-equal-area: Structural Geology Stereonet (Equal-Area Projection)
// Library: echarts 5.5.1 | JavaScript 22.22.3
// Quality: 90/100 | Created: 2026-06-16
//# anyplot-orientation: square
// anyplot.ai
// stereonet-equal-area: Structural Geology Stereonet (Equal-Area Projection)
// Library: echarts 5.5.1 | JavaScript
// Quality: pending | Created: 2026-06-16
//
// Schmidt lower-hemisphere equal-area net rendered idiomatically in ECharts.
// ECharts has no native stereonet, so we build the projection ourselves on a
// hidden square cartesian2d grid: the equal-area net (meridians + small circles)
// and the great circles / poles are computed in data coords [-1,1] and drawn with
// `custom` series + `scatter`. Imprint palette throughout; only chrome flips with
// the theme.

const t = window.ANYPLOT_TOKENS;
const THEME = window.ANYPLOT_THEME;
const ink = t.ink;
const inkSoft = t.inkSoft;
const grid = t.grid;
const muted = THEME === "light" ? "#6B6A63" : "#A8A79F";

const DEG = Math.PI / 180;
const SQRT2 = Math.SQRT2;

// --- Deterministic RNG (LCG + Box-Muller) ----------------------------------
let _seed = 20260616 >>> 0;
function rand() {
  _seed = (_seed * 1664525 + 1013904223) >>> 0;
  return _seed / 4294967296;
}
function gauss() {
  let u = 0, v = 0;
  while (u === 0) u = rand();
  while (v === 0) v = rand();
  return Math.sqrt(-2 * Math.log(u)) * Math.cos(2 * Math.PI * v);
}
const clamp = (x, lo, hi) => Math.min(hi, Math.max(lo, x));

// --- Equal-area (Schmidt) projection helpers -------------------------------
// Convention: vectors are [E(east), N(north), D(down)]; lower hemisphere is D>=0.
// The net centre is the vertical line (plunge 90); the primitive circle (r=1) is
// the horizontal plane. Azimuth (trend) is measured clockwise from North (top).
function vecToXY(v) {
  let [E, N, D] = v;
  if (D < 0) { E = -E; N = -N; D = -D; } // force lower hemisphere
  const horiz = Math.hypot(E, N);
  const theta = Math.acos(clamp(D, -1, 1)); // angular distance from centre
  const r = SQRT2 * Math.sin(theta / 2);    // equal-area radius (=1 at horizon)
  if (horiz < 1e-9) return [0, 0];
  return [r * (E / horiz), r * (N / horiz)];
}

// Pole (normal) to a plane given strike & dip (right-hand rule: dip dir = strike+90)
function poleVec(strike, dip) {
  const dipDir = strike + 90;
  const pTrend = (dipDir + 180) * DEG; // pole azimuth
  const pPlunge = (90 - dip) * DEG;    // pole plunge below horizontal
  const cp = Math.cos(pPlunge);
  return [cp * Math.sin(pTrend), cp * Math.cos(pTrend), Math.sin(pPlunge)];
}

function norm(v) {
  const m = Math.hypot(v[0], v[1], v[2]) || 1;
  return [v[0] / m, v[1] / m, v[2] / m];
}
function cross(a, b) {
  return [a[1] * b[2] - a[2] * b[1], a[2] * b[0] - a[0] * b[2], a[0] * b[1] - a[1] * b[0]];
}

// Great-circle arc of the plane whose pole is `n` (lower-hemisphere half).
function greatCircleArc(n) {
  n = norm(n);
  const u = norm(cross(n, [0, 0, 1])); // horizontal in-plane direction
  const v = cross(n, u);               // completes the in-plane basis
  const pts = [];
  for (let k = 0; k <= 180; k++) {
    const phi = (-Math.PI / 2) + (k / 180) * Math.PI; // half-circle, contiguous
    const D = Math.sin(phi) * v[2];
    if (D < -1e-9) continue;
    pts.push(vecToXY([
      Math.cos(phi) * u[0] + Math.sin(phi) * v[0],
      Math.cos(phi) * u[1] + Math.sin(phi) * v[1],
      Math.cos(phi) * u[2] + Math.sin(phi) * v[2],
    ]));
  }
  return pts;
}

// --- The equal-area net (subtle background grid) ---------------------------
const netLines = [];
// Meridians: great circles sharing the N-S axis, dipping E and W every 10 deg.
for (let d = 10; d <= 80; d += 10) {
  netLines.push(greatCircleArc(poleVec(0, d)));   // east-dipping
  netLines.push(greatCircleArc(poleVec(180, d))); // west-dipping
}
netLines.push(greatCircleArc(poleVec(0, 90)));    // N-S diameter
// Small circles: cones about the horizontal N-S axis every 10 deg.
const nAxis = [0, 1, 0], e1 = [1, 0, 0], e2 = [0, 0, 1];
for (let a = 10; a <= 170; a += 10) {
  const ca = Math.cos(a * DEG), sa = Math.sin(a * DEG);
  const arc = [];
  for (let k = 0; k <= 180; k++) {
    const tt = (k / 180) * Math.PI;
    const vec = [
      ca * nAxis[0] + sa * (Math.cos(tt) * e1[0] + Math.sin(tt) * e2[0]),
      ca * nAxis[1] + sa * (Math.cos(tt) * e1[1] + Math.sin(tt) * e2[1]),
      ca * nAxis[2] + sa * (Math.cos(tt) * e1[2] + Math.sin(tt) * e2[2]),
    ];
    if (vec[2] < -1e-9) continue;
    arc.push(vecToXY(vec));
  }
  if (arc.length > 1) netLines.push(arc);
}
// Primitive circle (horizon) + perimeter ticks + cardinal labels.
const primitive = [];
for (let k = 0; k <= 360; k++) primitive.push([Math.sin(k * DEG), Math.cos(k * DEG)]);
const ticks = [];
for (let az = 0; az < 360; az += 10) {
  const outer = az % 90 === 0 ? 1.05 : az % 30 === 0 ? 1.035 : 1.022;
  const s = Math.sin(az * DEG), c = Math.cos(az * DEG);
  ticks.push([[s, c], [outer * s, outer * c]]);
}
const cardinals = [
  { t: "N", a: 0 }, { t: "E", a: 90 }, { t: "S", a: 180 }, { t: "W", a: 270 },
];

// --- Field data: poles to planes, by feature type --------------------------
// Imprint palette, canonical order; faults take the matte-red semantic anchor.
const SETS = [
  { name: "Bedding", strike: 42, dip: 24, sS: 11, sD: 7, n: 38, color: t.palette[0] },
  { name: "Joint set 1", strike: 118, dip: 78, sS: 9, sD: 8, n: 32, color: t.palette[1] },
  { name: "Joint set 2", strike: 205, dip: 66, sS: 12, sD: 9, n: 27, color: t.palette[2] },
  { name: "Fault", strike: 302, dip: 52, sS: 14, sD: 10, n: 14, color: t.palette[4] },
];

const allPoles = []; // projected [x,y] for density
const poleSeries = SETS.map((set) => {
  const data = [];
  let mean = [0, 0, 0];
  for (let i = 0; i < set.n; i++) {
    const strike = set.strike + gauss() * set.sS;
    const dip = clamp(set.dip + gauss() * set.sD, 2, 88);
    const pv = poleVec(strike, dip);
    mean = [mean[0] + pv[0], mean[1] + pv[1], mean[2] + (pv[2] < 0 ? -pv[2] : pv[2])];
    const xy = vecToXY(pv);
    data.push(xy);
    allPoles.push(xy);
  }
  return { ...set, data, mean: norm(mean) };
});

// --- Kamb-style density (Gaussian KDE in the projection plane) -------------
const N = 110, H = 0.13, INV = 1 / (2 * H * H);
const gx = [], gy = [];
for (let i = 0; i <= N; i++) {
  const c = -1 + (2 * i) / N;
  gx.push(c); gy.push(c);
}
const Z = [];
let maxD = 0;
for (let j = 0; j <= N; j++) {
  Z[j] = [];
  for (let i = 0; i <= N; i++) {
    const x = gx[i], y = gy[j];
    if (x * x + y * y > 1.0) { Z[j][i] = NaN; continue; }
    let s = 0;
    for (const p of allPoles) {
      const dx = x - p[0], dy = y - p[1];
      s += Math.exp(-(dx * dx + dy * dy) * INV);
    }
    Z[j][i] = s;
    if (s > maxD) maxD = s;
  }
}
// Marching squares -> contour segments coloured along imprint_seq (low->high).
function hex(c) { const n = parseInt(c.slice(1), 16); return [n >> 16 & 255, n >> 8 & 255, n & 255]; }
const seqLo = hex(t.seq[0]), seqHi = hex(t.seq[1]);
function seqColor(f) {
  const r = Math.round(seqLo[0] + (seqHi[0] - seqLo[0]) * f);
  const g = Math.round(seqLo[1] + (seqHi[1] - seqLo[1]) * f);
  const b = Math.round(seqLo[2] + (seqHi[2] - seqLo[2]) * f);
  return `rgb(${r},${g},${b})`;
}
const LEVF = [0.12, 0.25, 0.4, 0.55, 0.7, 0.85];
const contours = [];
for (let li = 0; li < LEVF.length; li++) {
  const L = LEVF[li] * maxD;
  const col = seqColor(li / (LEVF.length - 1));
  const lw = 1.4 + 1.4 * (li / (LEVF.length - 1));
  for (let j = 0; j < N; j++) {
    for (let i = 0; i < N; i++) {
      const v0 = Z[j][i], v1 = Z[j][i + 1], v2 = Z[j + 1][i + 1], v3 = Z[j + 1][i];
      if (isNaN(v0) || isNaN(v1) || isNaN(v2) || isNaN(v3)) continue;
      const pts = [];
      if ((v0 >= L) !== (v1 >= L)) { const tA = (L - v0) / (v1 - v0); pts.push([gx[i] + tA * (gx[i + 1] - gx[i]), gy[j]]); }
      if ((v1 >= L) !== (v2 >= L)) { const tA = (L - v1) / (v2 - v1); pts.push([gx[i + 1], gy[j] + tA * (gy[j + 1] - gy[j])]); }
      if ((v3 >= L) !== (v2 >= L)) { const tA = (L - v3) / (v2 - v3); pts.push([gx[i] + tA * (gx[i + 1] - gx[i]), gy[j + 1]]); }
      if ((v0 >= L) !== (v3 >= L)) { const tA = (L - v0) / (v3 - v0); pts.push([gx[i], gy[j] + tA * (gy[j + 1] - gy[j])]); }
      if (pts.length === 2) contours.push({ p1: pts[0], p2: pts[1], col, lw });
      else if (pts.length === 4) {
        contours.push({ p1: pts[0], p2: pts[1], col, lw });
        contours.push({ p1: pts[2], p2: pts[3], col, lw });
      }
    }
  }
}

// --- Mean great circle per feature type (planar orientation) ---------------
const meanCircles = poleSeries.map((s) => ({ points: greatCircleArc(s.mean), color: s.color }));

// --- Init & render ----------------------------------------------------------
const chart = echarts.init(document.getElementById("container"));
chart.on("finished", () => { window.__anyplotReady = true; });

const AX = { type: "value", min: -1.18, max: 1.18, show: false };

// custom-series renderers (silent background layers)
function polylineChildren(lines, styleFn) {
  return (params, api) => ({
    type: "group",
    silent: true,
    children: lines.map((ln, idx) => ({
      type: "polyline",
      shape: { points: ln.points.map((p) => api.coord(p)) },
      style: { stroke: ln.color, lineWidth: ln.lw, fill: "none", lineCap: "round" },
      ...(styleFn ? styleFn(idx) : {}),
    })),
  });
}

const netRender = (params, api) => {
  const children = [];
  // primitive circle
  children.push({ type: "polyline", silent: true,
    shape: { points: primitive.map((p) => api.coord(p)) },
    style: { stroke: inkSoft, lineWidth: 2.4, fill: "none" } });
  // net meridians + small circles
  for (const ln of netLines) {
    children.push({ type: "polyline", silent: true,
      shape: { points: ln.map((p) => api.coord(p)) },
      style: { stroke: grid, lineWidth: 1, fill: "none" } });
  }
  // perimeter ticks
  for (const tk of ticks) {
    children.push({ type: "line", silent: true,
      shape: { x1: api.coord(tk[0])[0], y1: api.coord(tk[0])[1], x2: api.coord(tk[1])[0], y2: api.coord(tk[1])[1] },
      style: { stroke: inkSoft, lineWidth: 1.6 } });
  }
  // cardinal labels
  for (const cd of cardinals) {
    const pos = api.coord([1.12 * Math.sin(cd.a * DEG), 1.12 * Math.cos(cd.a * DEG)]);
    children.push({ type: "text", silent: true,
      style: { text: cd.t, x: pos[0], y: pos[1], fill: cd.t === "N" ? ink : inkSoft,
        fontSize: cd.t === "N" ? 26 : 20, fontWeight: cd.t === "N" ? "bold" : "normal",
        align: "center", verticalAlign: "middle", fontFamily: "sans-serif" } });
  }
  // North arrow (small triangle above N)
  const nb = api.coord([0, 1.04]), nt = api.coord([0, 1.10]);
  children.push({ type: "polygon", silent: true,
    shape: { points: [[nt[0], nt[1]], [nb[0] - 8, nb[1]], [nb[0] + 8, nb[1]]] },
    style: { fill: ink } });
  return { type: "group", children };
};

const option = {
  animation: false,
  backgroundColor: "transparent",
  color: t.palette,
  title: {
    text: "stereonet-equal-area · javascript · echarts · anyplot.ai",
    subtext: "Lower-hemisphere equal-area (Schmidt) net · poles to planes, Kamb density & mean great circles",
    left: "center", top: 18,
    textStyle: { color: ink, fontSize: 22, fontWeight: "bold" },
    subtextStyle: { color: inkSoft, fontSize: 15 },
  },
  legend: {
    data: SETS.map((s) => s.name),
    orient: "vertical", left: 36, top: 120,
    itemWidth: 20, itemHeight: 14, itemGap: 14,
    icon: "circle",
    textStyle: { color: ink, fontSize: 17 },
  },
  grid: { left: 140, right: 140, top: 160, bottom: 120 },
  xAxis: AX,
  yAxis: AX,
  series: [
    // 1. equal-area net (background)
    { type: "custom", coordinateSystem: "cartesian2d", silent: true, z: 1,
      data: [0], renderItem: netRender },
    // 2. Kamb density contours (imprint_seq, low->high)
    { type: "custom", coordinateSystem: "cartesian2d", silent: true, z: 2,
      data: [0],
      renderItem: (params, api) => ({
        type: "group", silent: true,
        children: contours.map((c) => {
          const a = api.coord(c.p1), b = api.coord(c.p2);
          return { type: "line", silent: true,
            shape: { x1: a[0], y1: a[1], x2: b[0], y2: b[1] },
            style: { stroke: c.col, lineWidth: c.lw, opacity: 0.85 } };
        }),
      }) },
    // 3. mean great circles per feature type
    { type: "custom", coordinateSystem: "cartesian2d", silent: true, z: 3,
      data: [0],
      renderItem: (params, api) => ({
        type: "group", silent: true,
        children: meanCircles.map((mc) => ({
          type: "polyline",
          shape: { points: mc.points.map((p) => api.coord(p)) },
          style: { stroke: mc.color, lineWidth: 3, fill: "none", opacity: 0.9, lineCap: "round" },
        })),
      }) },
    // 4. poles to planes (points), one series per feature type -> legend
    ...poleSeries.map((s) => ({
      name: s.name, type: "scatter", coordinateSystem: "cartesian2d", z: 4,
      data: s.data, symbolSize: 14,
      itemStyle: { color: s.color, borderColor: t.pageBg, borderWidth: 1.2, opacity: 0.95 },
    })),
  ],
};

chart.setOption(option);
Runnable source as JSON, for any HTTP client: https://api.anyplot.ai/specs/stereonet-equal-area/echarts/code. Any spec id and library id listed in llms-full.txt fit the same URL shape; every URL below is complete and callable.
{
  "spec_id": "stereonet-equal-area",
  "language": "javascript",
  "library": "echarts",
  "page": "https://anyplot.ai/stereonet-equal-area/javascript/echarts",
  "hub": "https://anyplot.ai/stereonet-equal-area",
  "code_json": "https://api.anyplot.ai/specs/stereonet-equal-area/echarts/code",
  "spec_json": "https://api.anyplot.ai/specs/stereonet-equal-area",
  "render_light_png": "https://storage.googleapis.com/anyplot-images/plots/stereonet-equal-area/javascript/echarts/plot-light.png",
  "render_dark_png": "https://storage.googleapis.com/anyplot-images/plots/stereonet-equal-area/javascript/echarts/plot-dark.png",
  "interactive_light_html": "https://storage.googleapis.com/anyplot-images/plots/stereonet-equal-area/javascript/echarts/plot-light.html",
  "interactive_dark_html": "https://storage.googleapis.com/anyplot-images/plots/stereonet-equal-area/javascript/echarts/plot-dark.html",
  "quality_score": 90.0,
  "license": "MIT",
  "guide": "https://anyplot.ai/llms.txt"
}
Part of Structural Geology Stereonet (Equal-Area Projection) on anyplot.ai.