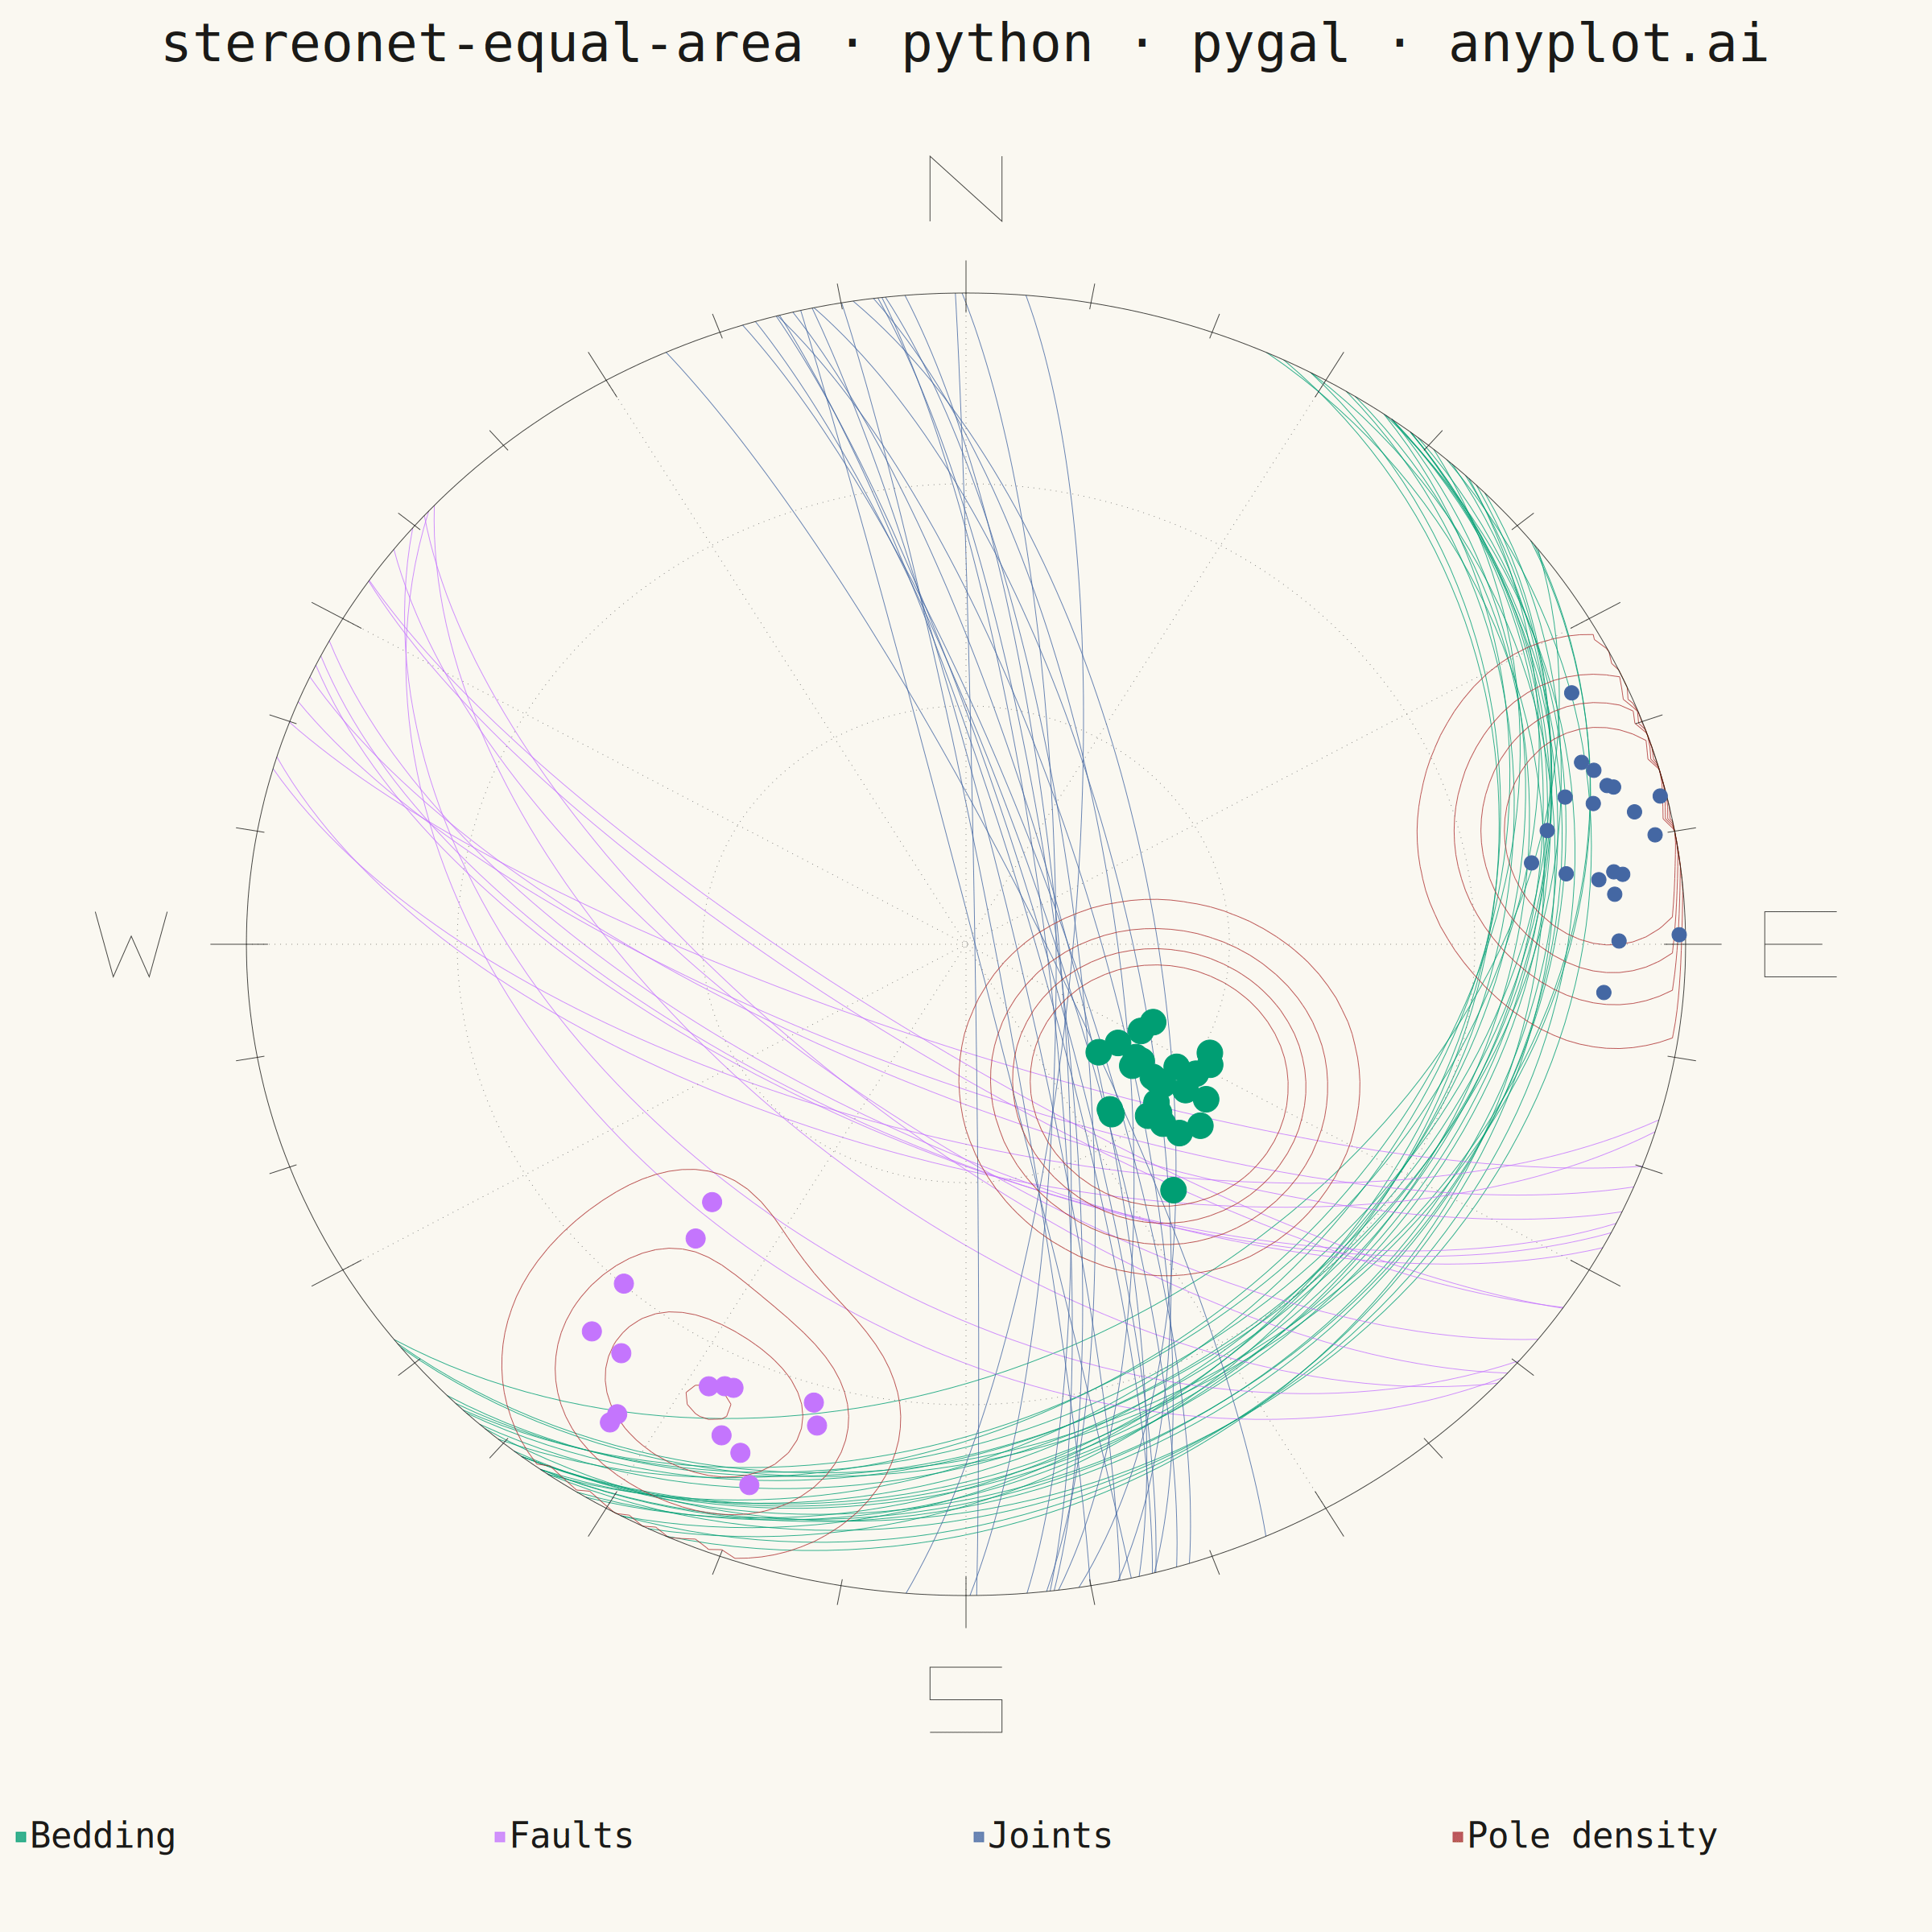
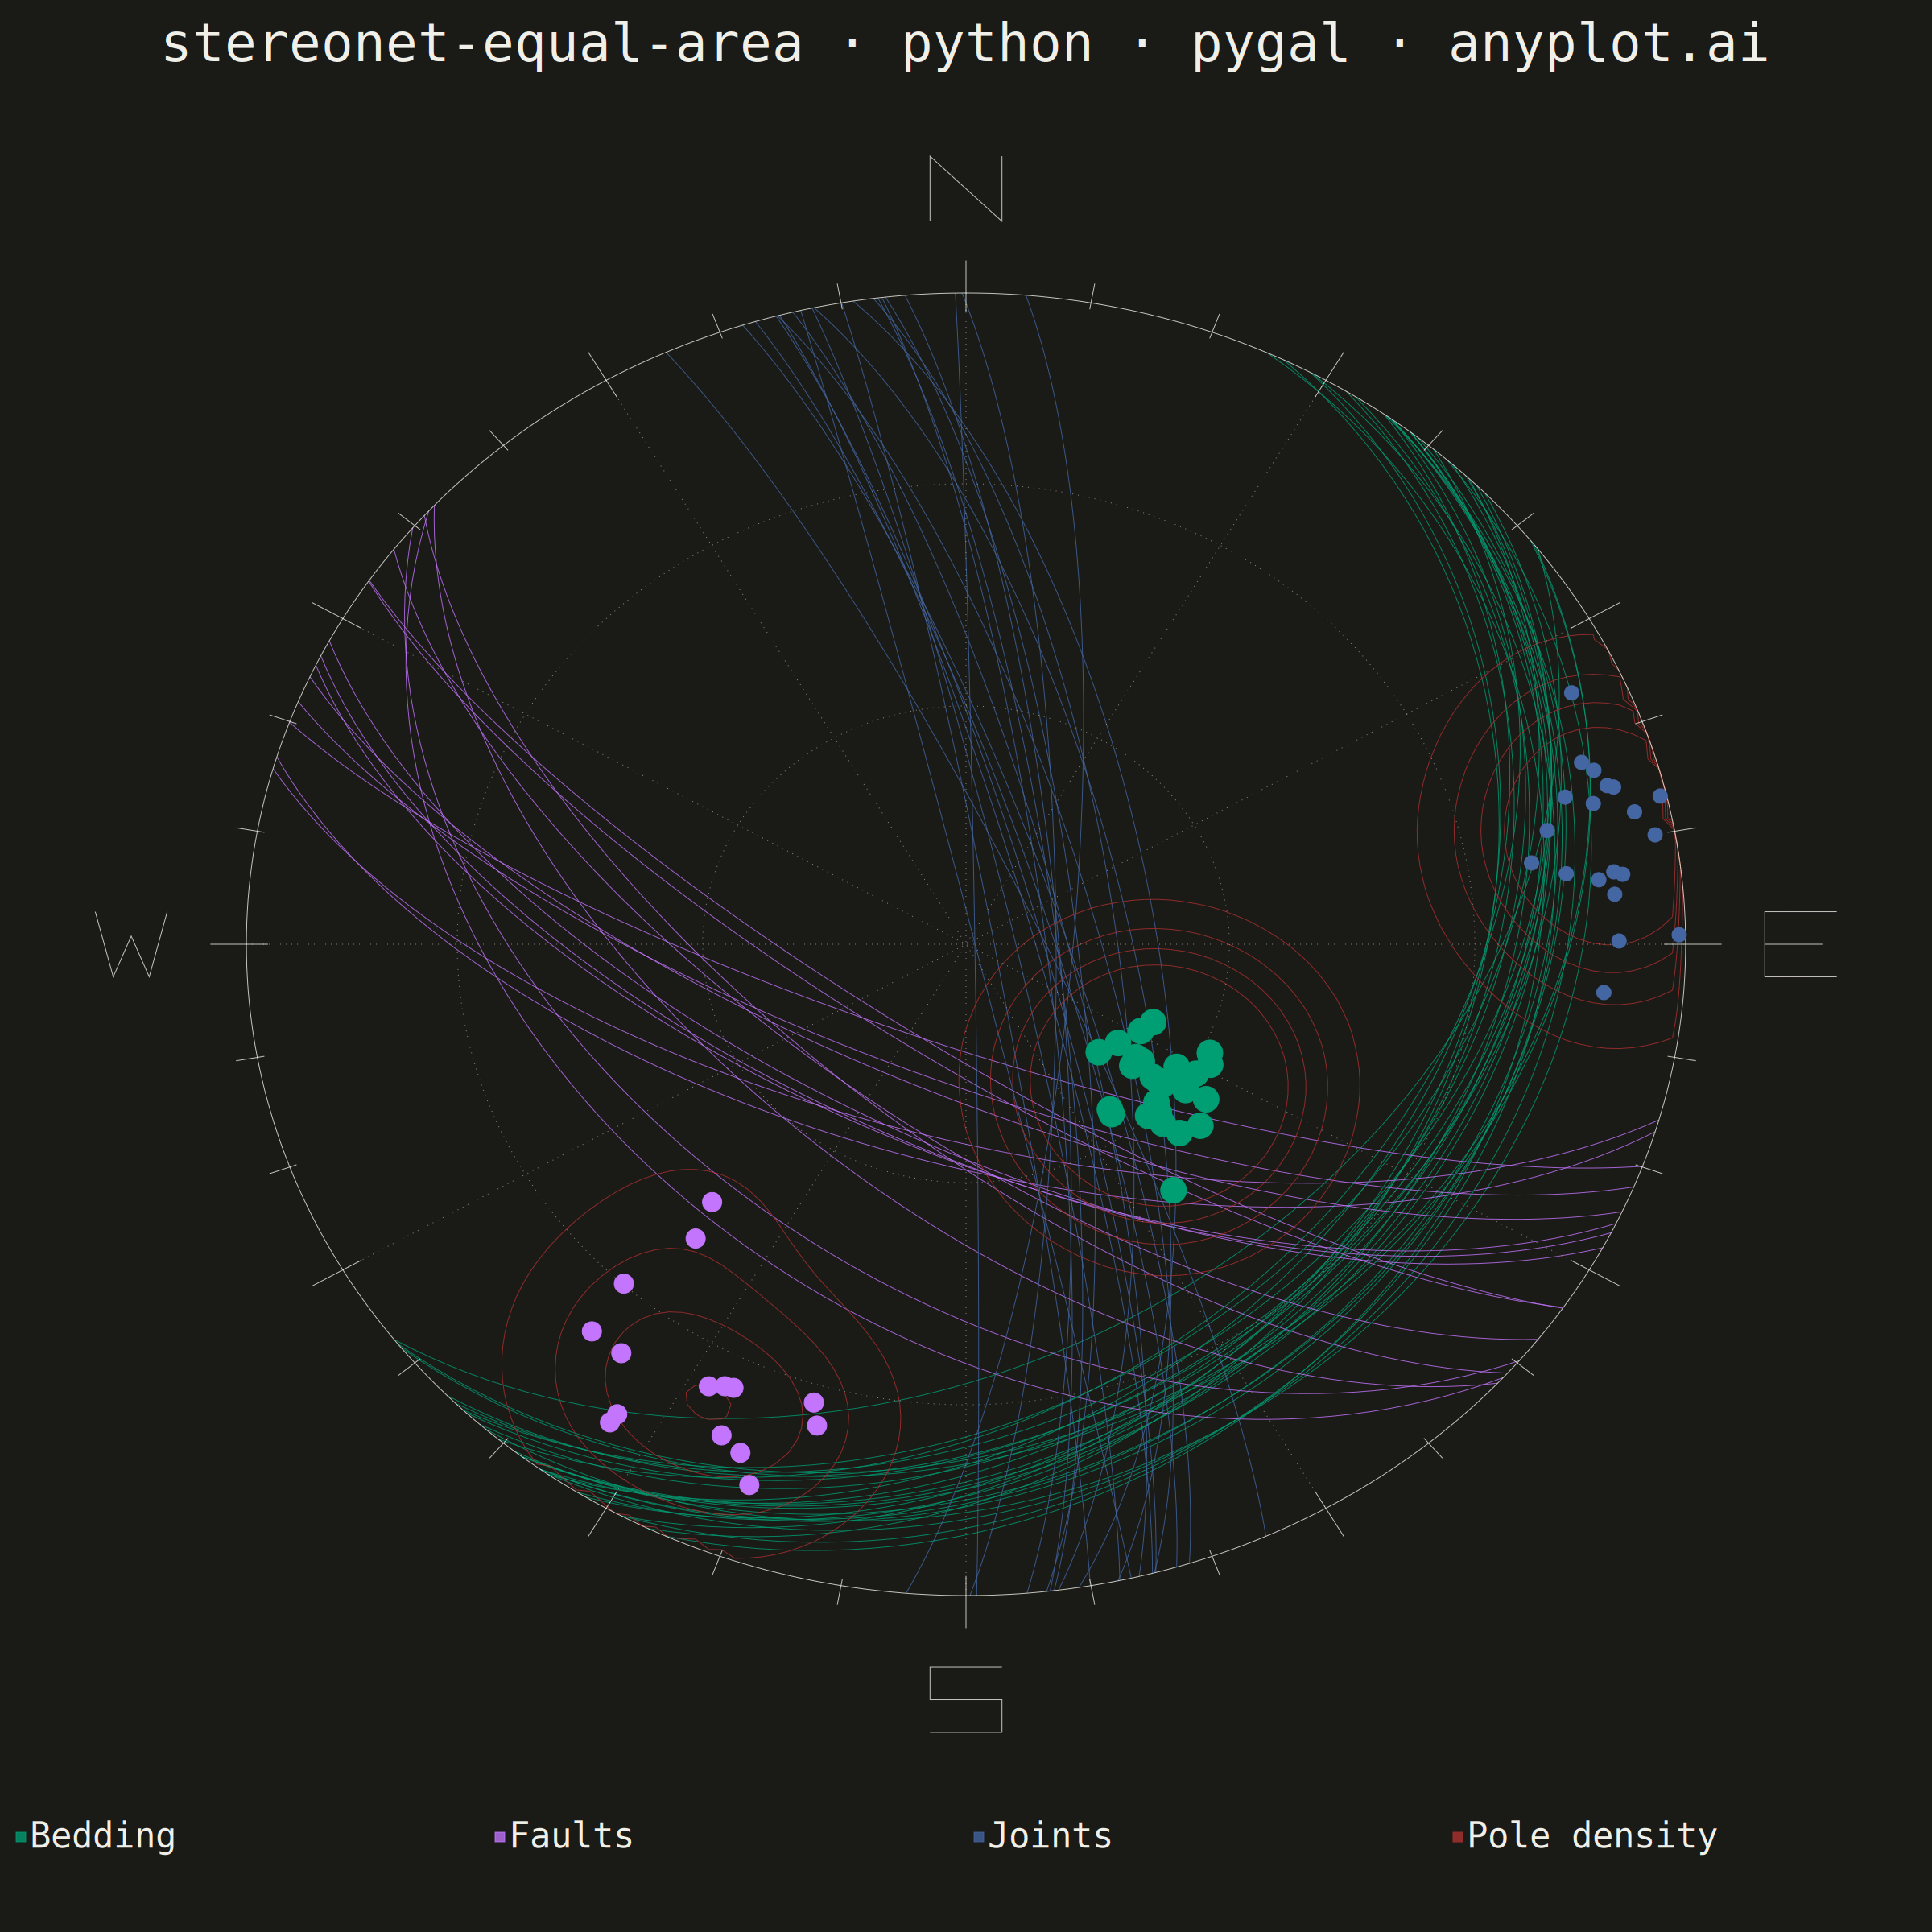
A Schmidt equal-area (lower-hemisphere) stereographic projection for plotting geological structural data. Great circles represent planar features (bedding, faults, joints) by their strike and dip, while poles to planes are plotted as points showing the orientation of the normal to each plane. Density contours highlight preferred orientations in clustered data. This is the standard projection used in structural geology for analyzing fabric elements and kinematic indicators.
""" anyplot.ai
stereonet-equal-area: Structural Geology Stereonet (Equal-Area Projection)
Library: pygal 3.1.0 | Python 3.13.13
Quality: 90/100 | Updated: 2026-06-16
"""

import os
import sys


# Remove this file's directory from sys.path so `import pygal` resolves to the
# installed package, not this script (which shares the same name).
_this_dir = os.path.dirname(os.path.abspath(__file__))
sys.path = [p for p in sys.path if os.path.abspath(p or ".") != _this_dir]

import numpy as np
import pygal
from pygal.style import Style


# Theme-adaptive chrome (Imprint palette) ------------------------------------
THEME = os.getenv("ANYPLOT_THEME", "light")
PAGE_BG = "#FAF8F1" if THEME == "light" else "#1A1A17"
INK = "#1A1A17" if THEME == "light" else "#F0EFE8"
INK_SOFT = "#4A4A44" if THEME == "light" else "#B8B7B0"
INK_MUTED = "#6B6A63" if THEME == "light" else "#A8A79F"

# Imprint categorical palette positions used here:
BEDDING = "#009E73"  # brand green — ALWAYS first series
FAULT = "#C475FD"  # lavender
JOINT = "#4467A3"  # blue
DENSITY = "#AE3030"  # matte red — pole-concentration "hotspot" emphasis

# Data - field measurements from a geological mapping campaign ----------------
np.random.seed(42)

# Bedding planes - consistent NE strike (~040 deg), moderate SE dip (~30 deg)
n_bedding = 25
bedding_strike = np.random.normal(40, 8, n_bedding) % 360
bedding_dip = np.clip(np.random.normal(30, 5, n_bedding), 5, 85)

# Fault planes - steeper, striking ESE (~120 deg), steep dip (~65 deg)
n_faults = 15
fault_strike = np.random.normal(120, 12, n_faults) % 360
fault_dip = np.clip(np.random.normal(65, 8, n_faults), 10, 89)

# Joint set - sub-vertical (~80 deg), striking roughly N-S (~350 deg)
n_joints = 20
joint_strike = np.random.normal(350, 10, n_joints) % 360
joint_dip = np.clip(np.random.normal(80, 6, n_joints), 15, 89)

# Equal-area (Schmidt net) lower-hemisphere projection.
# Pole to plane: trend = strike + 90 deg, plunge = 90 deg - dip.
# Equal-area radius for a line of plunge p: r = sqrt(2) * sin((90 - p) / 2).


def clip_to_circle(x, y):
    """Clip a point to the primitive circle (r <= 1)."""
    r = np.hypot(x, y)
    return (x / r, y / r) if r > 1.0 else (x, y)


# Great circles + poles for each feature set ---------------------------------
alphas = np.linspace(0, np.pi, 91)
feature_sets = [
    ("Bedding", bedding_strike, bedding_dip),
    ("Faults", fault_strike, fault_dip),
    ("Joints", joint_strike, joint_dip),
]

# Visual hierarchy: bedding primary (thickest), faults secondary, joints tertiary
gc_widths = {"Bedding": 3.0, "Faults": 2.2, "Joints": 1.6}
pole_sizes = {"Bedding": 16, "Faults": 12, "Joints": 9}

gc_series, pole_series = {}, {}
all_pole_x, all_pole_y = [], []

for name, strikes, dips in feature_sets:
    gc_data = []
    for s, d in zip(strikes, dips, strict=True):
        d_rad = np.radians(d)
        plunges = np.degrees(np.arcsin(np.sin(d_rad) * np.sin(alphas)))
        trends = s + np.degrees(np.arctan2(np.sin(alphas) * np.cos(d_rad), np.cos(alphas)))
        r = np.sqrt(2) * np.sin(np.radians((90 - plunges) / 2))
        x = r * np.sin(np.radians(trends))
        y = r * np.cos(np.radians(trends))
        if gc_data:
            gc_data.append(None)
        for xi, yi in zip(x, y, strict=True):
            cx, cy = clip_to_circle(float(xi), float(yi))
            gc_data.append((round(cx, 4), round(cy, 4)))
    gc_series[name] = gc_data

    # Poles to planes (normal to each plane)
    pole_trend = np.radians((strikes + 90) % 360)
    pole_r = np.sqrt(2) * np.sin(np.radians(dips / 2))
    px = pole_r * np.sin(pole_trend)
    py = pole_r * np.cos(pole_trend)
    pole_series[name] = [(round(float(a), 4), round(float(b), 4)) for a, b in zip(px, py, strict=True)]
    all_pole_x.extend(px)
    all_pole_y.extend(py)

# Pole-density estimate + contour extraction ---------------------------------
# Gaussian density on the projected poles. pygal has no contour primitive, so a
# small marching-squares pass emits the iso-level crossing segments directly —
# pygal's allow_interruptions then strings the disconnected segments together.
all_pole_x = np.array(all_pole_x)
all_pole_y = np.array(all_pole_y)

grid_res = 110
gx = gy = np.linspace(-1, 1, grid_res)
gxx, gyy = np.meshgrid(gx, gy)
sigma = 0.12
density = np.zeros_like(gxx)
for px, py in zip(all_pole_x, all_pole_y, strict=True):
    density += np.exp(-((gxx - px) ** 2 + (gyy - py) ** 2) / (2 * sigma**2))
density[gxx**2 + gyy**2 > 1.0] = 0.0  # mask outside the primitive circle


def contour_segments(d, level):
    """Marching-squares iso-line segments at `level` (no polyline chaining)."""
    segs = []
    corners = ((0, 1), (1, 2), (2, 3), (3, 0))  # cell edges as corner index pairs
    for j in range(d.shape[0] - 1):
        for i in range(d.shape[1] - 1):
            v = (d[j, i], d[j, i + 1], d[j + 1, i + 1], d[j + 1, i])
            above = tuple(val >= level for val in v)
            if all(above) or not any(above):
                continue
            pos = ((gx[i], gy[j]), (gx[i + 1], gy[j]), (gx[i + 1], gy[j + 1]), (gx[i], gy[j + 1]))
            cross = {}
            for a, b in corners:
                if above[a] != above[b]:
                    t = 0.5 if abs(v[b] - v[a]) < 1e-12 else (level - v[a]) / (v[b] - v[a])
                    cross[(a, b)] = (pos[a][0] + t * (pos[b][0] - pos[a][0]), pos[a][1] + t * (pos[b][1] - pos[a][1]))
            pts = list(cross.values())
            if len(pts) == 2:
                segs.append((pts[0], pts[1]))
            elif len(pts) == 4:  # saddle - pair edges by the cell-centre value
                e = cross
                pairs = [(0, 1), (2, 3)] if sum(v) / 4 >= level else [(0, 3), (1, 2)]
                keys = list(e)
                segs += [(e[keys[a]], e[keys[b]]) for a, b in pairs]
    return segs


contour_data = []
for lvl in (lvl for lvl in (2.0, 4.0, 6.0, 8.0) if lvl < density.max()):
    for p0, p1 in contour_segments(density, lvl):
        if contour_data:
            contour_data.append(None)
        x0, y0 = clip_to_circle(*p0)
        x1, y1 = clip_to_circle(*p1)
        contour_data.append((round(x0, 4), round(y0, 4)))
        contour_data.append((round(x1, 4), round(y1, 4)))

# Equal-area net grid (subtle) -----------------------------------------------
grid_data = []
for dip_grid in (30, 60):  # small circles at 30 / 60 deg dip
    rg = np.sqrt(2) * np.sin(np.radians(dip_grid / 2))
    for t in np.linspace(0, 2 * np.pi, 181):
        grid_data.append((round(float(rg * np.sin(t)), 4), round(float(rg * np.cos(t)), 4)))
    grid_data.append(None)
for az in range(0, 180, 30):  # diametral lines every 30 deg
    rad = np.radians(az)
    grid_data.append((round(-np.sin(rad), 4), round(-np.cos(rad), 4)))
    grid_data.append((round(np.sin(rad), 4), round(np.cos(rad), 4)))
    grid_data.append(None)

# Primitive circle + perimeter ticks + cardinal letters ----------------------
boundary_data = []
for t in np.linspace(0, 2 * np.pi, 361):  # primitive circle
    boundary_data.append((round(float(np.sin(t)), 4), round(float(np.cos(t)), 4)))
boundary_data.append(None)
for deg in range(0, 360, 10):  # ticks every 10 deg
    rad = np.radians(deg)
    inner, outer = (0.97, 1.05) if deg % 30 == 0 else (0.99, 1.03)
    boundary_data.append((round(inner * np.sin(rad), 4), round(inner * np.cos(rad), 4)))
    boundary_data.append((round(outer * np.sin(rad), 4), round(outer * np.cos(rad), 4)))
    boundary_data.append(None)

# Cardinal labels (N/E/S/W) drawn as polyline letters just outside the circle
LETTER_STROKES = {
    "N": [[(-1, -1), (-1, 1), (1, -1), (1, 1)]],
    "E": [[(1, 1), (-1, 1), (-1, -1), (1, -1)], [(-1, 0), (0.6, 0)]],
    "S": [[(1, 1), (-1, 1), (-1, 0), (1, 0), (1, -1), (-1, -1)]],
    "W": [[(-1, 1), (-0.5, -1), (0, 0.25), (0.5, -1), (1, 1)]],
}


def add_letter(letter, cx, cy, s=0.05):
    for stroke in LETTER_STROKES[letter]:
        if boundary_data:
            boundary_data.append(None)
        for lx, ly in stroke:
            boundary_data.append((round(cx + lx * s, 4), round(cy + ly * s, 4)))


add_letter("N", 0.0, 1.16)
add_letter("E", 1.16, 0.0)
add_letter("S", 0.0, -1.16)
add_letter("W", -1.16, 0.0)

# Style - colors aligned to series add-order (poles reuse the feature color) --
custom_style = Style(
    background=PAGE_BG,
    plot_background=PAGE_BG,
    foreground=INK,
    foreground_strong=INK,
    foreground_subtle=INK_SOFT,
    colors=(BEDDING, BEDDING, FAULT, FAULT, JOINT, JOINT, DENSITY, INK_MUTED, INK),
    title_font_size=66,
    label_font_size=56,
    major_label_font_size=44,
    legend_font_size=44,
    value_font_size=36,
    opacity=0.78,
    opacity_hover=0.95,
)

chart = pygal.XY(
    width=2400,
    height=2400,
    style=custom_style,
    title="stereonet-equal-area · python · pygal · anyplot.ai",
    show_legend=True,
    legend_at_bottom=True,
    legend_at_bottom_columns=4,
    show_x_labels=False,
    show_y_labels=False,
    show_x_guides=False,
    show_y_guides=False,
    xrange=(-1.28, 1.28),
    range=(-1.28, 1.28),
    dots_size=0,
    allow_interruptions=True,
    margin_top=20,
    margin_bottom=30,
    margin_left=10,
    margin_right=10,
)

# Great circles (planes) - legend entry per feature; line weight = hierarchy
# Poles (dots) reuse the feature color but carry title=None so the legend stays
# to four clean keys (Bedding, Faults, Joints, Pole density).
for name in ("Bedding", "Faults", "Joints"):
    color = {"Bedding": BEDDING, "Faults": FAULT, "Joints": JOINT}[name]
    chart.add(name, gc_series[name], stroke=True, show_dots=False, stroke_style={"width": gc_widths[name]})
    chart.add(None, pole_series[name], stroke=False, show_dots=True, dots_size=pole_sizes[name])

# Pole density contours - solid red, distinct from the dotted muted grid
chart.add("Pole density", contour_data, stroke=True, show_dots=False, stroke_style={"width": 2.2})

# Equal-area net grid (hidden from legend) - light, dotted, recedes
chart.add(None, grid_data, stroke=True, show_dots=False, stroke_style={"width": 1.0, "dasharray": "1,6"})

# Primitive circle + ticks + cardinal letters (hidden from legend)
chart.add(None, boundary_data, stroke=True, show_dots=False, stroke_style={"width": 2.6})

# Save (theme-suffixed PNG + interactive HTML) -------------------------------
chart.render_to_png(f"plot-{THEME}.png")
with open(f"plot-{THEME}.html", "wb") as f:
    f.write(chart.render())
Runnable source as JSON, for any HTTP client: https://api.anyplot.ai/specs/stereonet-equal-area/pygal/code. Any spec id and library id listed in llms-full.txt fit the same URL shape; every URL below is complete and callable.
{
  "spec_id": "stereonet-equal-area",
  "language": "python",
  "library": "pygal",
  "page": "https://anyplot.ai/stereonet-equal-area/python/pygal",
  "hub": "https://anyplot.ai/stereonet-equal-area",
  "code_json": "https://api.anyplot.ai/specs/stereonet-equal-area/pygal/code",
  "spec_json": "https://api.anyplot.ai/specs/stereonet-equal-area",
  "render_light_png": "https://storage.googleapis.com/anyplot-images/plots/stereonet-equal-area/python/pygal/plot-light.png",
  "render_dark_png": "https://storage.googleapis.com/anyplot-images/plots/stereonet-equal-area/python/pygal/plot-dark.png",
  "interactive_light_html": "https://storage.googleapis.com/anyplot-images/plots/stereonet-equal-area/python/pygal/plot-light.html",
  "interactive_dark_html": "https://storage.googleapis.com/anyplot-images/plots/stereonet-equal-area/python/pygal/plot-dark.html",
  "quality_score": 90.0,
  "license": "MIT",
  "guide": "https://anyplot.ai/llms.txt"
}
Part of Structural Geology Stereonet (Equal-Area Projection) on anyplot.ai.