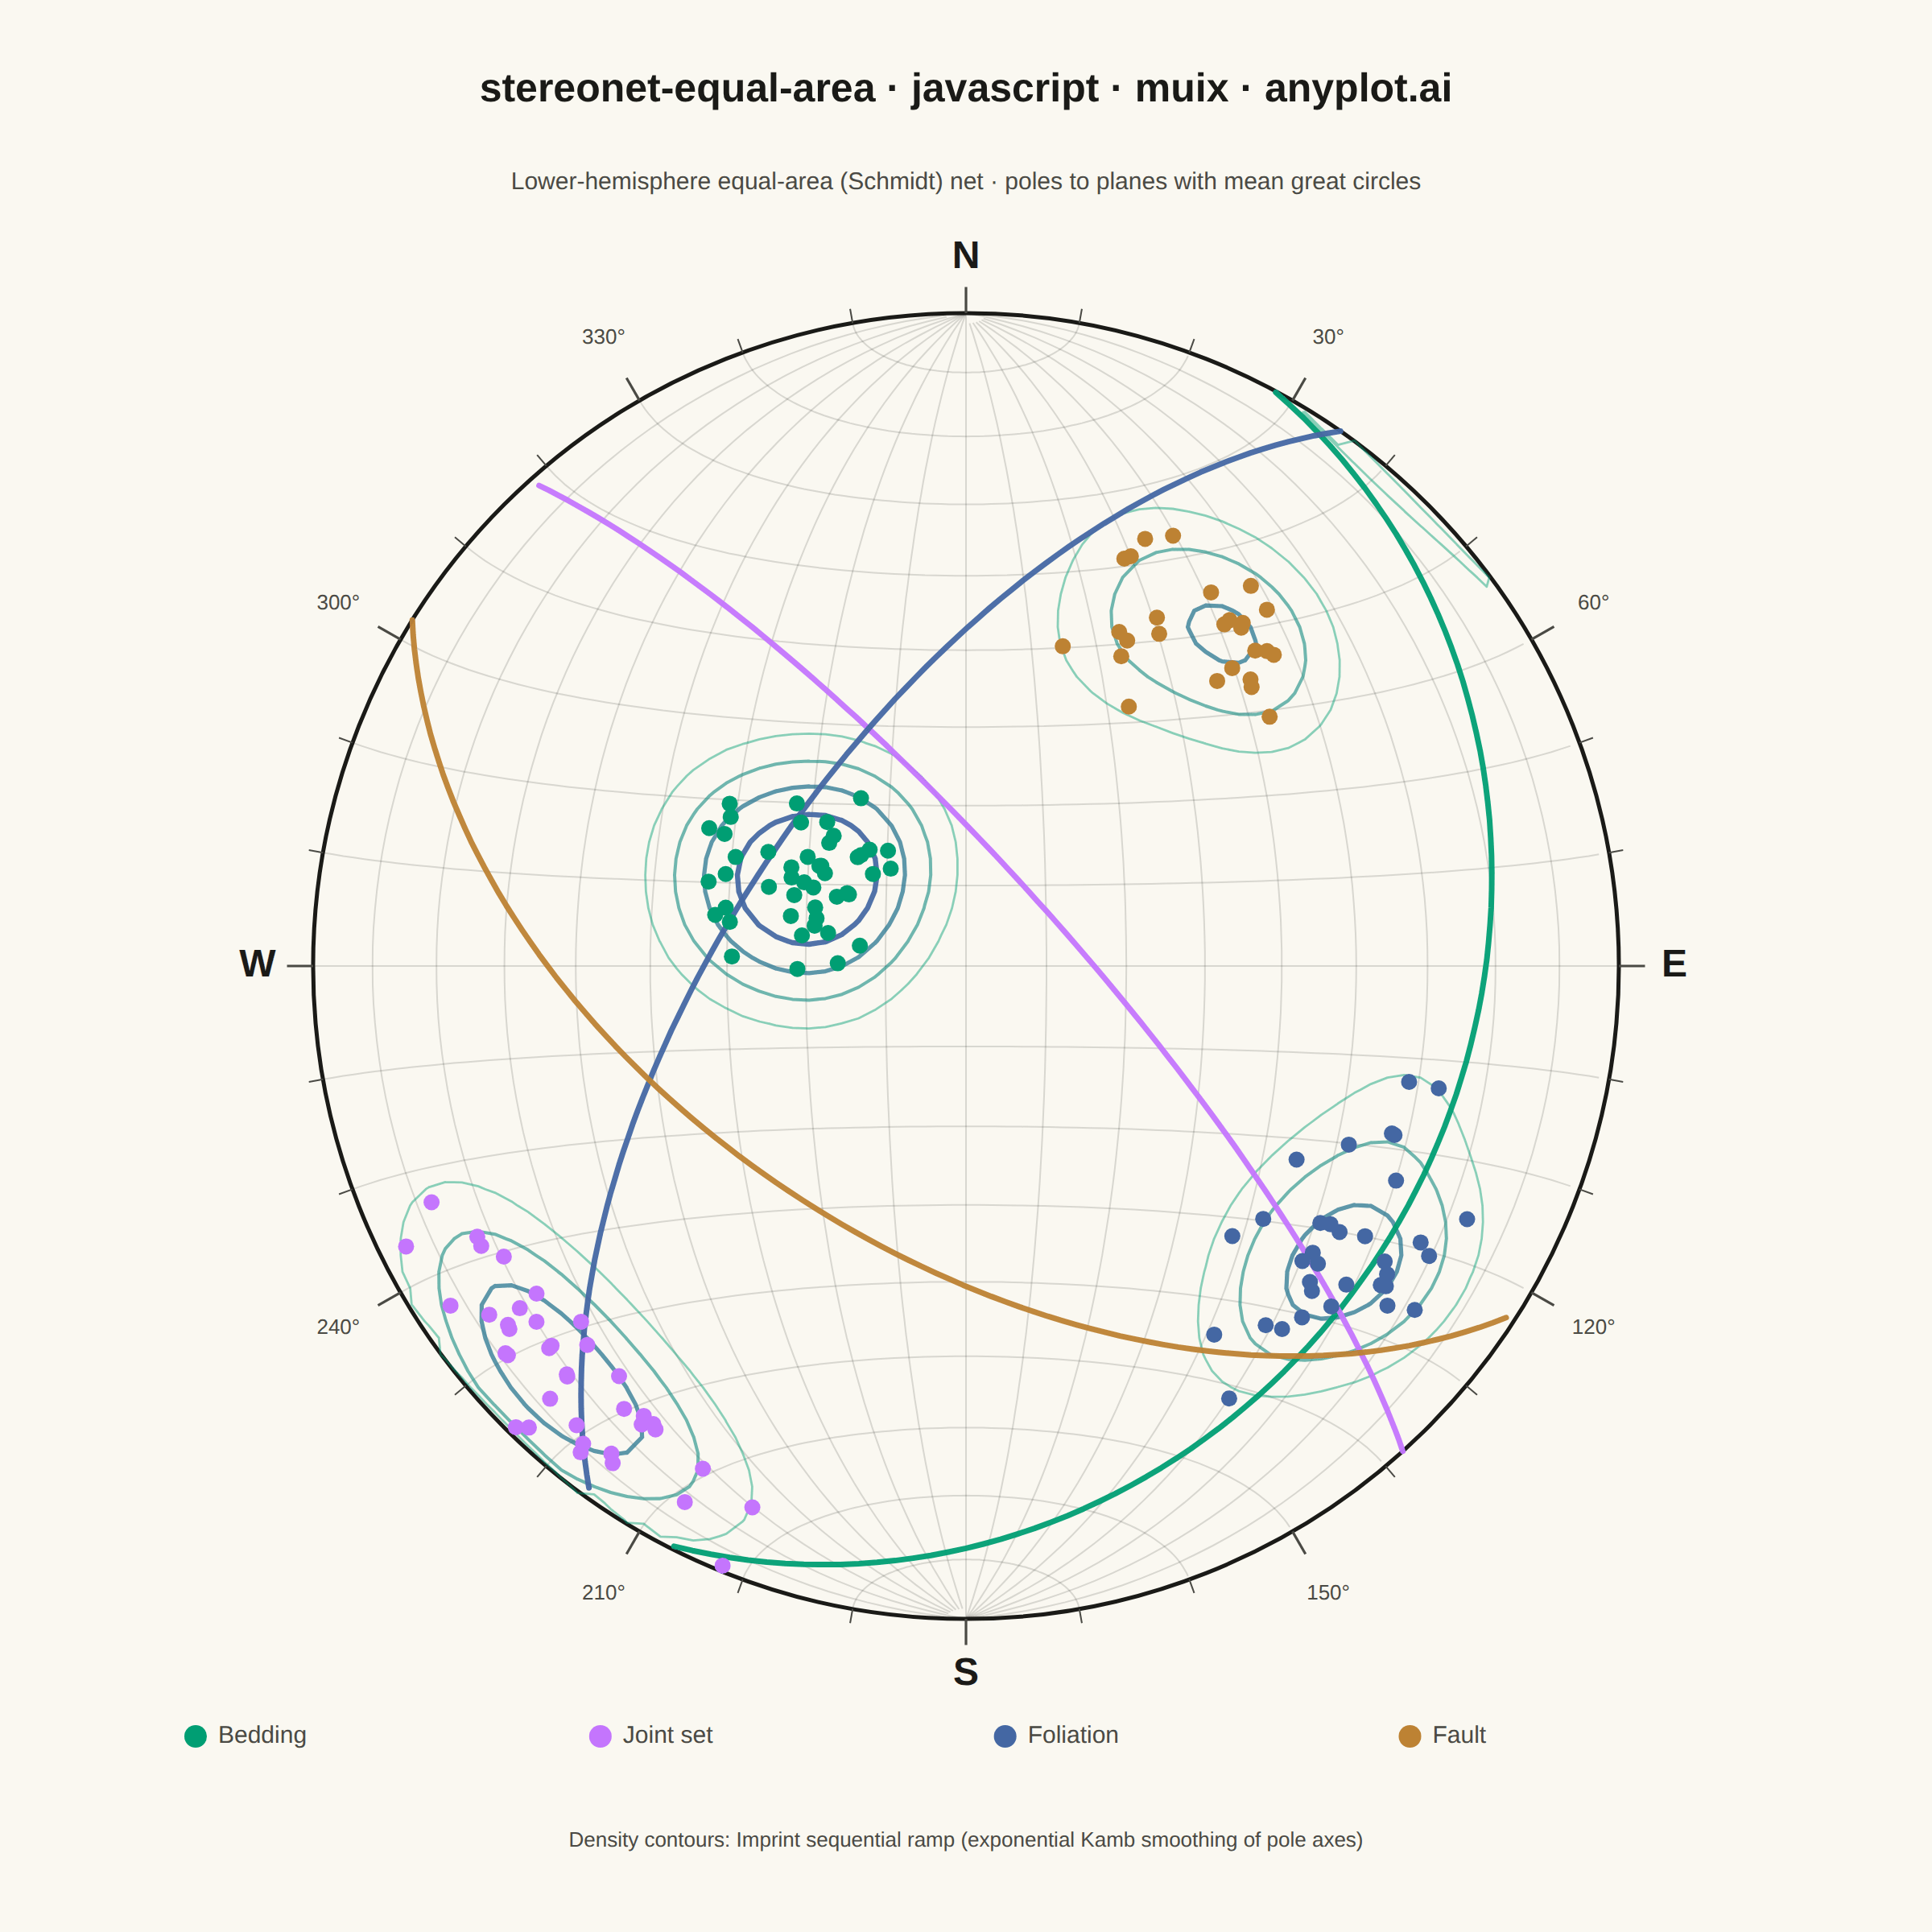
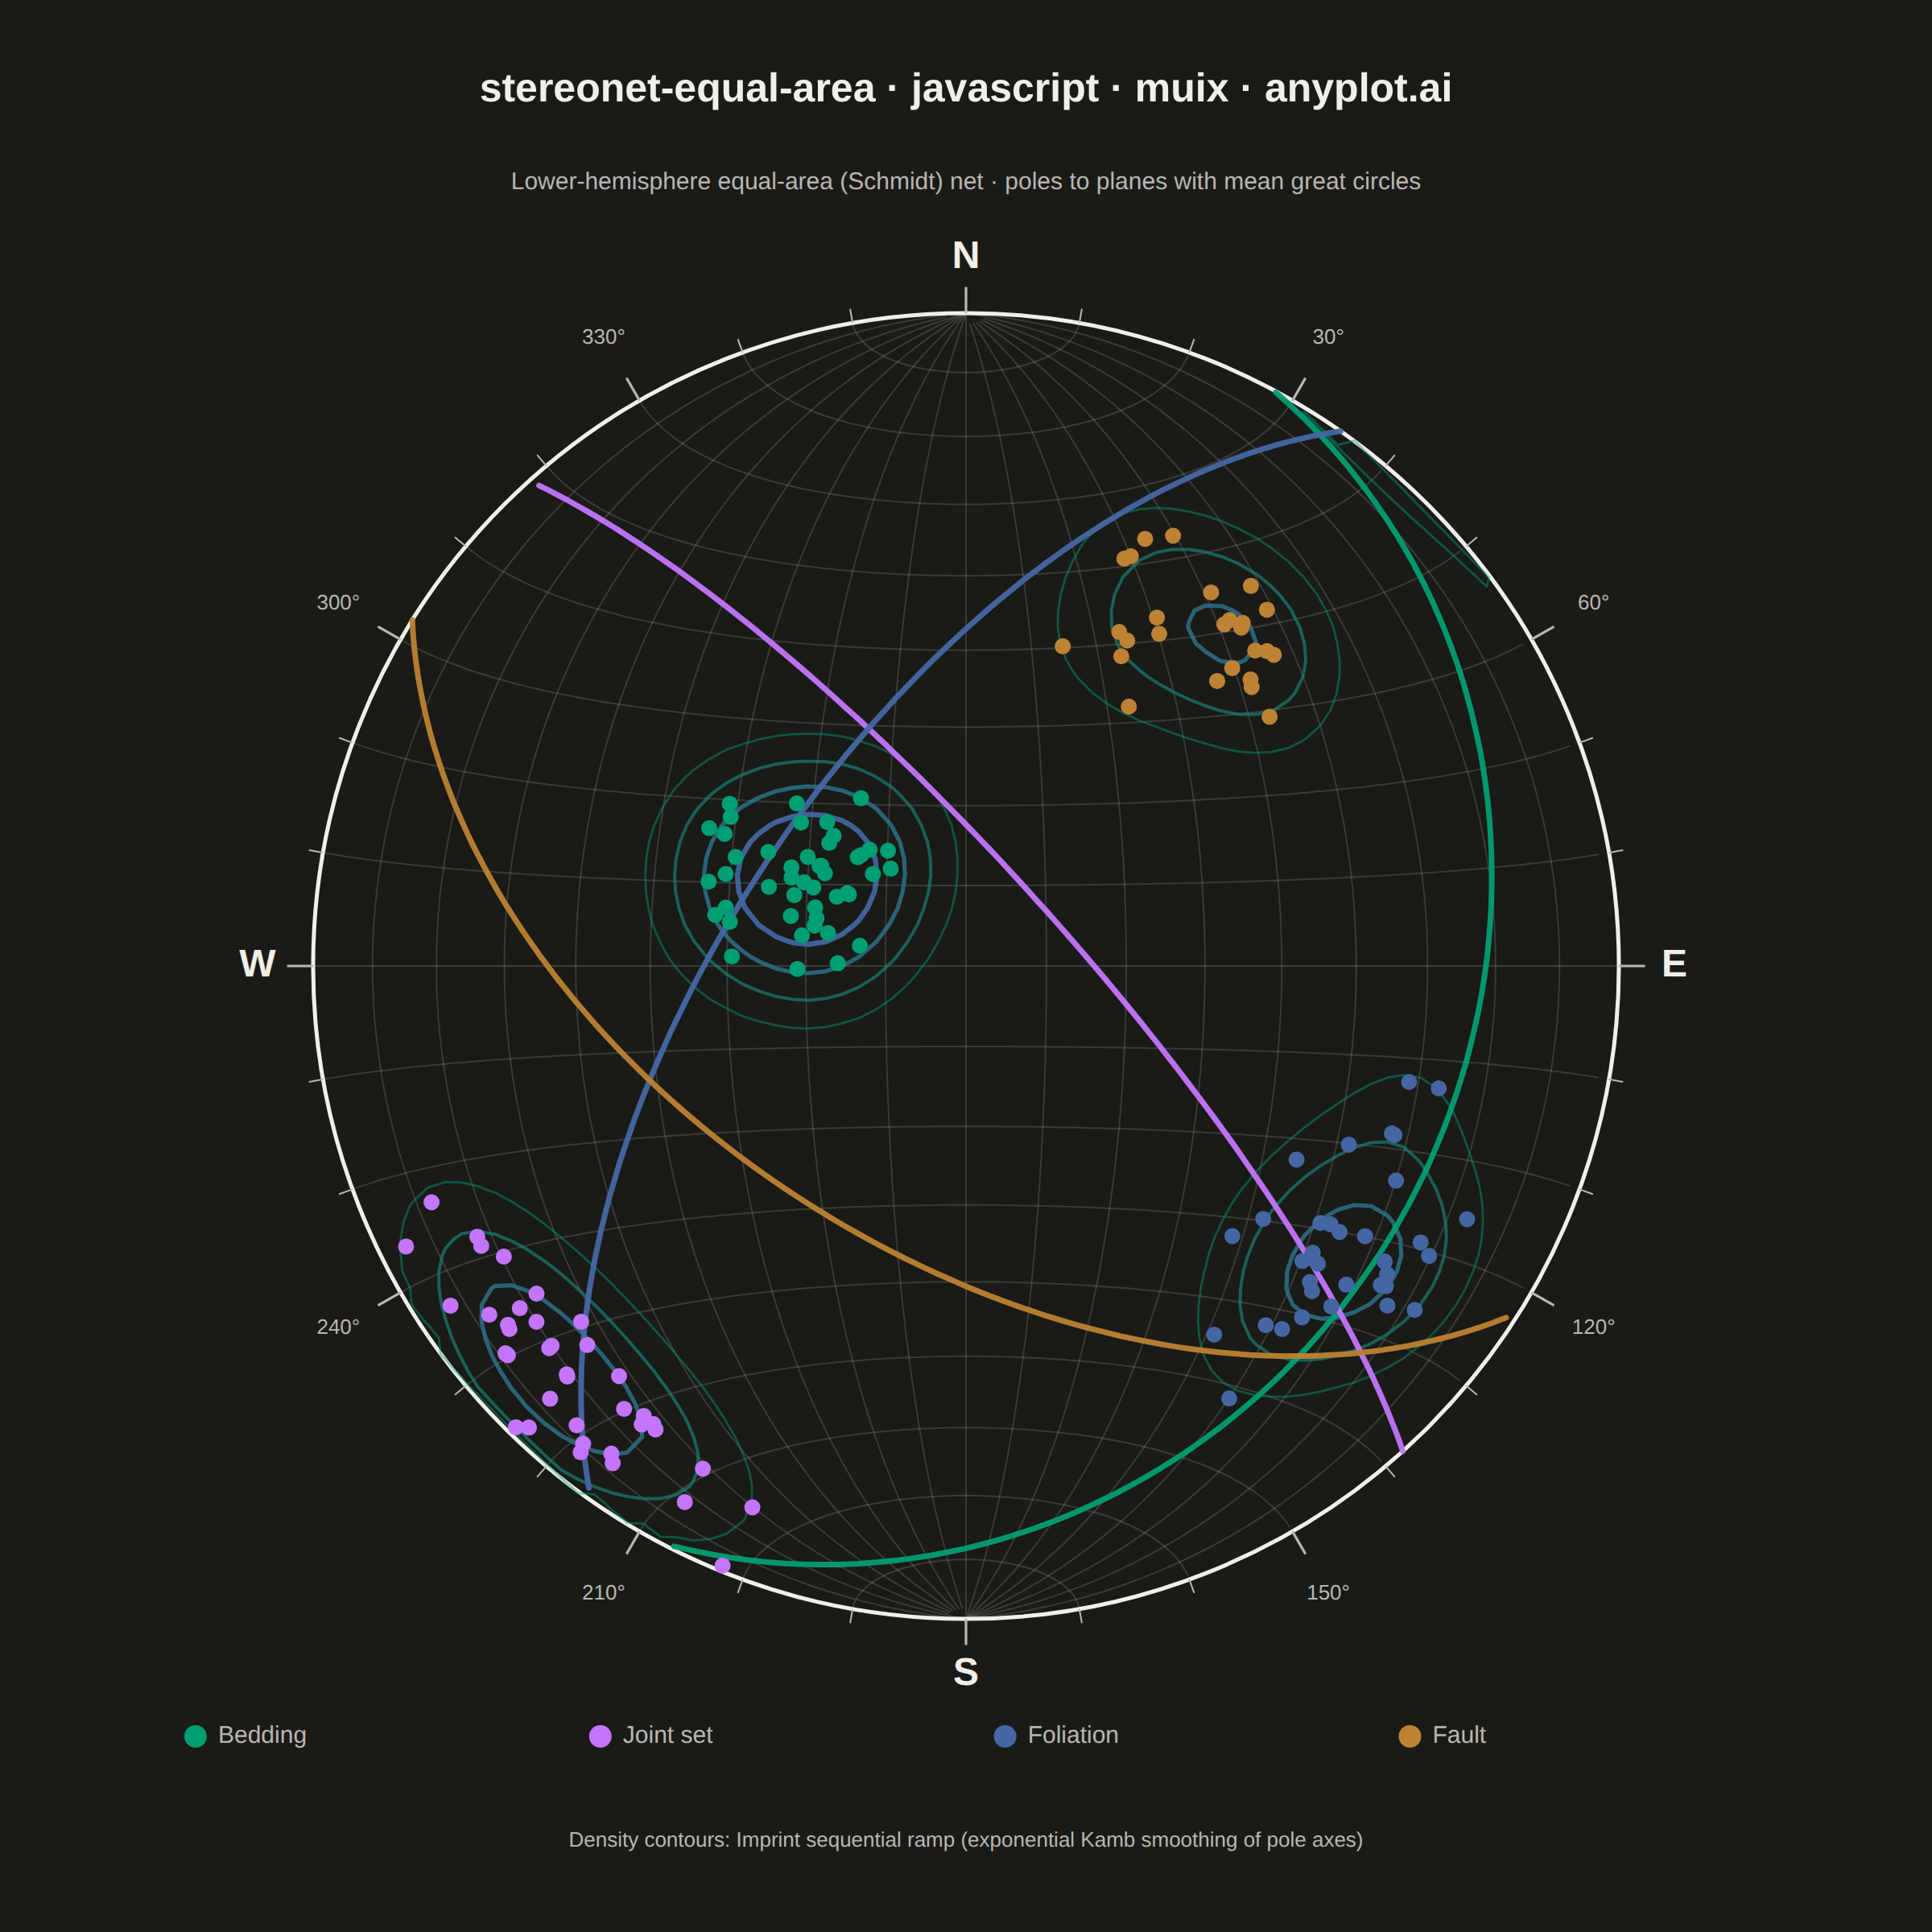
A Schmidt equal-area (lower-hemisphere) stereographic projection for plotting geological structural data. Great circles represent planar features (bedding, faults, joints) by their strike and dip, while poles to planes are plotted as points showing the orientation of the normal to each plane. Density contours highlight preferred orientations in clustered data. This is the standard projection used in structural geology for analyzing fabric elements and kinematic indicators.
// anyplot.ai
// stereonet-equal-area: Structural Geology Stereonet (Equal-Area Projection)
// Library: muix 7.29.1 | JavaScript 22.22.3
// Quality: 94/100 | Created: 2026-06-16
//# anyplot-orientation: square
// anyplot.ai
// stereonet-equal-area: Structural Geology Stereonet (Equal-Area Projection)
// Library: MUI X Charts | React | Node 22
// License: @mui/x-charts — MIT (community). Pro/Premium are out of scope.
// Quality: pending | Created: 2026-06-16
import { ChartContainer } from "@mui/x-charts/ChartContainer";
import { ScatterPlot } from "@mui/x-charts/ScatterChart";
import { ChartsTooltip } from "@mui/x-charts/ChartsTooltip";
import { useXScale, useYScale } from "@mui/x-charts/hooks";

const t = window.ANYPLOT_TOKENS;
const SIZE = window.ANYPLOT_SIZE;
const TITLE = "stereonet-equal-area · javascript · muix · anyplot.ai";

// Axis half-extent: the unit primitive circle (radius 1) sits centred, leaving
// top/bottom bands for the title and legend. Square drawing area + equal domains
// keep the projection perfectly circular.
const R = 1.45;

// --- Stereonet projection helpers ------------------------------------------
// Lower-hemisphere Lambert equal-area (Schmidt) net. A line of plunge p (from
// horizontal) and trend a (clockwise from North) maps to polar radius
// r = √2·sin((90°−p)/2), normalised so the horizon (p=0) lands on the circle.
function projectVec(n, e, d) {
  // Force the direction into the lower hemisphere (poles/lines are undirected).
  if (d < 0) {
    n = -n;
    e = -e;
    d = -d;
  }
  const plunge = Math.asin(Math.max(-1, Math.min(1, d)));
  const trend = Math.atan2(e, n);
  const theta = Math.PI / 2 - plunge; // colatitude from the downward vertical
  const r = Math.SQRT2 * Math.sin(theta / 2);
  return { x: r * Math.sin(trend), y: r * Math.cos(trend) };
}

// Pole (normal) to a plane given its dip and dip direction.
function poleVec(dipDeg, dipDirDeg) {
  const pl = ((90 - dipDeg) * Math.PI) / 180;
  const tr = ((dipDirDeg + 180) * Math.PI) / 180;
  return {
    n: Math.cos(pl) * Math.cos(tr),
    e: Math.cos(pl) * Math.sin(tr),
    d: Math.sin(pl),
  };
}

function norm3(v) {
  const m = Math.hypot(v[0], v[1], v[2]) || 1;
  return [v[0] / m, v[1] / m, v[2] / m];
}
function cross3(a, b) {
  return [
    a[1] * b[2] - a[2] * b[1],
    a[2] * b[0] - a[0] * b[2],
    a[0] * b[1] - a[1] * b[0],
  ];
}

// Great circle (the planar feature itself) as polyline segments, split where the
// arc wraps across the primitive circle so the path never draws a stray chord.
function greatCirclePath(pole) {
  const P = norm3([pole.n, pole.e, pole.d]);
  const seed = Math.abs(P[2]) < 0.9 ? [0, 0, 1] : [0, 1, 0];
  const u = norm3(cross3(P, seed));
  const v = cross3(P, u);
  const segs = [];
  let cur = [];
  let prev = null;
  const STEPS = 200;
  for (let i = 0; i <= STEPS; i++) {
    const phi = (i / STEPS) * 2 * Math.PI;
    const cphi = Math.cos(phi);
    const sphi = Math.sin(phi);
    const c = [
      cphi * u[0] + sphi * v[0],
      cphi * u[1] + sphi * v[1],
      cphi * u[2] + sphi * v[2],
    ];
    const pt = projectVec(c[0], c[1], c[2]);
    if (prev && Math.hypot(pt.x - prev.x, pt.y - prev.y) > 0.25) {
      if (cur.length > 1) segs.push(cur);
      cur = [];
    }
    cur.push(pt);
    prev = pt;
  }
  if (cur.length > 1) segs.push(cur);
  return segs;
}

// Small circle (a cone of fixed half-angle about an axis) — used for the net's
// reference graticule. Only the lower-hemisphere portion is kept.
function smallCirclePath(axis, beta) {
  const A = norm3(axis);
  const seed = Math.abs(A[2]) < 0.9 ? [0, 0, 1] : [0, 1, 0];
  const e1 = norm3(cross3(A, seed));
  const e2 = cross3(A, e1);
  const cb = Math.cos(beta);
  const sb = Math.sin(beta);
  const segs = [];
  let cur = [];
  let prev = null;
  const STEPS = 200;
  for (let i = 0; i <= STEPS; i++) {
    const phi = (i / STEPS) * 2 * Math.PI;
    const cphi = Math.cos(phi);
    const sphi = Math.sin(phi);
    const c = [
      cb * A[0] + sb * (cphi * e1[0] + sphi * e2[0]),
      cb * A[1] + sb * (cphi * e1[1] + sphi * e2[1]),
      cb * A[2] + sb * (cphi * e1[2] + sphi * e2[2]),
    ];
    if (c[2] < 0) {
      if (cur.length > 1) segs.push(cur);
      cur = [];
      prev = null;
      continue;
    }
    const pt = projectVec(c[0], c[1], c[2]);
    if (prev && Math.hypot(pt.x - prev.x, pt.y - prev.y) > 0.25) {
      if (cur.length > 1) segs.push(cur);
      cur = [];
    }
    cur.push(pt);
    prev = pt;
  }
  if (cur.length > 1) segs.push(cur);
  return segs;
}

// --- Data: a geological mapping campaign (deterministic, in-memory) ---------
// Four fabric elements, each a clustered orientation population. Colours follow
// the Imprint categorical order (Bedding is brand green, position 1).
let seed = 20260616 >>> 0;
function rand() {
  seed = (1664525 * seed + 1013904223) >>> 0;
  return seed / 4294967296;
}
function randn() {
  let u = 0;
  let v = 0;
  while (u === 0) u = rand();
  while (v === 0) v = rand();
  return Math.sqrt(-2 * Math.log(u)) * Math.cos(2 * Math.PI * v);
}

const FEATURES = [
  { name: "Bedding", color: t.palette[0], n: 46, dip: 24, dipDir: 118, sDip: 6, sDir: 14 },
  { name: "Joint set", color: t.palette[1], n: 38, dip: 78, dipDir: 48, sDip: 5, sDir: 10 },
  { name: "Foliation", color: t.palette[2], n: 34, dip: 62, dipDir: 305, sDip: 7, sDir: 12 },
  { name: "Fault", color: t.palette[3], n: 26, dip: 54, dipDir: 212, sDip: 6, sDir: 11 },
];

const SERIES = [];
const allPoles = [];
for (const f of FEATURES) {
  const data = [];
  for (let i = 0; i < f.n; i++) {
    const dip = Math.max(2, Math.min(89, f.dip + randn() * f.sDip));
    const dipDir = (((f.dipDir + randn() * f.sDir) % 360) + 360) % 360;
    allPoles.push({ dip, dipDir });
    const v = poleVec(dip, dipDir);
    const pt = projectVec(v.n, v.e, v.d);
    data.push({ x: pt.x, y: pt.y, id: `${f.name}-${i}` });
  }
  SERIES.push({ type: "scatter", label: f.name, color: f.color, markerSize: 5, data });
}

// Representative mean plane per feature, drawn as a great circle.
const MEAN_PLANES = FEATURES.map((f) => ({
  color: f.color,
  segs: greatCirclePath(poleVec(f.dip, f.dipDir)),
}));

// Equatorial Schmidt net graticule (meridians + small circles), kept subtle.
const NET = [];
for (let dip = 10; dip <= 80; dip += 10) {
  NET.push(greatCirclePath(poleVec(dip, 90)));
  NET.push(greatCirclePath(poleVec(dip, 270)));
}
for (let beta = 10; beta <= 80; beta += 10) {
  NET.push(smallCirclePath([1, 0, 0], (beta * Math.PI) / 180));
  NET.push(smallCirclePath([1, 0, 0], ((180 - beta) * Math.PI) / 180));
}

// --- Kamb-style density field + contour lines -------------------------------
// Exponential smoothing of pole axes over an equal-area grid, then marching
// squares for iso-density lines. Coloured with the Imprint sequential ramp.
const NX = 80;
const NY = 80;
const gx = (i) => -1.0 + (i * 2) / (NX - 1);
const gy = (j) => -1.0 + (j * 2) / (NY - 1);
const poleUnits = allPoles.map((p) => {
  const v = poleVec(p.dip, p.dipDir);
  return norm3([v.n, v.e, v.d]);
});
const K = 28;
const density = new Float64Array(NX * NY);
for (let j = 0; j < NY; j++) {
  for (let i = 0; i < NX; i++) {
    const X = gx(i);
    const Y = gy(j);
    const r = Math.hypot(X, Y);
    if (r > 1.0) continue;
    const theta = 2 * Math.asin(Math.min(1, r / Math.SQRT2));
    const az = Math.atan2(X, Y);
    const V = [
      Math.sin(theta) * Math.cos(az),
      Math.sin(theta) * Math.sin(az),
      Math.cos(theta),
    ];
    let s = 0;
    for (const p of poleUnits) {
      const dot = V[0] * p[0] + V[1] * p[1] + V[2] * p[2];
      s += Math.exp(K * (dot * dot - 1));
    }
    density[j * NX + i] = s;
  }
}

function marchingSquares(values, nx, ny, level) {
  const segs = [];
  const at = (i, j) => values[j * nx + i];
  const lerp = (x1, y1, v1, x2, y2, v2) => {
    const tt = (level - v1) / (v2 - v1);
    return [x1 + tt * (x2 - x1), y1 + tt * (y2 - y1)];
  };
  for (let j = 0; j < ny - 1; j++) {
    for (let i = 0; i < nx - 1; i++) {
      const v0 = at(i, j);
      const v1 = at(i + 1, j);
      const v2 = at(i + 1, j + 1);
      const v3 = at(i, j + 1);
      const x0 = gx(i);
      const x1 = gx(i + 1);
      const y0 = gy(j);
      const y1 = gy(j + 1);
      let code = 0;
      if (v0 >= level) code |= 1;
      if (v1 >= level) code |= 2;
      if (v2 >= level) code |= 4;
      if (v3 >= level) code |= 8;
      if (code === 0 || code === 15) continue;
      const eB = lerp(x0, y0, v0, x1, y0, v1);
      const eR = lerp(x1, y0, v1, x1, y1, v2);
      const eT = lerp(x1, y1, v2, x0, y1, v3);
      const eL = lerp(x0, y1, v3, x0, y0, v0);
      const push = (a, b) => segs.push([a[0], a[1], b[0], b[1]]);
      switch (code) {
        case 1:
        case 14:
          push(eL, eB);
          break;
        case 2:
        case 13:
          push(eB, eR);
          break;
        case 3:
        case 12:
          push(eL, eR);
          break;
        case 4:
        case 11:
          push(eR, eT);
          break;
        case 5:
          push(eL, eT);
          push(eB, eR);
          break;
        case 6:
        case 9:
          push(eB, eT);
          break;
        case 7:
        case 8:
          push(eL, eT);
          break;
        case 10:
          push(eL, eB);
          push(eR, eT);
          break;
        default:
          break;
      }
    }
  }
  return segs;
}

function hexLerp(a, b, tt) {
  const pa = [parseInt(a.slice(1, 3), 16), parseInt(a.slice(3, 5), 16), parseInt(a.slice(5, 7), 16)];
  const pb = [parseInt(b.slice(1, 3), 16), parseInt(b.slice(3, 5), 16), parseInt(b.slice(5, 7), 16)];
  const mix = pa.map((v, i) => Math.round(v + (pb[i] - v) * tt));
  return "#" + mix.map((v) => v.toString(16).padStart(2, "0")).join("");
}

const maxD = density.reduce((m, v) => (v > m ? v : m), 0);
const LEVEL_FRACS = [0.16, 0.3, 0.48, 0.7];
const CONTOURS = LEVEL_FRACS.map((lf, idx) => ({
  segs: marchingSquares(density, NX, NY, lf * maxD),
  color: hexLerp(t.seq[0], t.seq[1], idx / (LEVEL_FRACS.length - 1)),
  w: 1.4 + idx * 0.6,
  op: 0.45 + idx * 0.16,
}));

// --- SVG overlays (data → pixels via the chart's scales) --------------------
const FONT = '-apple-system, BlinkMacSystemFont, "Segoe UI", Roboto, Helvetica, Arial, sans-serif';

function polyToPath(xs, ys, segs) {
  return segs
    .map(
      (poly) =>
        "M" + poly.map((pt) => `${xs(pt.x).toFixed(1)} ${ys(pt.y).toFixed(1)}`).join(" L"),
    )
    .join(" ");
}

function NetGrid() {
  const xs = useXScale();
  const ys = useYScale();
  const cx = xs(0);
  const cy = ys(0);
  const rPx = Math.abs(xs(1) - xs(0));
  return (
    <g>
      {NET.map((segs, k) => (
        <path key={k} d={polyToPath(xs, ys, segs)} fill="none" stroke={t.grid} strokeWidth={1} />
      ))}
      <line x1={xs(-1)} y1={cy} x2={xs(1)} y2={cy} stroke={t.grid} strokeWidth={1} />
      <line x1={cx} y1={ys(-1)} x2={cx} y2={ys(1)} stroke={t.grid} strokeWidth={1} />
      <circle cx={cx} cy={cy} r={rPx} fill="none" stroke={t.ink} strokeWidth={2.5} />
    </g>
  );
}

function DensityContours() {
  const xs = useXScale();
  const ys = useYScale();
  return (
    <g>
      {CONTOURS.map((c, k) => (
        <path
          key={k}
          d={c.segs
            .map((s) => `M${xs(s[0]).toFixed(1)} ${ys(s[1]).toFixed(1)} L${xs(s[2]).toFixed(1)} ${ys(s[3]).toFixed(1)}`)
            .join(" ")}
          fill="none"
          stroke={c.color}
          strokeWidth={c.w}
          strokeOpacity={c.op}
          strokeLinecap="round"
        />
      ))}
    </g>
  );
}

function GreatCircles() {
  const xs = useXScale();
  const ys = useYScale();
  return (
    <g>
      {MEAN_PLANES.map((mp, k) => (
        <path
          key={k}
          d={polyToPath(xs, ys, mp.segs)}
          fill="none"
          stroke={mp.color}
          strokeWidth={3.5}
          strokeOpacity={0.95}
          strokeLinejoin="round"
          strokeLinecap="round"
        />
      ))}
    </g>
  );
}

const CARDINALS = [
  ["N", 0],
  ["E", 90],
  ["S", 180],
  ["W", 270],
];
const DEG_LABELS = [30, 60, 120, 150, 210, 240, 300, 330];

function Chrome() {
  const xs = useXScale();
  const ys = useYScale();
  const radial = (deg, rr) => {
    const a = (deg * Math.PI) / 180;
    return [xs(rr * Math.sin(a)), ys(rr * Math.cos(a))];
  };
  const ticks = [];
  for (let deg = 0; deg < 360; deg += 10) {
    const major = deg % 30 === 0;
    const [x1, y1] = radial(deg, 1.0);
    const [x2, y2] = radial(deg, major ? 1.04 : 1.022);
    ticks.push(
      <line key={`t${deg}`} x1={x1} y1={y1} x2={x2} y2={y2} stroke={t.inkSoft} strokeWidth={major ? 1.6 : 1} />,
    );
  }
  return (
    <g fontFamily={FONT}>
      {ticks}
      {DEG_LABELS.map((deg) => {
        const [x, y] = radial(deg, 1.11);
        return (
          <text key={`d${deg}`} x={x} y={y} textAnchor="middle" dominantBaseline="middle" fontSize={13} fill={t.inkSoft}>
            {deg}°
          </text>
        );
      })}
      {CARDINALS.map(([label, deg]) => {
        const [x, y] = radial(deg, 1.085);
        return (
          <text key={label} x={x} y={y} textAnchor="middle" dominantBaseline="middle" fontSize={24} fontWeight={700} fill={t.ink}>
            {label}
          </text>
        );
      })}
    </g>
  );
}

function Annotations() {
  const xs = useXScale();
  const ys = useYScale();
  const legendStart = -1.18;
  const legendStep = 0.62;
  return (
    <g fontFamily={FONT}>
      <text x={xs(0)} y={ys(1.34)} textAnchor="middle" dominantBaseline="middle" fontSize={25} fontWeight={600} fill={t.ink}>
        {TITLE}
      </text>
      <text x={xs(0)} y={ys(1.2)} textAnchor="middle" dominantBaseline="middle" fontSize={15} fill={t.inkSoft}>
        Lower-hemisphere equal-area (Schmidt) net · poles to planes with mean great circles
      </text>
      {FEATURES.map((f, i) => {
        const x = legendStart + i * legendStep;
        return (
          <g key={f.name}>
            <circle cx={xs(x)} cy={ys(-1.18)} r={7} fill={f.color} />
            <text x={xs(x) + 14} y={ys(-1.18)} dominantBaseline="middle" fontSize={15} fill={t.inkSoft}>
              {f.name}
            </text>
          </g>
        );
      })}
      <text x={xs(0)} y={ys(-1.34)} textAnchor="middle" dominantBaseline="middle" fontSize={13} fill={t.inkSoft}>
        Density contours: Imprint sequential ramp (exponential Kamb smoothing of pole axes)
      </text>
    </g>
  );
}

// --- Chart (default-exported component — the harness mounts it) -------------
export default function Chart() {
  return (
    <ChartContainer
      width={SIZE.width}
      height={SIZE.height}
      margin={{ top: 12, right: 12, bottom: 12, left: 12 }}
      series={SERIES}
      xAxis={[{ scaleType: "linear", min: -R, max: R }]}
      yAxis={[{ scaleType: "linear", min: -R, max: R }]}
      skipAnimation
    >
      <NetGrid />
      <DensityContours />
      <GreatCircles />
      <ScatterPlot />
      <Chrome />
      <Annotations />
      <ChartsTooltip trigger="item" />
    </ChartContainer>
  );
}
Runnable source as JSON, for any HTTP client: https://api.anyplot.ai/specs/stereonet-equal-area/muix/code. Any spec id and library id listed in llms-full.txt fit the same URL shape; every URL below is complete and callable.
{
  "spec_id": "stereonet-equal-area",
  "language": "javascript",
  "library": "muix",
  "page": "https://anyplot.ai/stereonet-equal-area/javascript/muix",
  "hub": "https://anyplot.ai/stereonet-equal-area",
  "code_json": "https://api.anyplot.ai/specs/stereonet-equal-area/muix/code",
  "spec_json": "https://api.anyplot.ai/specs/stereonet-equal-area",
  "render_light_png": "https://storage.googleapis.com/anyplot-images/plots/stereonet-equal-area/javascript/muix/plot-light.png",
  "render_dark_png": "https://storage.googleapis.com/anyplot-images/plots/stereonet-equal-area/javascript/muix/plot-dark.png",
  "interactive_light_html": "https://storage.googleapis.com/anyplot-images/plots/stereonet-equal-area/javascript/muix/plot-light.html",
  "interactive_dark_html": "https://storage.googleapis.com/anyplot-images/plots/stereonet-equal-area/javascript/muix/plot-dark.html",
  "quality_score": 94.0,
  "license": "MIT",
  "guide": "https://anyplot.ai/llms.txt"
}
Part of Structural Geology Stereonet (Equal-Area Projection) on anyplot.ai.