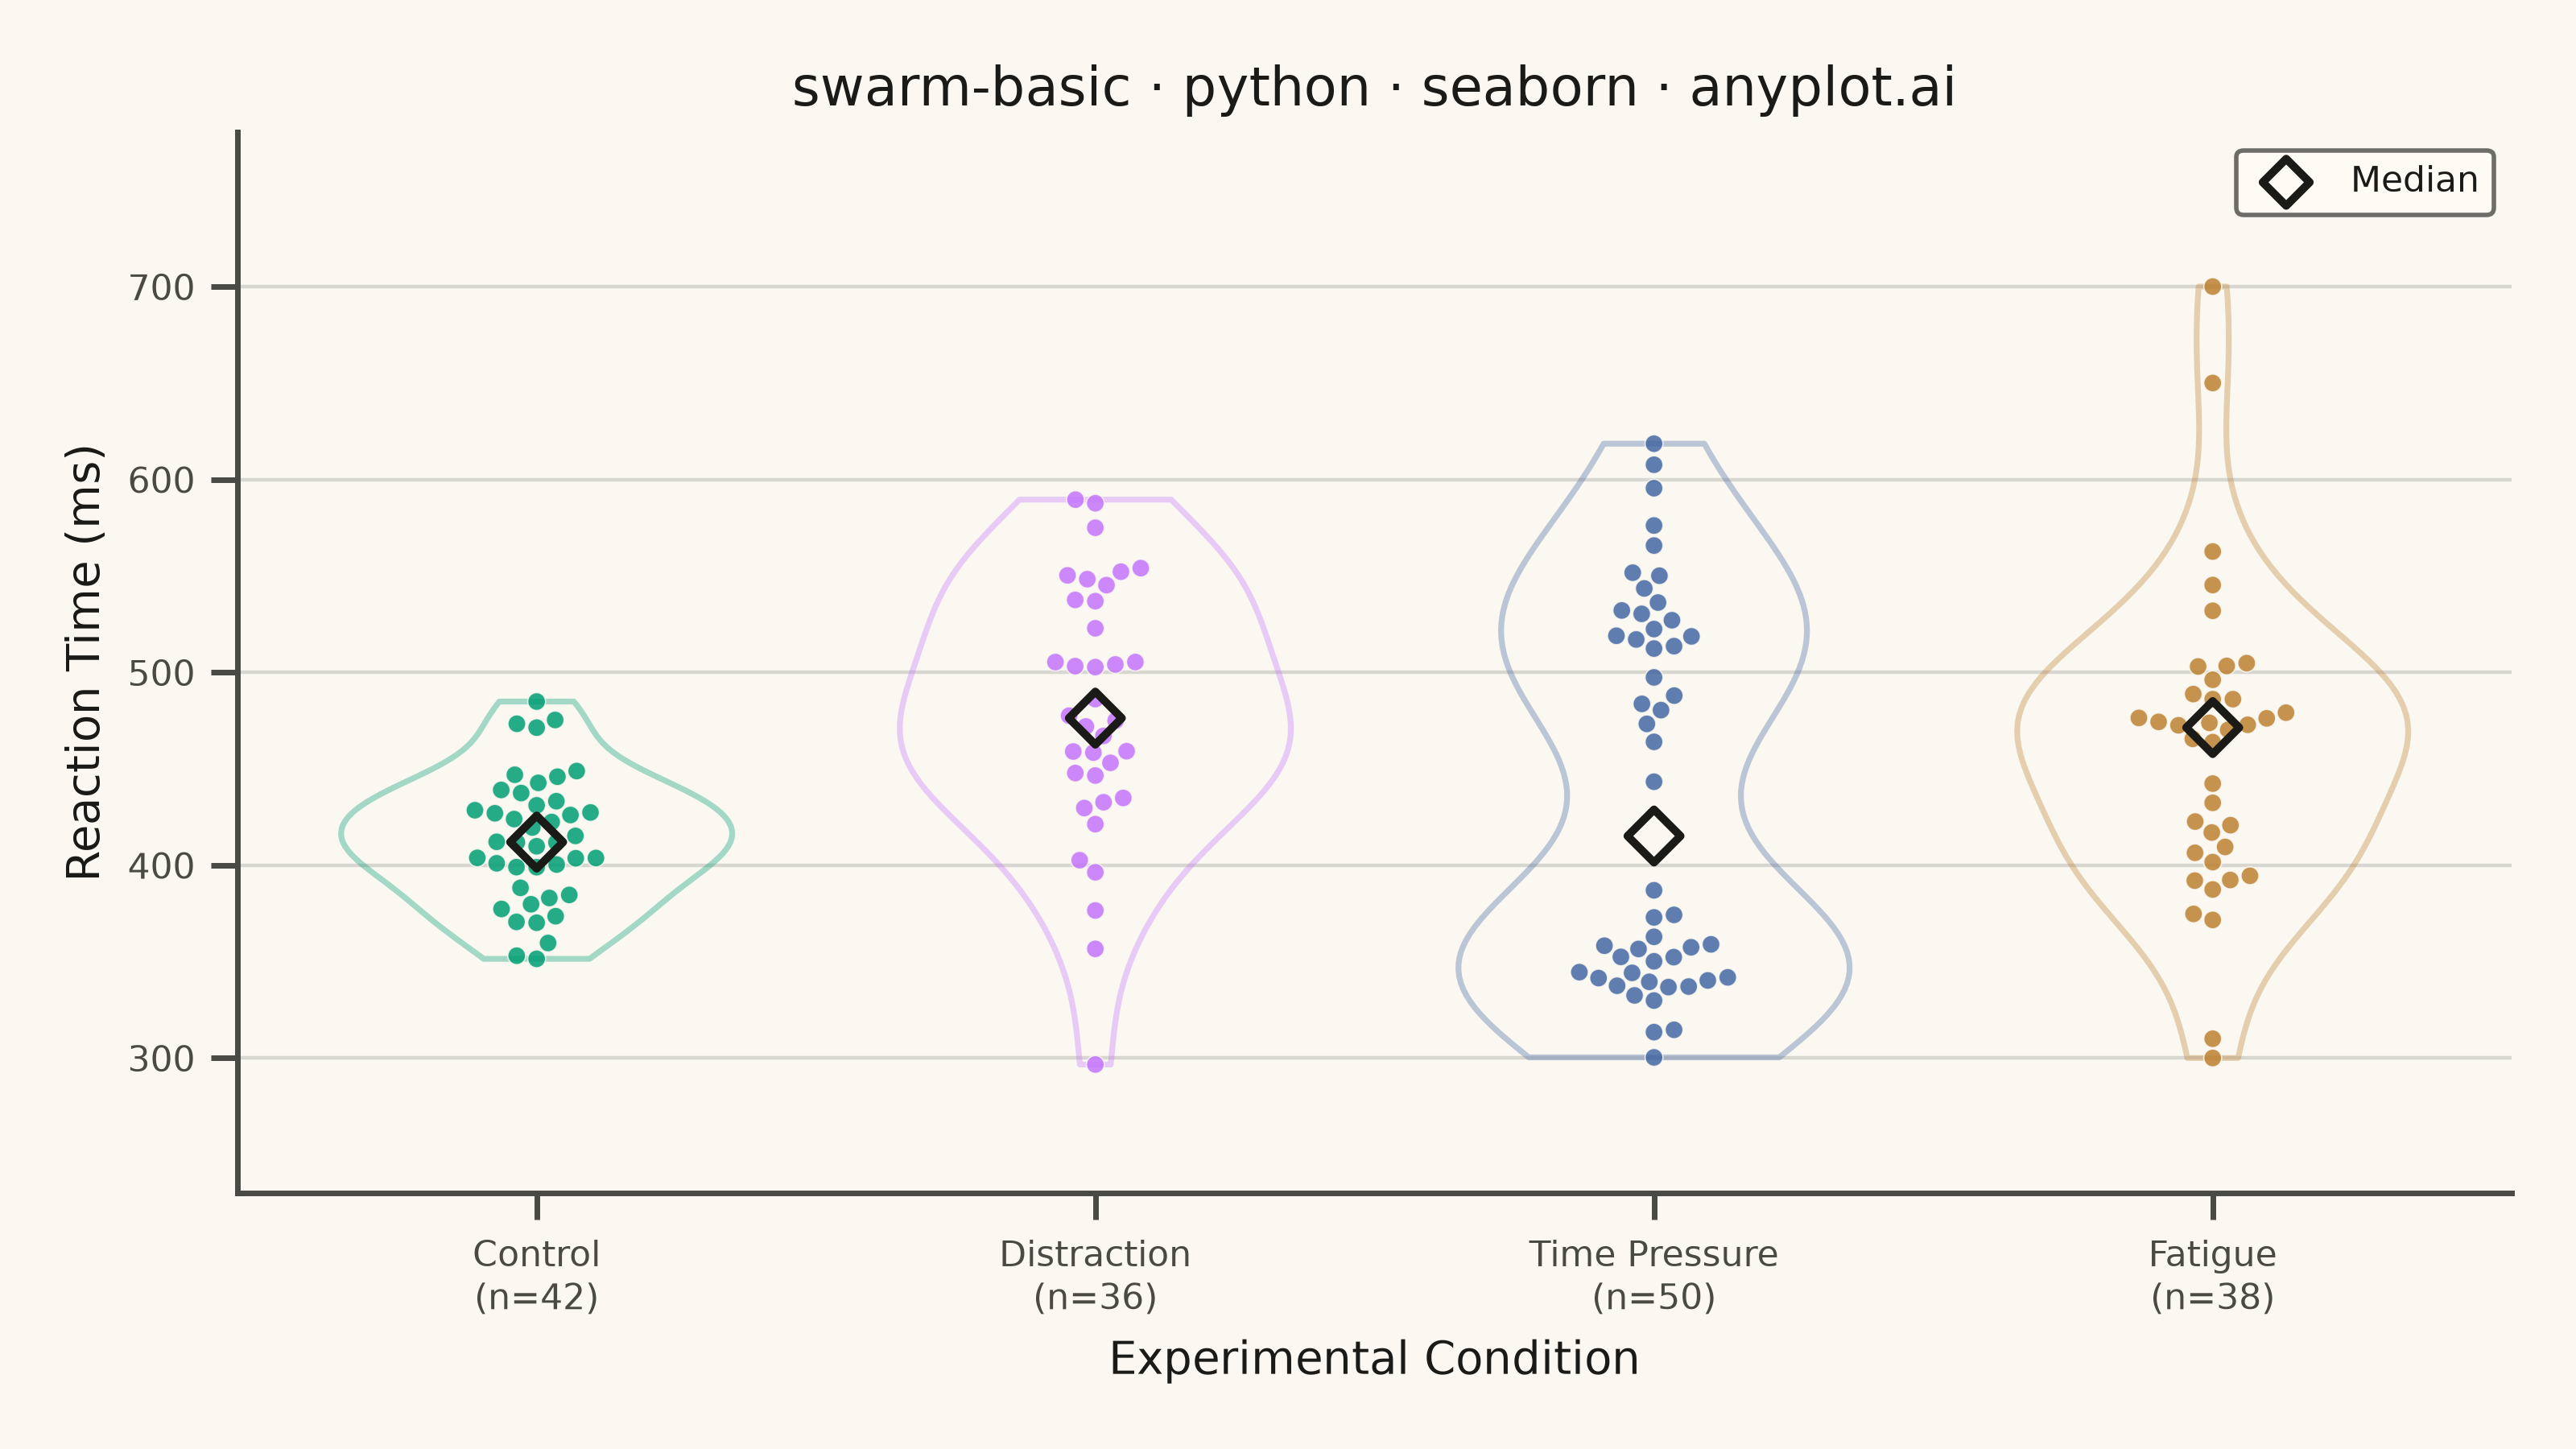
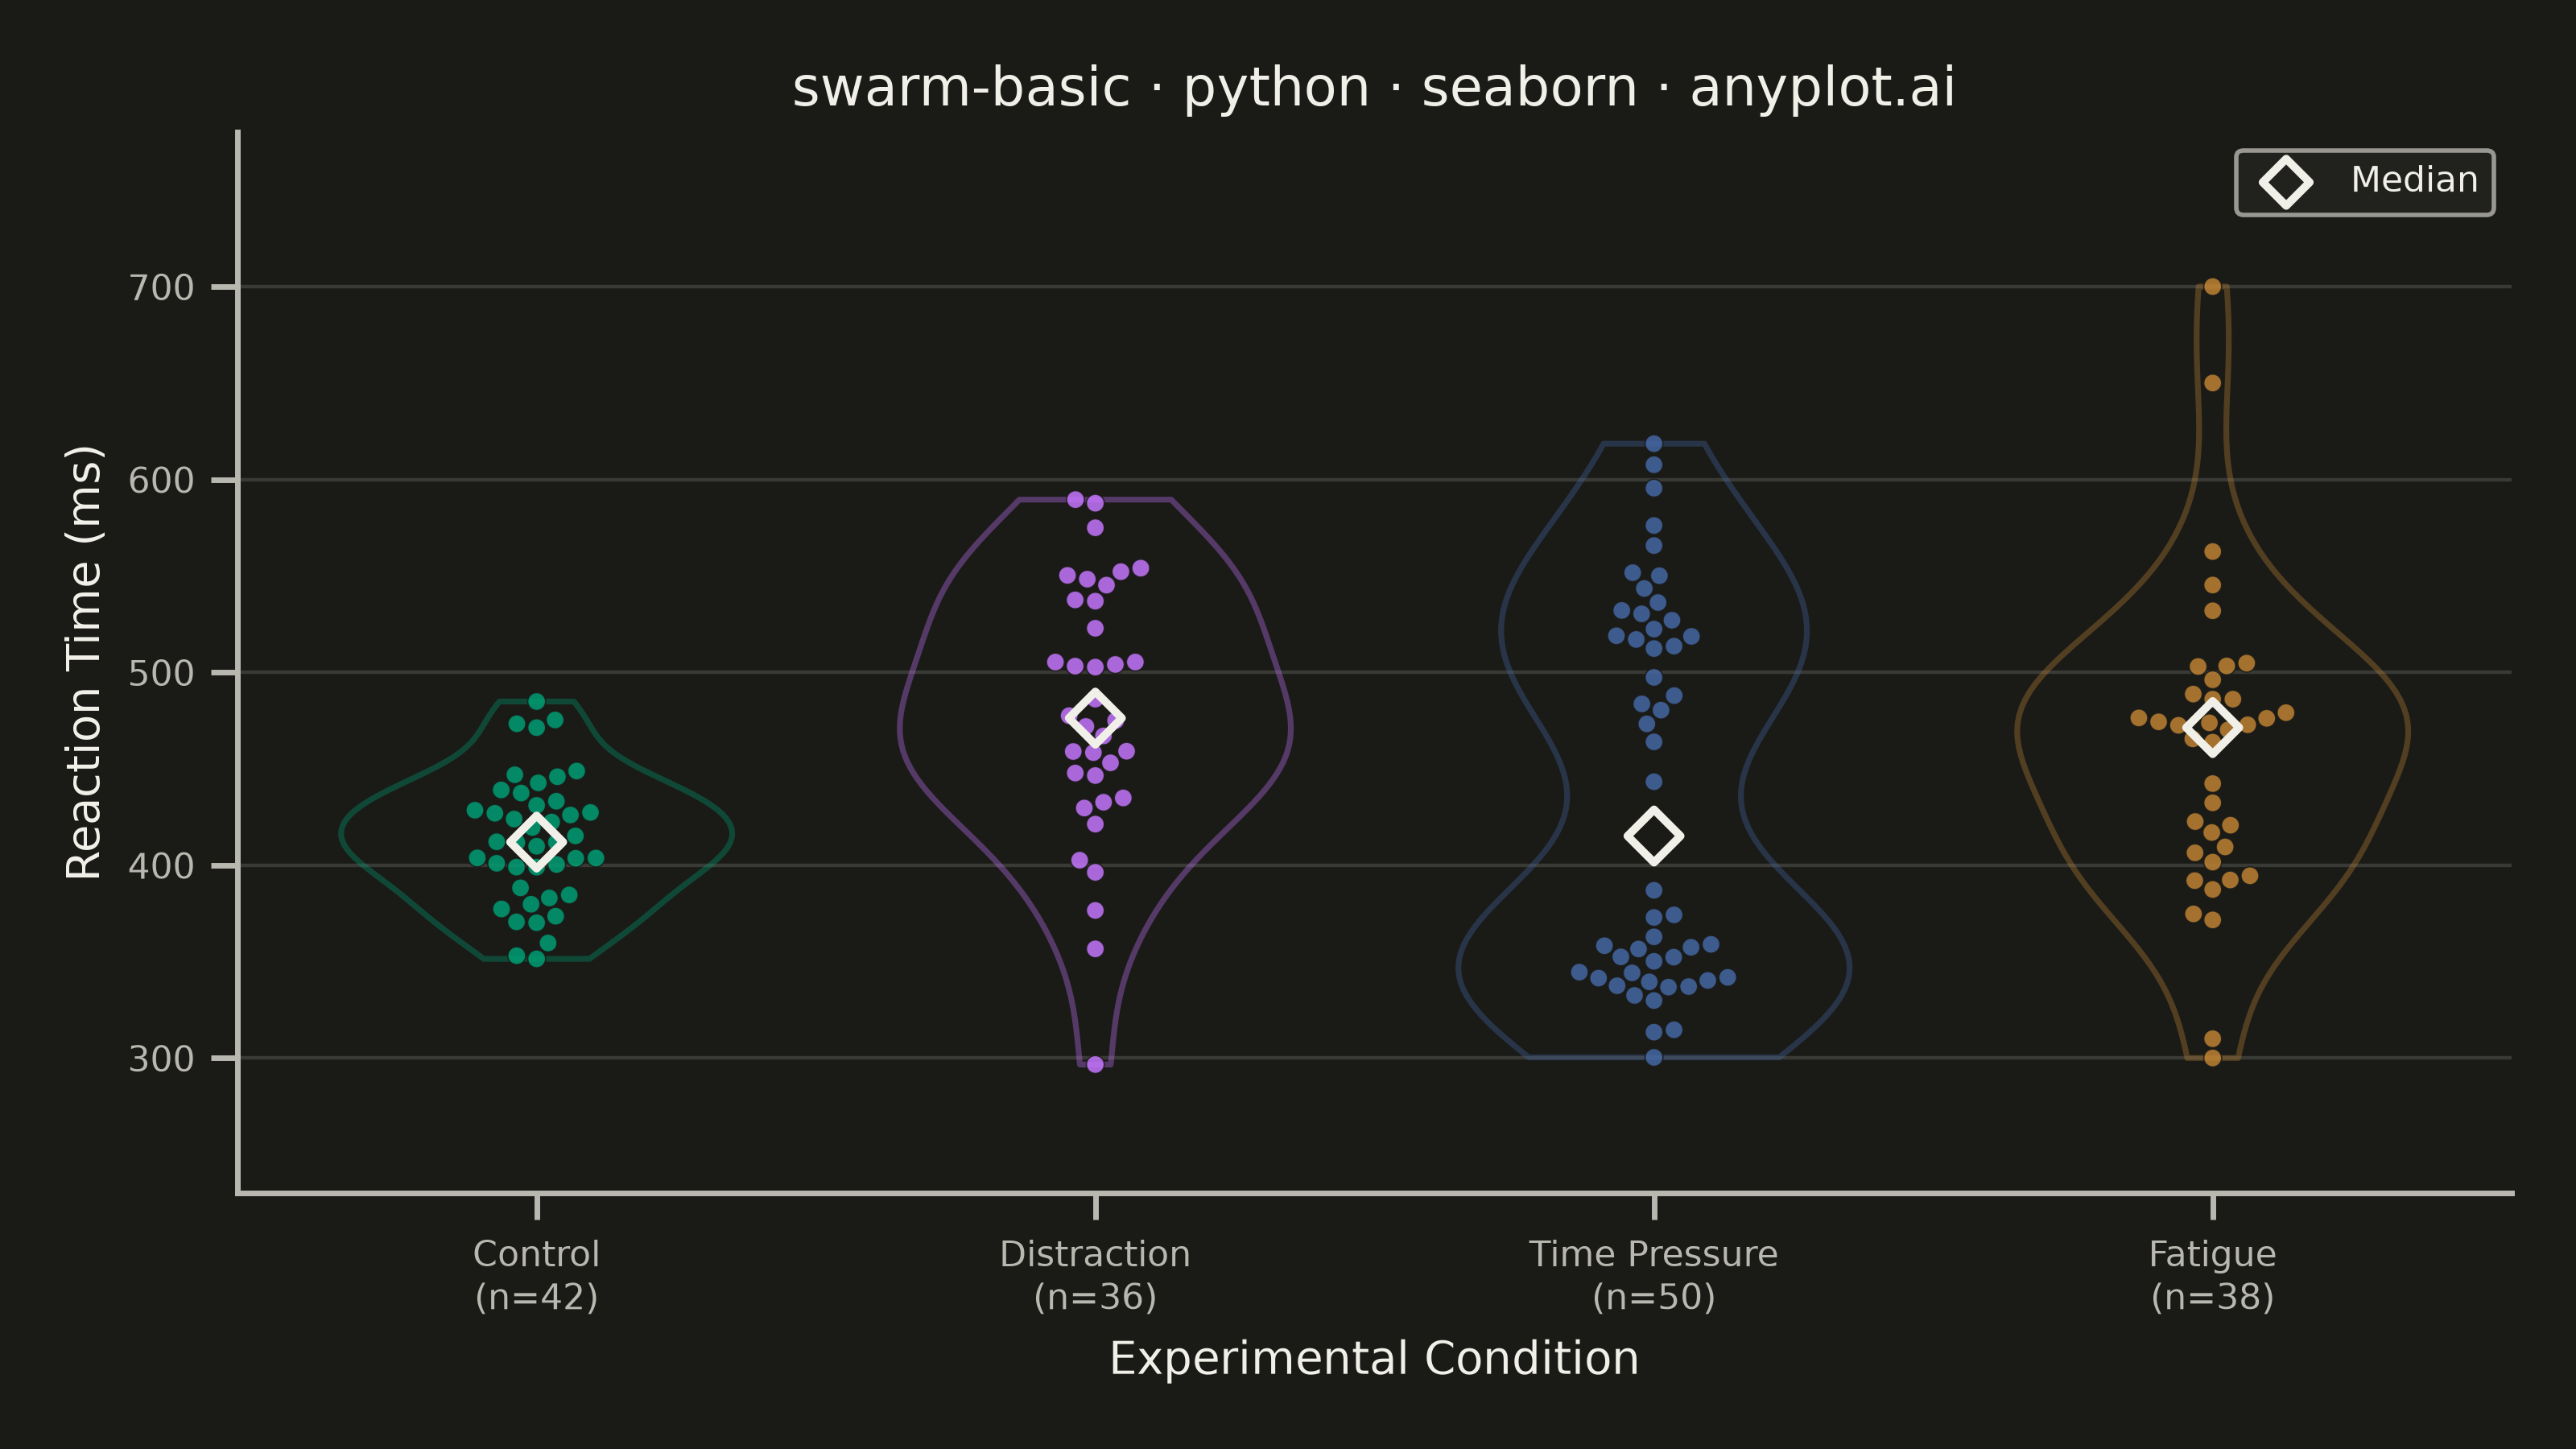
A swarm plot (beeswarm plot) displays individual data points for categorical comparisons, with points spread horizontally to avoid overlap. This reveals the full distribution shape and density while preserving exact values - combining the benefits of strip plots (individual points) and violin plots (density visualization). Ideal when you need to see every observation rather than just summary statistics.
Preview render from the Seaborn implementation.