The same plot in 14 other libraries — JavaScript: D3.js, Apache ECharts, Highcharts, MUI X Charts; Python: Altair, Bokeh, lets-plot, Matplotlib, Plotly, plotnine, Pygal, Seaborn; R: ggplot2; Julia: Makie.jl. Compare all 15 side by side: Basic Swarm Plot in Python, R, Julia and JavaScript.
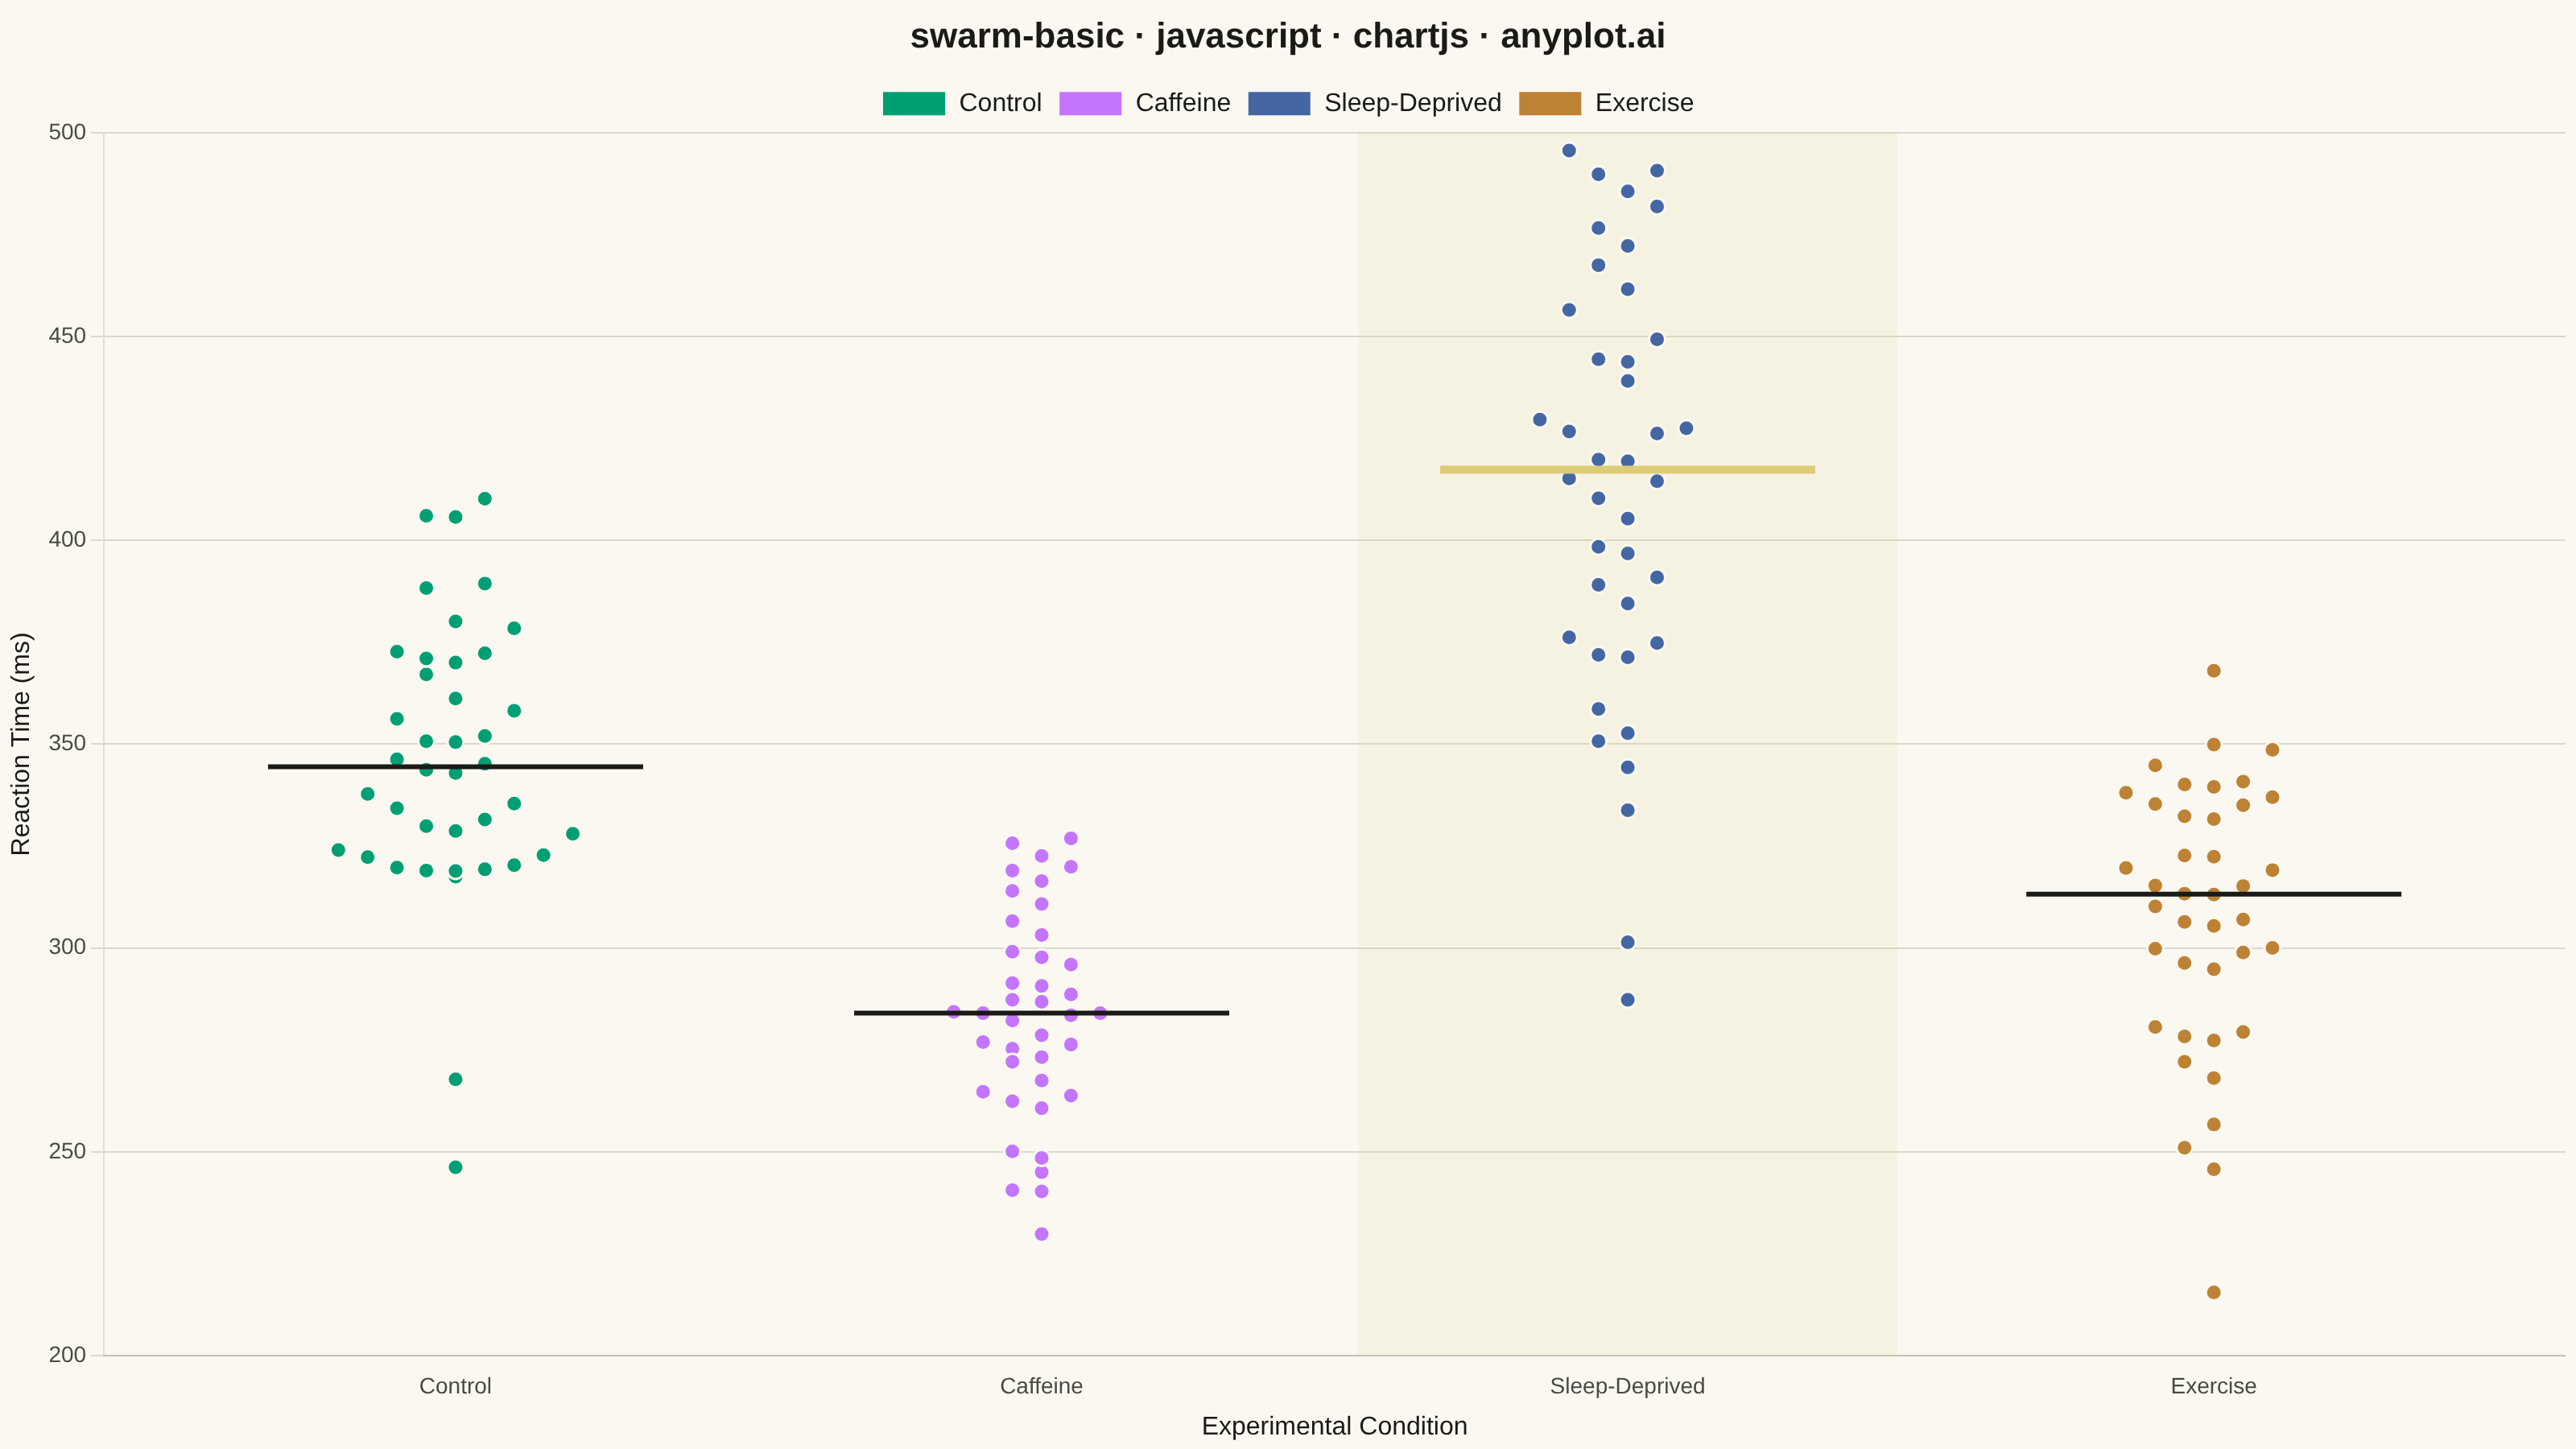
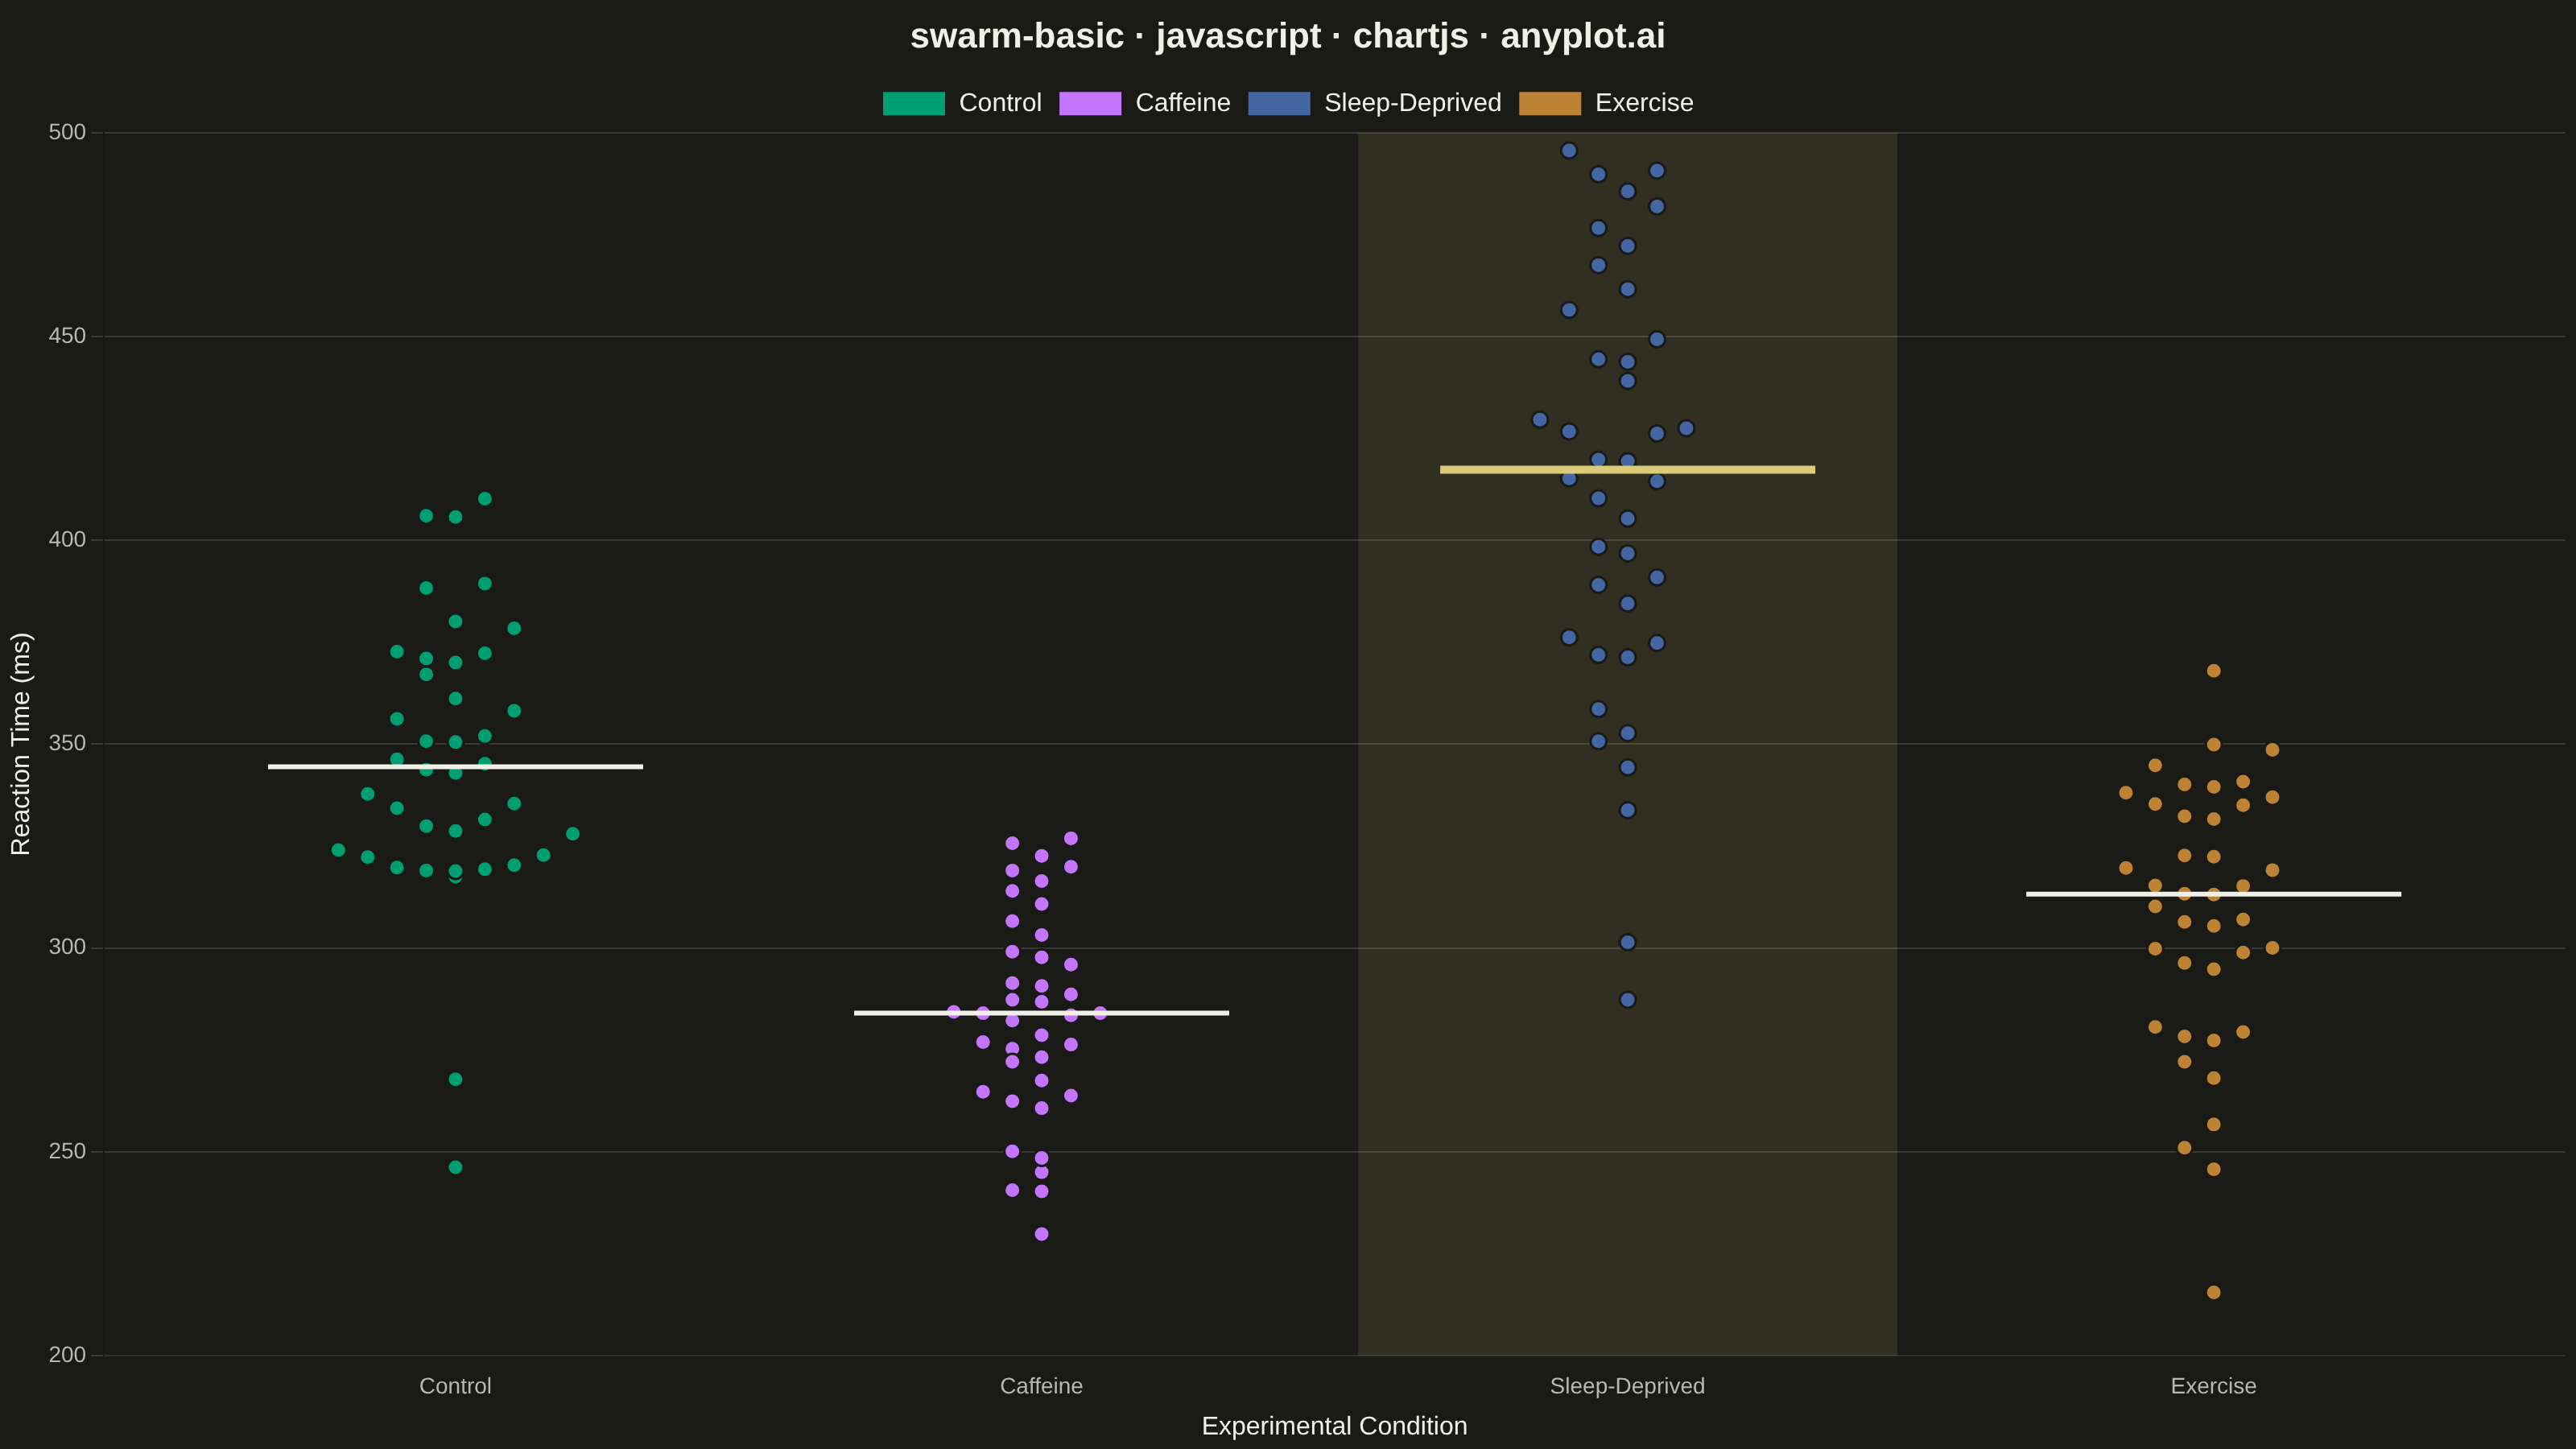
A swarm plot (beeswarm plot) displays individual data points for categorical comparisons, with points spread horizontally to avoid overlap. This reveals the full distribution shape and density while preserving exact values - combining the benefits of strip plots (individual points) and violin plots (density visualization). Ideal when you need to see every observation rather than just summary statistics.
// anyplot.ai
// swarm-basic: Basic Swarm Plot
// Library: chartjs 4.4.7 | JavaScript 22.23.1
// Quality: 92/100 | Created: 2026-07-26

const t = window.ANYPLOT_TOKENS;

// --- Data (in-memory, deterministic) ----------------------------------------
// Reaction times (ms) across a psychology experiment: 4 conditions, 40 obs each.
function makeRng(seed) {
  let state = seed >>> 0;
  return function () {
    state = (1664525 * state + 1013904223) >>> 0;
    return state / 4294967296;
  };
}
function randNormal(rng, mean, sd) {
  const u1 = Math.max(rng(), 1e-9);
  const u2 = rng();
  const z = Math.sqrt(-2 * Math.log(u1)) * Math.cos(2 * Math.PI * u2);
  return mean + z * sd;
}

const rng = makeRng(42);
const categories = ["Control", "Caffeine", "Sleep-Deprived", "Exercise"];
const conditionStats = [
  { mean: 340, sd: 35 },
  { mean: 285, sd: 28 },
  { mean: 415, sd: 55 },
  { mean: 305, sd: 38 },
];
const observationsPerGroup = 40;

const valuesByCategory = conditionStats.map(({ mean, sd }) =>
  Array.from({ length: observationsPerGroup }, () =>
    Math.max(150, Math.round(randNormal(rng, mean, sd) * 10) / 10),
  ),
);

// --- Swarm layout: bin by value, spread symmetrically within each bin -------
// binCount adapts to each group's own spread (finer bins for wider-spread groups)
// so a group with more within-bin crowding still resolves into distinct points
// instead of a dense clump, without touching marker size (kept uniform per spec).
function computeSwarmOffsets(values, targetPointsPerBin, step) {
  const min = Math.min(...values);
  const max = Math.max(...values);
  const binCount = Math.max(8, Math.round(values.length / targetPointsPerBin));
  const binSize = (max - min) / binCount || 1;
  const binCounts = new Array(binCount).fill(0);
  const sortedIdx = values.map((_, i) => i).sort((a, b) => values[a] - values[b]);
  const offsets = new Array(values.length).fill(0);
  for (const i of sortedIdx) {
    const binIdx = Math.min(binCount - 1, Math.floor((values[i] - min) / binSize));
    const count = binCounts[binIdx];
    const side = count % 2 === 0 ? 1 : -1;
    const rank = Math.ceil(count / 2);
    offsets[i] = side * rank * step;
    binCounts[binIdx] = count + 1;
  }
  return offsets;
}

const HIGHLIGHT_CATEGORY_IDX = categories.indexOf("Sleep-Deprived");

const swarmDatasets = categories.map((category, catIdx) => {
  const values = valuesByCategory[catIdx];
  const offsets = computeSwarmOffsets(values, 2.5, 0.05);
  return {
    type: "scatter",
    label: category,
    data: values.map((v, i) => ({ x: catIdx + offsets[i], y: v })),
    backgroundColor: t.palette[catIdx % t.palette.length],
    borderColor: t.pageBg,
    borderWidth: 1.5,
    pointRadius: 5,
    pointHoverRadius: 5,
    order: 2,
  };
});

function median(values) {
  const sorted = [...values].sort((a, b) => a - b);
  const mid = Math.floor(sorted.length / 2);
  return sorted.length % 2 === 0 ? (sorted[mid - 1] + sorted[mid]) / 2 : sorted[mid];
}

const medianPoints = [];
categories.forEach((_, catIdx) => {
  const med = median(valuesByCategory[catIdx]);
  medianPoints.push({ x: catIdx - 0.32, y: med });
  medianPoints.push({ x: catIdx + 0.32, y: med });
  medianPoints.push({ x: catIdx, y: null });
});

// Median line is a single dataset, but its per-segment color/width is driven by
// Chart.js's `segment` styling API so the standout Sleep-Deprived condition
// (markedly slower and more variable reaction times) reads as the visual focal
// point, without varying the swarm point size the spec asks to keep consistent.
const medianDataset = {
  type: "line",
  label: "Median",
  data: medianPoints,
  borderColor: t.ink,
  borderWidth: 3,
  pointRadius: 0,
  spanGaps: false,
  order: 1,
  segment: {
    borderColor: (ctx) =>
      Math.floor(ctx.p0DataIndex / 3) === HIGHLIGHT_CATEGORY_IDX ? t.amber : t.ink,
    borderWidth: (ctx) => (Math.floor(ctx.p0DataIndex / 3) === HIGHLIGHT_CATEGORY_IDX ? 5 : 3),
  },
};

// Custom plugin (native Chart.js plugin-core API, not a community plugin): draws
// a subtle backdrop band behind the standout condition so it reads as the focal
// point at a glance, before any dataset is drawn.
const swarmHighlightPlugin = {
  id: "swarmHighlight",
  beforeDatasetsDraw(chart) {
    const { ctx, chartArea, scales } = chart;
    if (!chartArea) return;
    const left = scales.x.getPixelForValue(HIGHLIGHT_CATEGORY_IDX - 0.46);
    const right = scales.x.getPixelForValue(HIGHLIGHT_CATEGORY_IDX + 0.46);
    ctx.save();
    ctx.fillStyle = `${t.amber}1f`;
    ctx.fillRect(left, chartArea.top, right - left, chartArea.bottom - chartArea.top);
    ctx.restore();
  },
};

// --- Mount -------------------------------------------------------------------
const canvas = document.createElement("canvas");
document.getElementById("container").appendChild(canvas);

// --- Chart ---------------------------------------------------------------
new Chart(canvas, {
  type: "scatter",
  data: { datasets: [...swarmDatasets, medianDataset] },
  plugins: [swarmHighlightPlugin],
  options: {
    responsive: true,
    maintainAspectRatio: false,
    animation: false,
    plugins: {
      title: {
        display: true,
        text: "swarm-basic · javascript · chartjs · anyplot.ai",
        color: t.ink,
        font: { size: 22 },
      },
      legend: {
        position: "top",
        labels: {
          color: t.ink,
          font: { size: 16 },
          filter: (item) => item.text !== "Median",
        },
      },
    },
    scales: {
      x: {
        type: "linear",
        min: -0.6,
        max: categories.length - 1 + 0.6,
        afterBuildTicks: (axis) => {
          axis.ticks = categories.map((_, i) => ({ value: i }));
        },
        ticks: {
          color: t.inkSoft,
          font: { size: 14 },
          callback: (value) => categories[value] ?? "",
        },
        grid: { display: false },
        title: { display: true, text: "Experimental Condition", color: t.ink, font: { size: 16 } },
      },
      y: {
        ticks: { color: t.inkSoft, font: { size: 14 } },
        grid: { color: t.grid },
        title: { display: true, text: "Reaction Time (ms)", color: t.ink, font: { size: 16 } },
      },
    },
  },
});
Runnable source as JSON, for any HTTP client: https://api.anyplot.ai/specs/swarm-basic/chartjs/code. Any spec id and library id listed in llms-full.txt fit the same URL shape; every URL below is complete and callable.
{
  "spec_id": "swarm-basic",
  "language": "javascript",
  "library": "chartjs",
  "page": "https://anyplot.ai/swarm-basic/javascript/chartjs",
  "hub": "https://anyplot.ai/swarm-basic",
  "code_json": "https://api.anyplot.ai/specs/swarm-basic/chartjs/code",
  "spec_json": "https://api.anyplot.ai/specs/swarm-basic",
  "render_light_png": "https://storage.googleapis.com/anyplot-images/plots/swarm-basic/javascript/chartjs/plot-light.png",
  "render_dark_png": "https://storage.googleapis.com/anyplot-images/plots/swarm-basic/javascript/chartjs/plot-dark.png",
  "interactive_light_html": "https://storage.googleapis.com/anyplot-images/plots/swarm-basic/javascript/chartjs/plot-light.html",
  "interactive_dark_html": "https://storage.googleapis.com/anyplot-images/plots/swarm-basic/javascript/chartjs/plot-dark.html",
  "quality_score": 92.0,
  "license": "MIT",
  "guide": "https://anyplot.ai/llms.txt"
}
Part of Basic Swarm Plot on anyplot.ai.