The same plot in 14 other libraries — JavaScript: Chart.js, D3.js, Highcharts, MUI X Charts; Python: Altair, Bokeh, lets-plot, Matplotlib, Plotly, plotnine, Pygal, Seaborn; R: ggplot2; Julia: Makie.jl. Compare all 15 side by side: Basic Swarm Plot in Python, R, Julia and JavaScript.
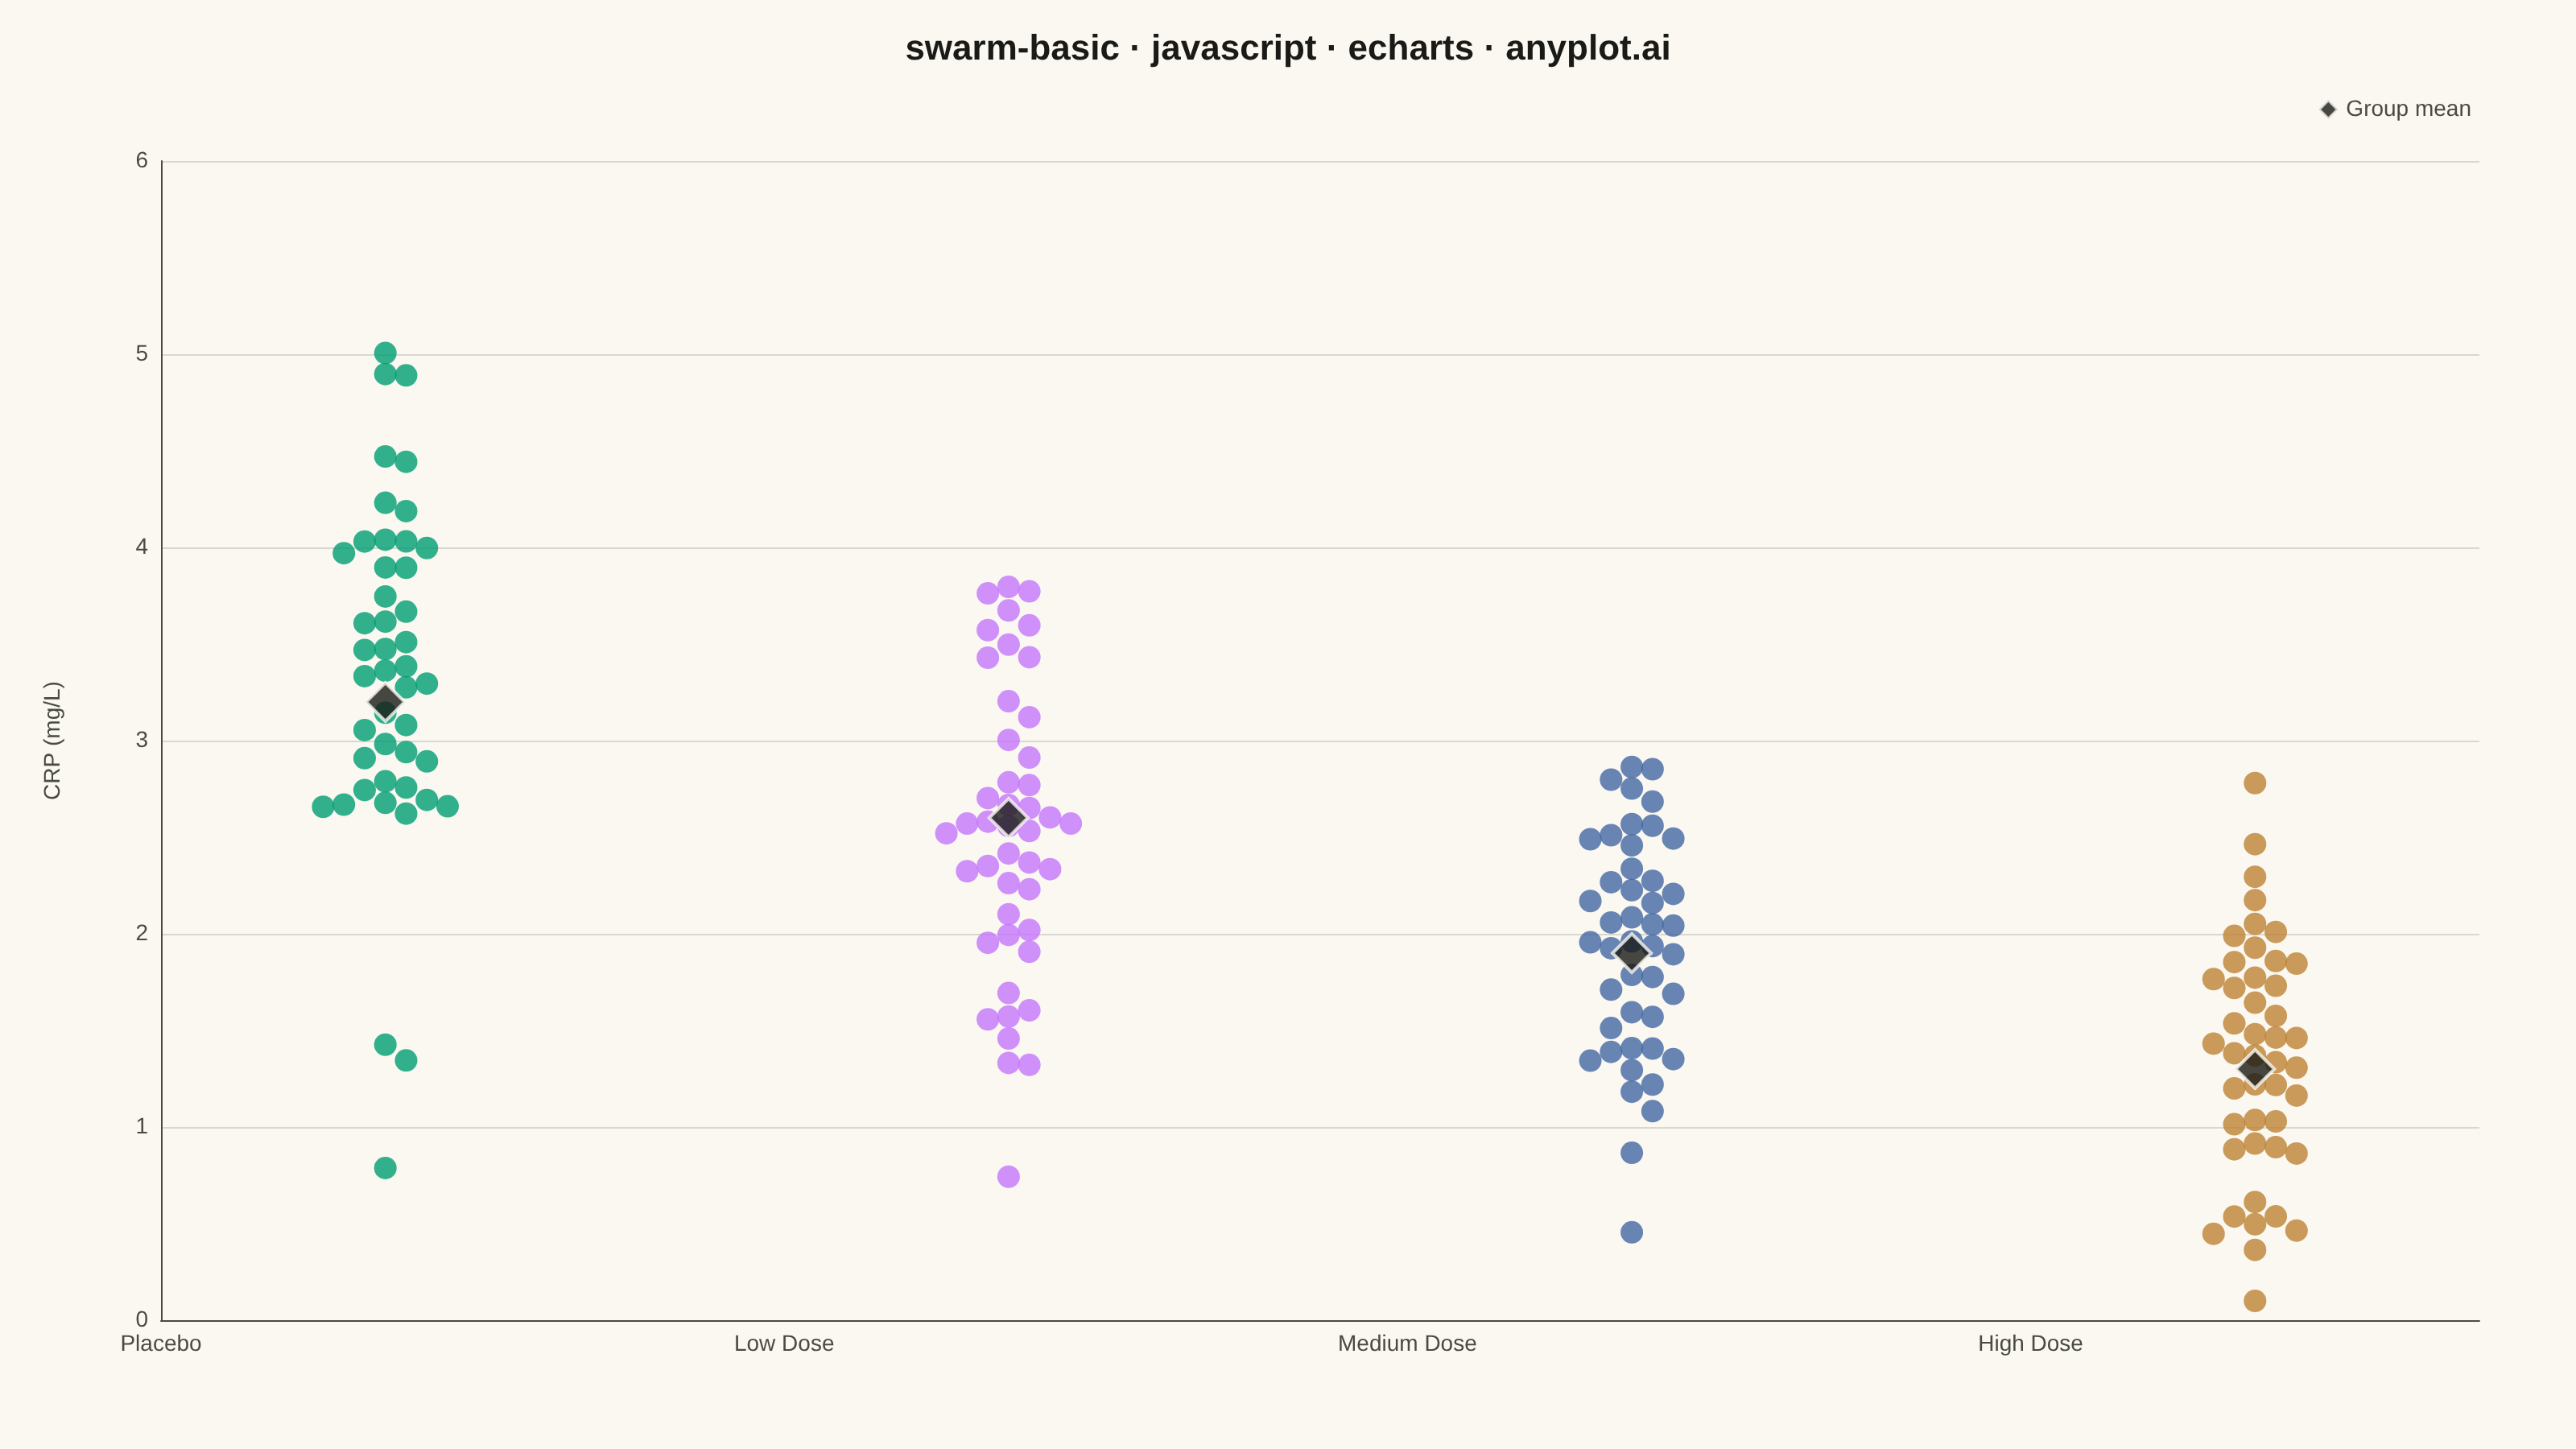
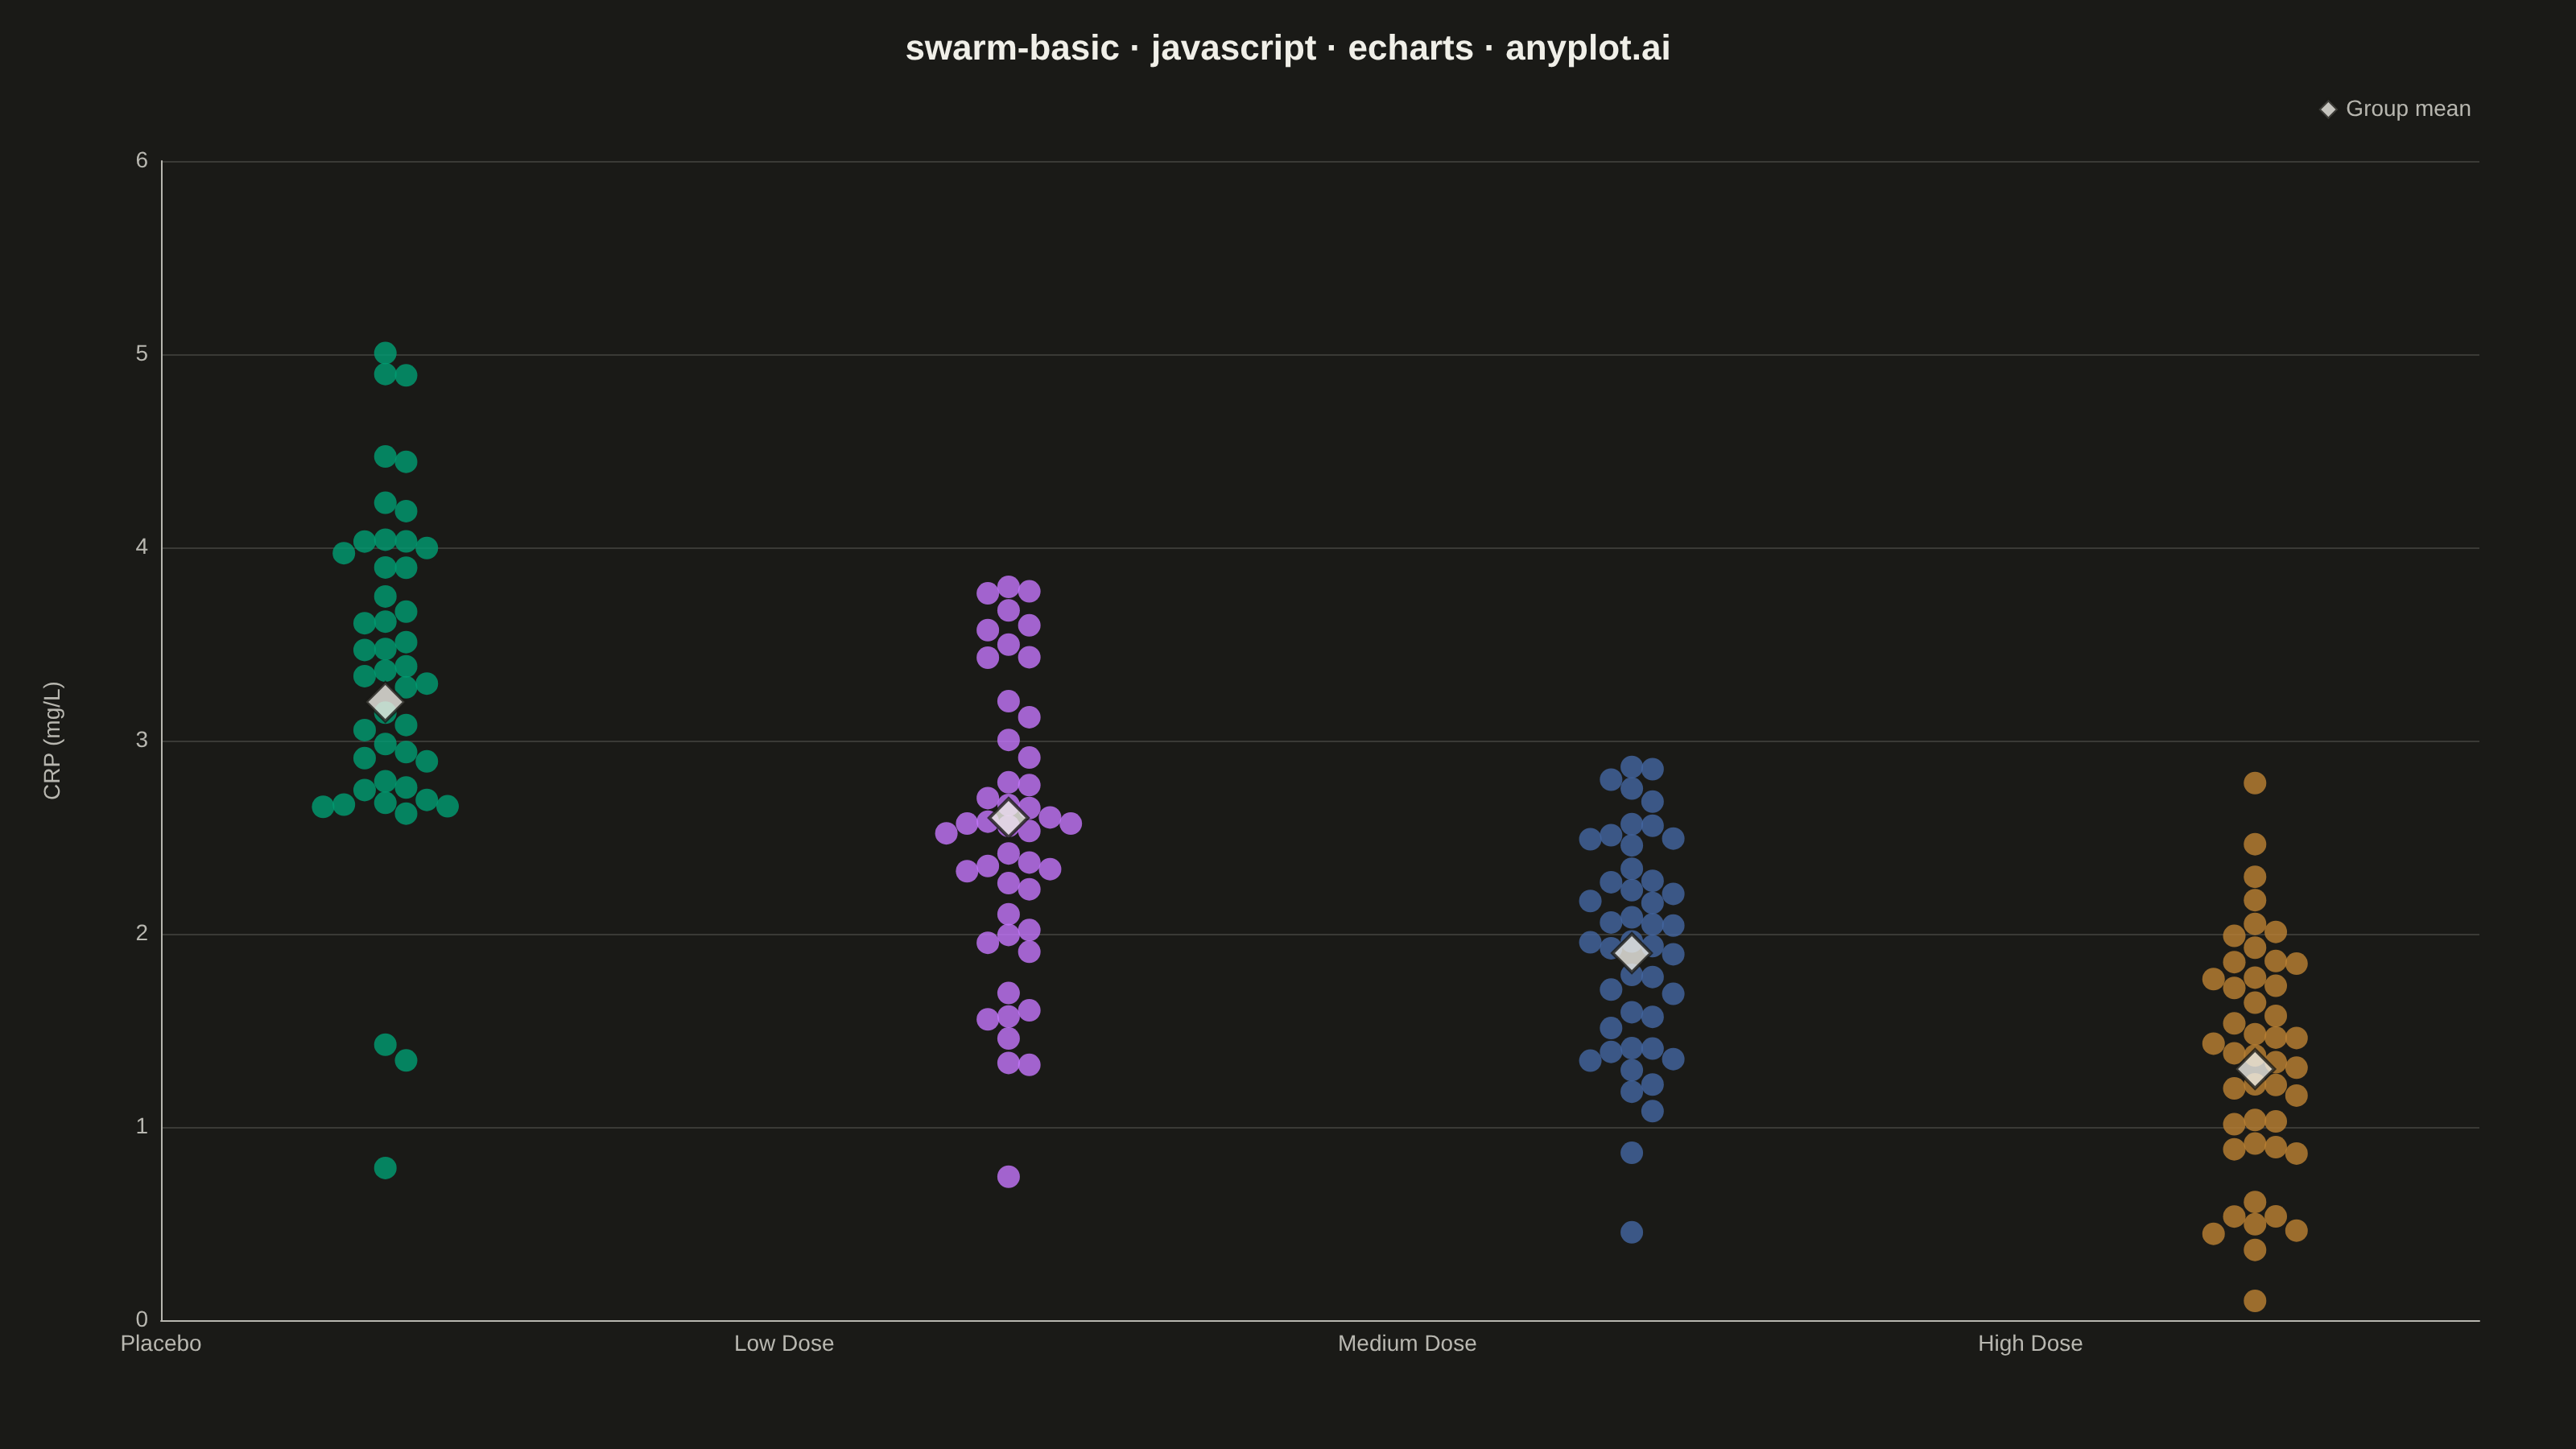
A swarm plot (beeswarm plot) displays individual data points for categorical comparisons, with points spread horizontally to avoid overlap. This reveals the full distribution shape and density while preserving exact values - combining the benefits of strip plots (individual points) and violin plots (density visualization). Ideal when you need to see every observation rather than just summary statistics.
// anyplot.ai
// swarm-basic: Basic Swarm Plot
// Library: echarts 6.1.0 | JavaScript 22.23.1
// Quality: 89/100 | Created: 2026-07-26

const t = window.ANYPLOT_TOKENS;

// --- Data (in-memory, deterministic) ----------------------------------------
// CRP (C-reactive protein) biomarker levels across a dose-escalation trial.
function lcg(seed) {
  let state = seed >>> 0;
  return function () {
    state = (state * 1664525 + 1013904223) >>> 0;
    return state / 4294967296;
  };
}
const rng = lcg(42);
function randNormal() {
  const u1 = Math.max(rng(), 1e-9);
  const u2 = rng();
  return Math.sqrt(-2 * Math.log(u1)) * Math.cos(2 * Math.PI * u2);
}

const groups = [
  { name: "Placebo", n: 45, mean: 3.2, sd: 0.9 },
  { name: "Low Dose", n: 45, mean: 2.6, sd: 0.8 },
  { name: "Medium Dose", n: 45, mean: 1.9, sd: 0.7 },
  { name: "High Dose", n: 45, mean: 1.3, sd: 0.6 },
];
const categories = groups.map((g) => g.name);
const groupValues = groups.map((g) =>
  Array.from({ length: g.n }, () => Math.max(0.1, g.mean + randNormal() * g.sd)),
);

// --- Init ---------------------------------------------------------------
const chart = echarts.init(document.getElementById("container"));

// Fix both axis extents up front so the coordinate system is fully
// deterministic before any point is placed.
const allValues = groupValues.flat();
const yPad = (Math.max(...allValues) - Math.min(...allValues)) * 0.08;
const yMin = Math.max(0, Math.floor(Math.min(...allValues) - yPad));
const yMax = Math.ceil(Math.max(...allValues) + yPad);
const xPad = 0.36; // 12% of the 3-unit category span, keeps swarms off the plot edge

chart.setOption({
  animation: false,
  backgroundColor: "transparent",
  title: {
    text: "swarm-basic · javascript · echarts · anyplot.ai",
    left: "center",
    textStyle: { color: t.ink, fontSize: 22 },
  },
  legend: {
    data: [{ name: "Group mean", icon: "diamond" }],
    right: 60,
    top: 56,
    itemWidth: 12,
    itemHeight: 12,
    textStyle: { color: t.inkSoft, fontSize: 14 },
  },
  grid: { left: 100, right: 60, top: 100, bottom: 80 },
  tooltip: {
    trigger: "item",
    formatter: (p) => `${categories[Math.round(p.value[0])] ?? p.seriesName}<br/>CRP: ${p.value[1].toFixed(2)} mg/L`,
  },
  xAxis: {
    type: "value",
    min: -xPad,
    max: categories.length - 1 + xPad,
    interval: 1,
    axisLabel: {
      color: t.inkSoft,
      fontSize: 14,
      formatter: (v) => categories[Math.round(v)] ?? "",
      showMaxLabel: false,
    },
    axisLine: { lineStyle: { color: t.inkSoft }, onZero: false },
    axisTick: { show: false },
    splitLine: { show: false },
  },
  yAxis: {
    type: "value",
    min: yMin,
    max: yMax,
    name: "CRP (mg/L)",
    nameLocation: "middle",
    nameGap: 60,
    nameTextStyle: { color: t.inkSoft, fontSize: 14 },
    axisLabel: { color: t.inkSoft, fontSize: 14 },
    axisLine: { lineStyle: { color: t.inkSoft }, onZero: false },
    axisTick: { show: false },
    splitLine: { lineStyle: { color: t.grid } },
  },
});

// --- Beeswarm layout ---------------------------------------------------------
// ECharts has no native swarm/beeswarm series. Rather than bucketing points
// into fixed-width bins (which produces a blocky, grid-like silhouette), this
// greedily places each point at the nearest collision-free slot using the
// chart's own pixel projection (`convertToPixel`/`convertFromPixel`) — the
// same technique ECharts' own beeswarm/packed-scatter examples use — so the
// swarm reads as a continuous organic shape at any density.
const SYMBOL_SIZE = 14;
const GAP = SYMBOL_SIZE * 0.92; // slight overlap reads as a continuous swarm
function beeswarmLayout(ci, values) {
  const basePx = values.map((v) => chart.convertToPixel({ xAxisIndex: 0, yAxisIndex: 0 }, [ci, v]));
  const order = basePx.map((_, i) => i).sort((a, b) => basePx[a][1] - basePx[b][1]);
  const placed = [];
  const finalX = new Array(values.length);
  order.forEach((i) => {
    const [cx, cy] = basePx[i];
    let px = cx;
    let k = 0;
    while (k < 200 && placed.some((p) => Math.hypot(p.x - px, p.y - cy) < GAP)) {
      k += 1;
      const step = Math.ceil(k / 2);
      const side = k % 2 === 1 ? 1 : -1;
      px = cx + side * step * GAP;
    }
    placed.push({ x: px, y: cy });
    finalX[i] = chart.convertFromPixel({ xAxisIndex: 0, yAxisIndex: 0 }, [px, cy])[0];
  });
  return finalX;
}

const pointSeries = groups.map((g, ci) => {
  const values = groupValues[ci];
  const xs = beeswarmLayout(ci, values);
  return {
    name: g.name,
    type: "scatter",
    data: values.map((v, i) => [xs[i], v]),
    symbolSize: SYMBOL_SIZE,
    itemStyle: { color: t.palette[ci], opacity: 0.8 },
  };
});

const meanSeries = {
  name: "Group mean",
  type: "scatter",
  data: groups.map((g, ci) => [ci, g.mean]),
  symbol: "diamond",
  symbolSize: 24,
  itemStyle: { color: t.ink, borderColor: t.pageBg, borderWidth: 2 },
  z: 3,
};

chart.setOption({ series: [...pointSeries, meanSeries] });
Runnable source as JSON, for any HTTP client: https://api.anyplot.ai/specs/swarm-basic/echarts/code. Any spec id and library id listed in llms-full.txt fit the same URL shape; every URL below is complete and callable.
{
  "spec_id": "swarm-basic",
  "language": "javascript",
  "library": "echarts",
  "page": "https://anyplot.ai/swarm-basic/javascript/echarts",
  "hub": "https://anyplot.ai/swarm-basic",
  "code_json": "https://api.anyplot.ai/specs/swarm-basic/echarts/code",
  "spec_json": "https://api.anyplot.ai/specs/swarm-basic",
  "render_light_png": "https://storage.googleapis.com/anyplot-images/plots/swarm-basic/javascript/echarts/plot-light.png",
  "render_dark_png": "https://storage.googleapis.com/anyplot-images/plots/swarm-basic/javascript/echarts/plot-dark.png",
  "interactive_light_html": "https://storage.googleapis.com/anyplot-images/plots/swarm-basic/javascript/echarts/plot-light.html",
  "interactive_dark_html": "https://storage.googleapis.com/anyplot-images/plots/swarm-basic/javascript/echarts/plot-dark.html",
  "quality_score": 89.0,
  "license": "MIT",
  "guide": "https://anyplot.ai/llms.txt"
}
Part of Basic Swarm Plot on anyplot.ai.