The same plot in 14 other libraries — JavaScript: D3.js, Apache ECharts, Highcharts, MUI X Charts; Python: Altair, Bokeh, lets-plot, Matplotlib, Plotly, plotnine, Pygal, Seaborn; R: ggplot2; Julia: Makie.jl. Compare all 15 side by side: UpSet Plot for Multi-Set Intersection Analysis in Python, R, Julia and JavaScript.
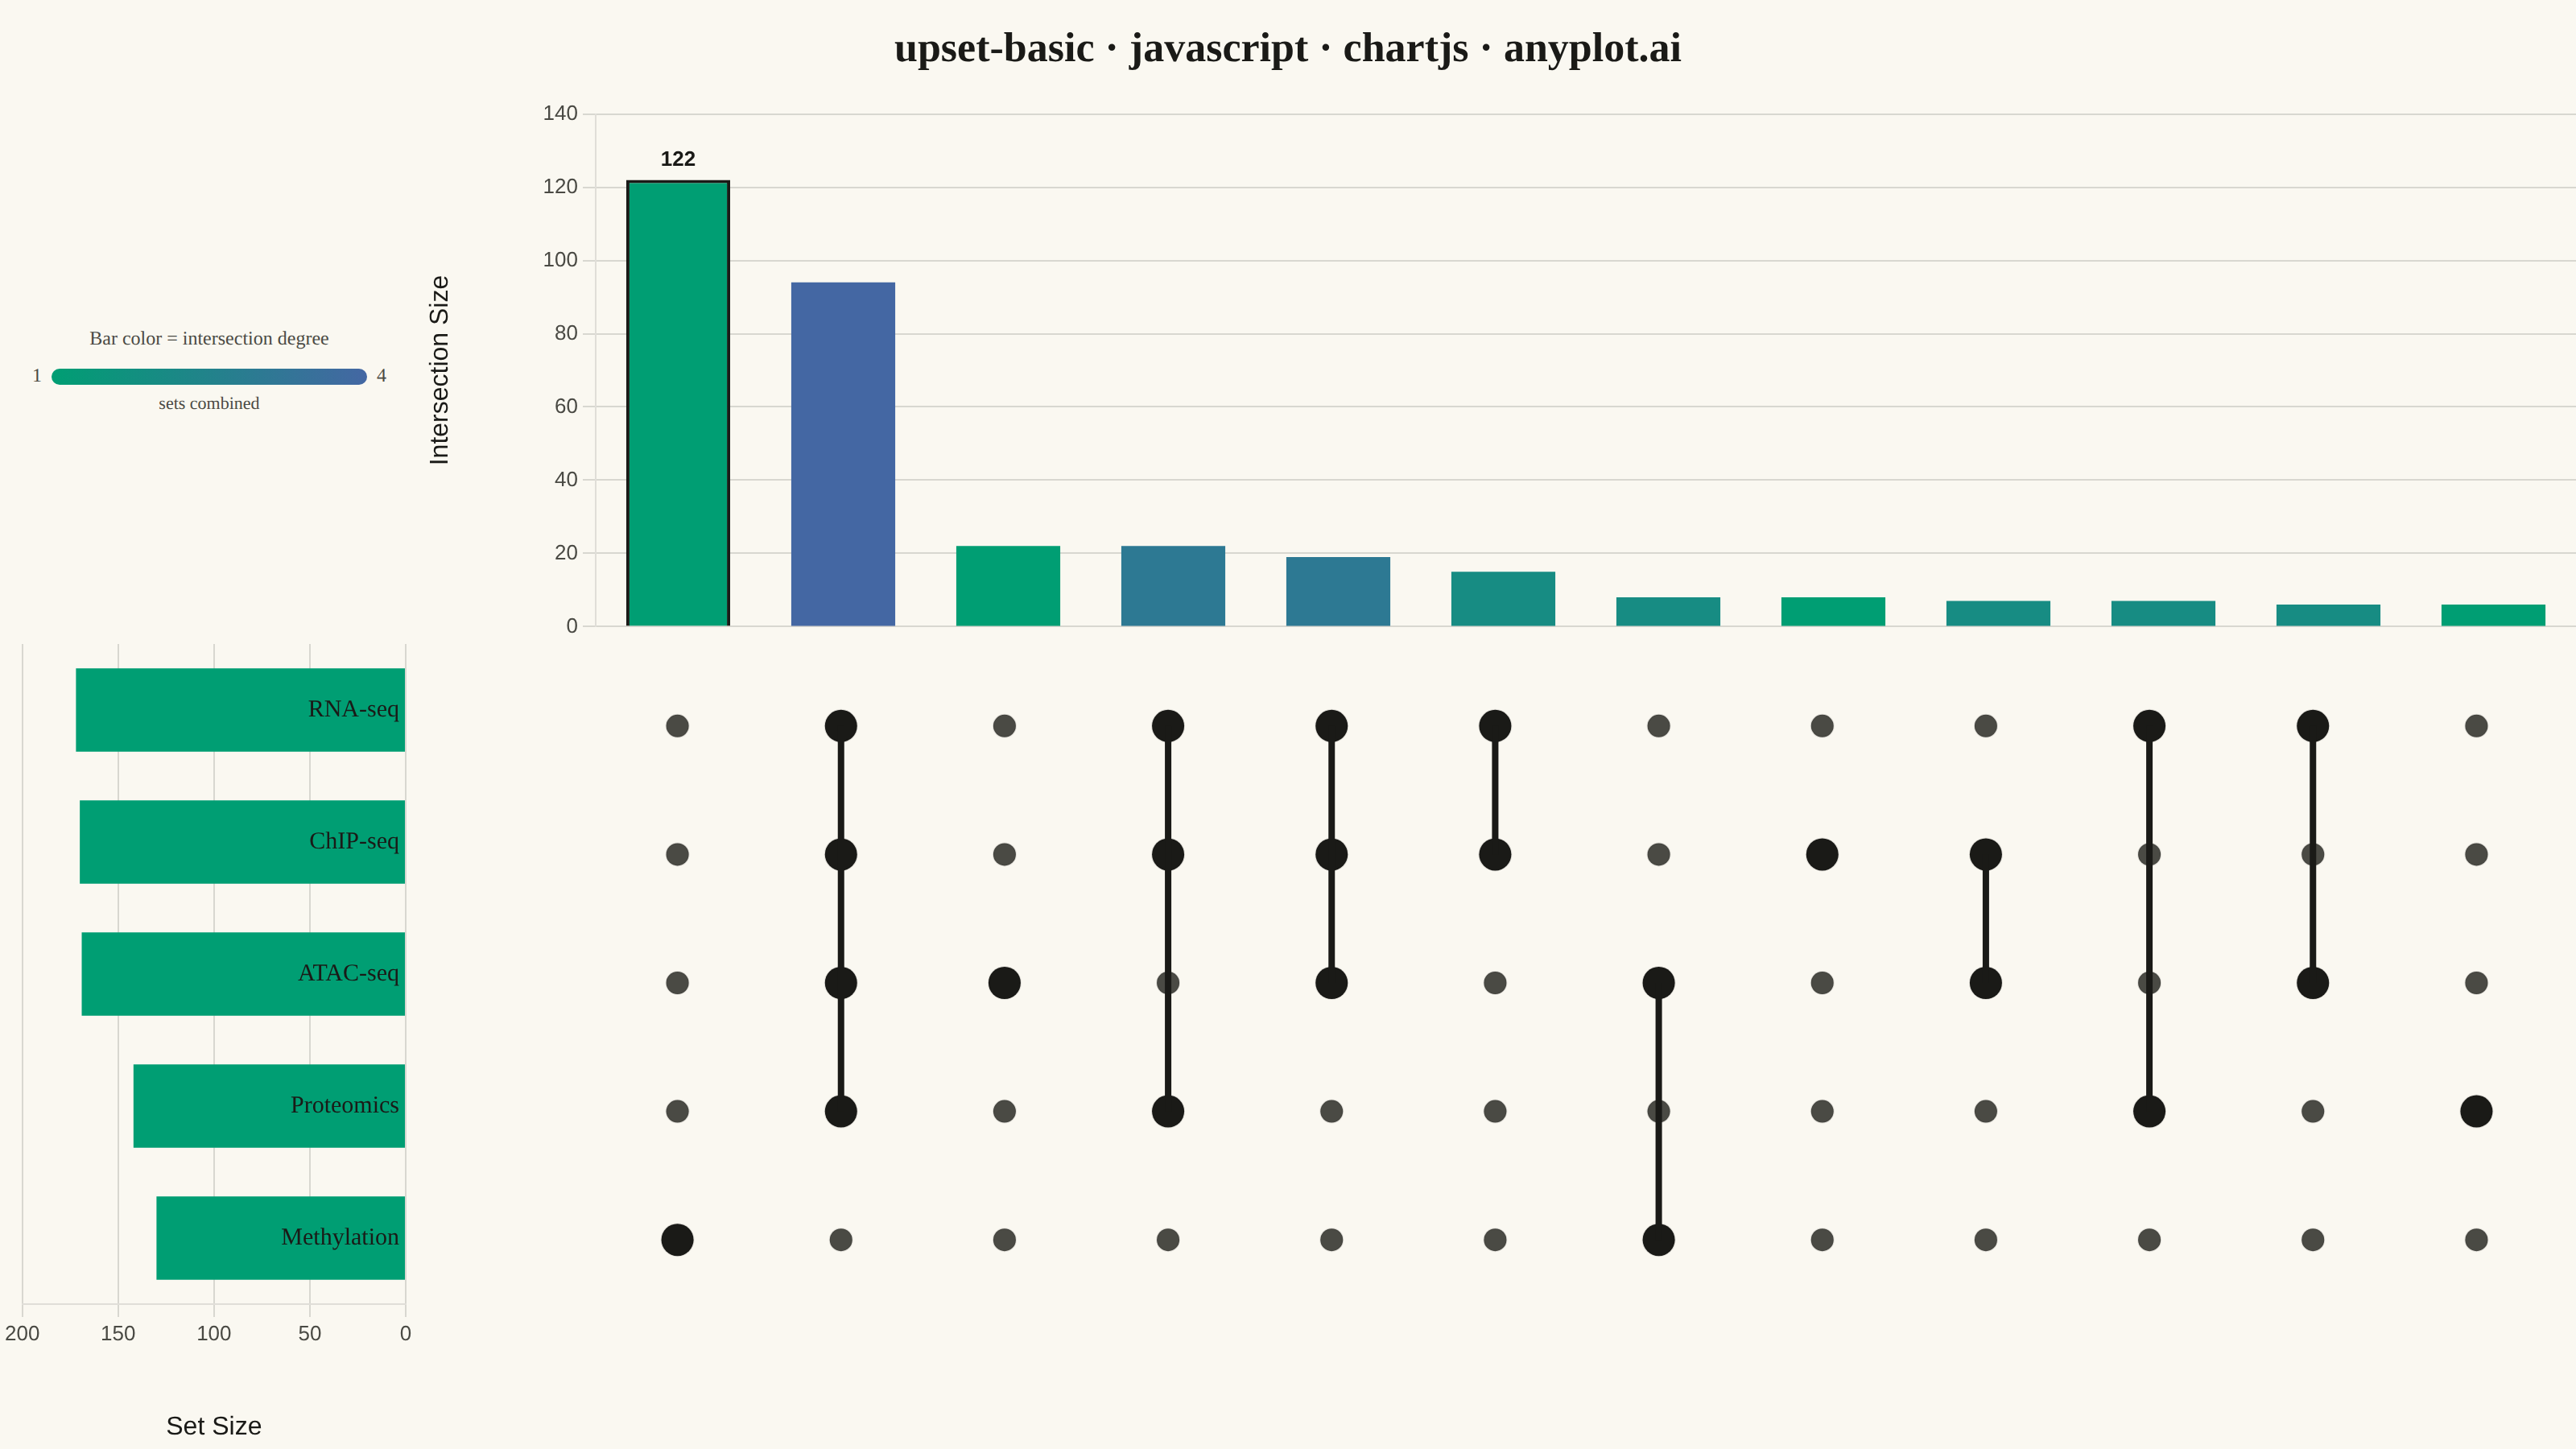
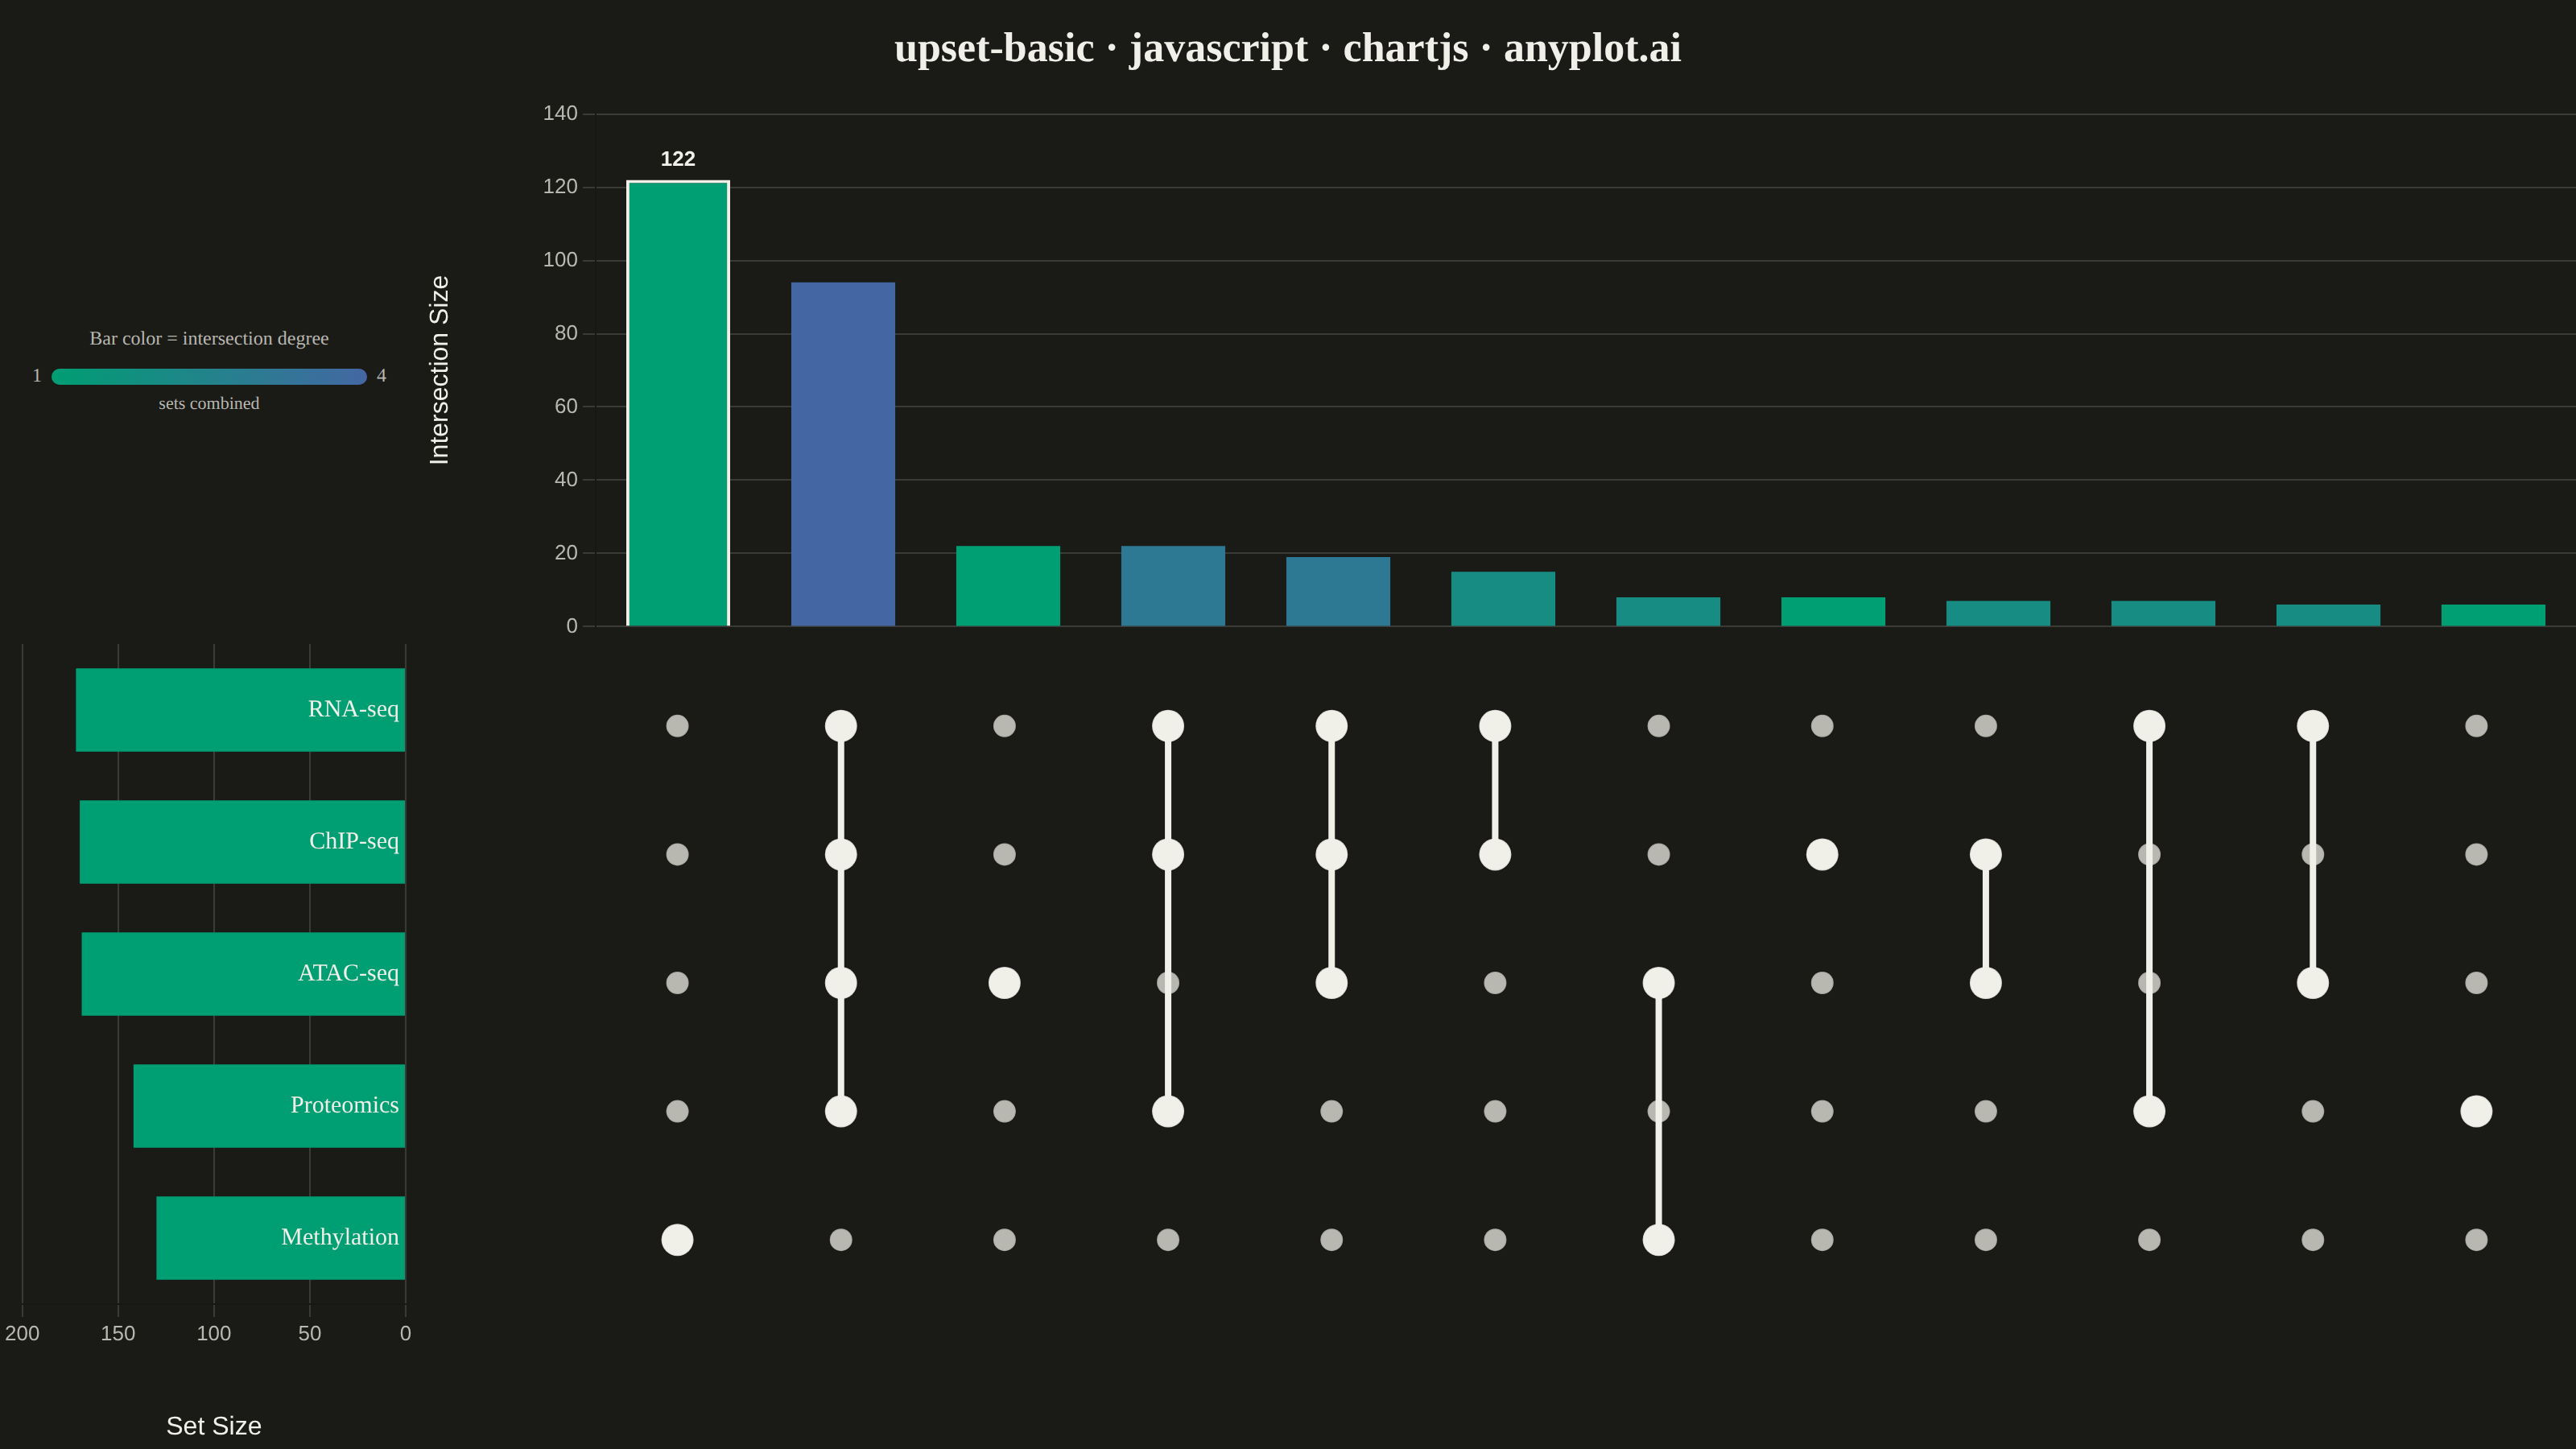
An UpSet plot visualizes intersections of multiple sets using a matrix-based layout that scales far better than Venn diagrams beyond 3 sets. A horizontal bar chart shows individual set sizes, a dot-matrix indicates which sets participate in each intersection, and a vertical bar chart above shows the intersection cardinality. This is the modern standard for set intersection analysis, making complex overlaps between many sets immediately readable.
// anyplot.ai
// upset-basic: UpSet Plot for Multi-Set Intersection Analysis
// Library: chartjs 4.4.7 | JavaScript 22.23.2
// Quality: 93/100 | Created: 2026-09-09

//# anyplot-orientation: landscape
const t = window.ANYPLOT_TOKENS;

// --- Data (in-memory, deterministic LCG) ------------------------------------
// Five differential-expression experiments run on the same 400-gene panel.
// A latent per-gene "regulatory activity" score drives correlated membership
// across experiments (RNA-seq/ChIP-seq/ATAC-seq/Proteomics track activity,
// Methylation is enriched in low-activity regions), producing realistic,
// unevenly sized overlaps to visualize.
let seed = 42;
function lcgRandom() {
  seed = (seed * 1664525 + 1013904223) % 4294967296;
  return seed / 4294967296;
}

const SET_NAMES = ["RNA-seq", "ChIP-seq", "ATAC-seq", "Proteomics", "Methylation"];
const N_GENES = 400;
const membership = [];
for (let i = 0; i < N_GENES; i++) {
  const activity = lcgRandom();
  const noise = [lcgRandom(), lcgRandom(), lcgRandom(), lcgRandom(), lcgRandom()];
  membership.push([
    activity * 0.75 + noise[0] * 0.25 > 0.55,
    activity * 0.7 + noise[1] * 0.3 > 0.58,
    activity * 0.55 + noise[2] * 0.45 > 0.55,
    activity * 0.65 + noise[3] * 0.35 > 0.6,
    (1 - activity) * 0.7 + noise[4] * 0.3 > 0.62,
  ]);
}

// Sets ordered by total membership, descending — this fixes the row order
// shared by the left bar chart and the dot matrix.
const setOrder = SET_NAMES.map((_, si) => si).sort(
  (a, b) => membership.filter((m) => m[b]).length - membership.filter((m) => m[a]).length
);
const orderedSetNames = setOrder.map((si) => SET_NAMES[si]);
const setTotals = setOrder.map((si) => membership.filter((m) => m[si]).length);

// Exclusive intersections (an element counts only for the exact combination of
// sets it belongs to), sorted by size descending — the spec's default order.
const comboCounts = new Map();
for (const m of membership) {
  const key = setOrder.map((si) => (m[si] ? 1 : 0)).join("");
  if (key === "0".repeat(SET_NAMES.length)) continue;
  comboCounts.set(key, (comboCounts.get(key) || 0) + 1);
}
const MAX_INTERSECTIONS = 12;
const topCombos = [...comboCounts.entries()]
  .sort((a, b) => b[1] - a[1])
  .slice(0, MAX_INTERSECTIONS);
const colLabels = topCombos.map((_, i) => `c${i}`);
const colCounts = topCombos.map(([, count]) => count);
const colDegrees = topCombos.map(([key]) => key.split("").filter((c) => c === "1").length);
const maxDegree = Math.max(...colDegrees);
const minDegree = Math.min(...colDegrees);

function lerpColor(hexA, hexB, frac) {
  const a = [1, 3, 5].map((p) => parseInt(hexA.slice(p, p + 2), 16));
  const b = [1, 3, 5].map((p) => parseInt(hexB.slice(p, p + 2), 16));
  const c = a.map((v, i) => Math.round(v + (b[i] - v) * frac));
  return `rgb(${c[0]}, ${c[1]}, ${c[2]})`;
}

// Bar color per intersection encodes degree (sets involved) along the Imprint
// sequential ramp — a continuous, ordinal signal, not a categorical one.
const colColors = colDegrees.map((d) => {
  const frac = maxDegree === minDegree ? 0 : (d - minDegree) / (maxDegree - minDegree);
  return lerpColor(t.seq[0], t.seq[1], frac);
});

// Matrix dot data: member dots (dark), non-member dots (faint), and one
// connector segment per multi-set intersection spanning its member rows.
const memberDots = [];
const otherDots = [];
const connectors = [];
topCombos.forEach(([key], ci) => {
  const bits = key.split("").map((c) => c === "1");
  const memberRows = [];
  bits.forEach((isMember, ri) => {
    const point = { x: colLabels[ci], y: orderedSetNames[ri] };
    if (isMember) {
      memberDots.push(point);
      memberRows.push(ri);
    } else {
      otherDots.push(point);
    }
  });
  if (memberRows.length >= 2) {
    const top = Math.min(...memberRows);
    const bottom = Math.max(...memberRows);
    connectors.push({
      x: colLabels[ci],
      top: orderedSetNames[top],
      bottom: orderedSetNames[bottom],
    });
  }
});
const connectorDatasets = connectors.map((c) => ({
  type: "line",
  data: [
    { x: c.x, y: c.top },
    { x: c.x, y: c.bottom },
  ],
  showLine: true,
  borderColor: t.ink,
  borderWidth: 4,
  pointRadius: 0,
  order: 1,
}));

// --- Layout ------------------------------------------------------------------
// Fixed reserves (CSS px) shared between the visible bar-chart axes and the
// hidden matching axes of the matrix, so all three panels line up pixel-for-
// pixel (same technique as the scatter-marginal chartjs implementation).
const TITLE_SIZE = 60;
const Y_AXIS_RESERVE = 110; // top bar chart's count axis (+ title) width
const X_AXIS_RESERVE = 90; // left bar chart's count axis (+ title) height
const LEFT_LABEL_WIDTH = 260; // set-name column width
const TOP_BAR_HEIGHT = 340;

const container = document.getElementById("container");
container.style.display = "grid";
container.style.gridTemplateColumns = `${LEFT_LABEL_WIDTH}px 1fr`;
container.style.gridTemplateRows = `${TITLE_SIZE}px ${TOP_BAR_HEIGHT}px 1fr`;
container.style.fontFamily = "inherit";

const titleCell = document.createElement("div");
titleCell.style.gridColumn = "1 / span 2";
titleCell.style.display = "flex";
titleCell.style.alignItems = "center";
titleCell.style.justifyContent = "center";
titleCell.style.color = t.ink;
titleCell.style.fontSize = "26px";
titleCell.style.fontWeight = "600";
titleCell.textContent = "upset-basic · javascript · chartjs · anyplot.ai";
container.appendChild(titleCell);

const cornerCell = document.createElement("div");
const topCell = document.createElement("div");
const leftCell = document.createElement("div");
const matrixCell = document.createElement("div");
[cornerCell, topCell, leftCell, matrixCell].forEach((cell) => {
  cell.style.position = "relative";
  cell.style.width = "100%";
  cell.style.height = "100%";
});
container.appendChild(cornerCell);
container.appendChild(topCell);
container.appendChild(leftCell);
container.appendChild(matrixCell);

// Mini legend explaining the intersection-bar degree gradient, placed in the
// otherwise-empty corner cell above the set-name column.
cornerCell.style.display = "flex";
cornerCell.style.flexDirection = "column";
cornerCell.style.justifyContent = "center";
cornerCell.style.alignItems = "stretch";
cornerCell.style.boxSizing = "border-box";
cornerCell.style.padding = "0 20px";

const legendCaption = document.createElement("div");
legendCaption.style.color = t.inkSoft;
legendCaption.style.fontSize = "12px";
legendCaption.style.textAlign = "center";
legendCaption.style.marginBottom = "8px";
legendCaption.textContent = "Bar color = intersection degree";
cornerCell.appendChild(legendCaption);

const legendRow = document.createElement("div");
legendRow.style.display = "flex";
legendRow.style.alignItems = "center";
legendRow.style.gap = "6px";

const minDegreeLabel = document.createElement("span");
minDegreeLabel.style.color = t.inkSoft;
minDegreeLabel.style.fontSize = "12px";
minDegreeLabel.textContent = String(minDegree);

const gradientSwatch = document.createElement("div");
gradientSwatch.style.flex = "1";
gradientSwatch.style.height = "10px";
gradientSwatch.style.borderRadius = "5px";
gradientSwatch.style.background = `linear-gradient(to right, ${t.seq[0]}, ${t.seq[1]})`;

const maxDegreeLabel = document.createElement("span");
maxDegreeLabel.style.color = t.inkSoft;
maxDegreeLabel.style.fontSize = "12px";
maxDegreeLabel.textContent = String(maxDegree);

legendRow.appendChild(minDegreeLabel);
legendRow.appendChild(gradientSwatch);
legendRow.appendChild(maxDegreeLabel);
cornerCell.appendChild(legendRow);

const legendSub = document.createElement("div");
legendSub.style.color = t.inkSoft;
legendSub.style.fontSize = "11px";
legendSub.style.textAlign = "center";
legendSub.style.marginTop = "4px";
legendSub.textContent = "sets combined";
cornerCell.appendChild(legendSub);

function makeCanvas(cell) {
  const canvas = document.createElement("canvas");
  cell.appendChild(canvas);
  return canvas;
}

// --- Top: intersection cardinality -----------------------------------------
// The largest intersection (index 0, since topCombos is sorted descending)
// gets a bold outline plus its exact count drawn above the bar — a small
// storytelling touch that anchors the size hierarchy beyond color/sort alone.
const colBorderColors = colCounts.map((_, i) => (i === 0 ? t.ink : "transparent"));
const colBorderWidths = colCounts.map((_, i) => (i === 0 ? 2 : 0));

new Chart(makeCanvas(topCell), {
  type: "bar",
  data: {
    labels: colLabels,
    datasets: [
      {
        data: colCounts,
        backgroundColor: colColors,
        borderColor: colBorderColors,
        borderWidth: colBorderWidths,
        barPercentage: 0.7,
        categoryPercentage: 0.9,
      },
    ],
  },
  plugins: [
    {
      id: "largestIntersectionLabel",
      afterDatasetsDraw(chart) {
        const bar = chart.getDatasetMeta(0).data[0];
        if (!bar) return;
        const { ctx } = chart;
        ctx.save();
        ctx.fillStyle = t.ink;
        ctx.font = "bold 13px sans-serif";
        ctx.textAlign = "center";
        ctx.textBaseline = "bottom";
        ctx.fillText(String(colCounts[0]), bar.x, bar.y - 6);
        ctx.restore();
      },
    },
  ],
  options: {
    responsive: true,
    maintainAspectRatio: false,
    animation: false,
    plugins: { legend: { display: false } },
    scales: {
      x: {
        type: "category",
        offset: true,
        display: true,
        ticks: { display: false },
        grid: { display: false },
        border: { display: false },
        afterFit: (scale) => {
          scale.height = 0;
        },
      },
      y: {
        type: "linear",
        beginAtZero: true,
        title: { display: true, text: "Intersection Size", color: t.ink, font: { size: 16 } },
        ticks: { color: t.inkSoft, font: { size: 13 } },
        grid: { color: t.grid },
        afterFit: (scale) => {
          scale.width = Y_AXIS_RESERVE;
        },
      },
    },
  },
});

// --- Left: individual set size ----------------------------------------------
new Chart(makeCanvas(leftCell), {
  type: "bar",
  data: {
    labels: orderedSetNames,
    datasets: [
      {
        data: setTotals,
        backgroundColor: t.palette[0],
        borderWidth: 0,
        barPercentage: 0.7,
        categoryPercentage: 0.9,
      },
    ],
  },
  options: {
    indexAxis: "y",
    responsive: true,
    maintainAspectRatio: false,
    animation: false,
    plugins: { legend: { display: false } },
    scales: {
      x: {
        type: "linear",
        beginAtZero: true,
        reverse: true,
        title: { display: true, text: "Set Size", color: t.ink, font: { size: 16 } },
        ticks: { color: t.inkSoft, font: { size: 13 } },
        grid: { color: t.grid },
        afterFit: (scale) => {
          scale.height = X_AXIS_RESERVE;
        },
      },
      y: {
        type: "category",
        offset: true,
        position: "right",
        ticks: { display: false },
        grid: { display: false },
        border: { display: false },
      },
    },
  },
});

// Set-name labels drawn as plain DOM text next to the (reversed) horizontal
// bars — keeps the label column width independent of Chart.js's own category
// axis so it never competes for the shared LEFT_LABEL_WIDTH reserve.
const labelLayer = document.createElement("div");
labelLayer.style.position = "absolute";
labelLayer.style.inset = "0";
labelLayer.style.display = "flex";
labelLayer.style.flexDirection = "column";
labelLayer.style.pointerEvents = "none";
labelLayer.style.paddingBottom = `${X_AXIS_RESERVE}px`;
orderedSetNames.forEach((name) => {
  const row = document.createElement("div");
  row.style.flex = "1";
  row.style.display = "flex";
  row.style.alignItems = "center";
  row.style.justifyContent = "flex-end";
  row.style.paddingRight = "12px";
  row.style.color = t.ink;
  row.style.fontSize = "15px";
  row.textContent = name;
  labelLayer.appendChild(row);
});
leftCell.appendChild(labelLayer);

// --- Matrix: set-membership dots + connectors -------------------------------
new Chart(makeCanvas(matrixCell), {
  type: "scatter",
  data: {
    datasets: [
      ...connectorDatasets,
      {
        type: "scatter",
        label: "Not in intersection",
        data: otherDots,
        backgroundColor: t.inkSoft,
        pointRadius: 7,
        pointStyle: "circle",
        order: 2,
      },
      {
        type: "scatter",
        label: "In intersection",
        data: memberDots,
        backgroundColor: t.ink,
        pointRadius: 10,
        pointStyle: "circle",
        order: 3,
      },
    ],
  },
  options: {
    responsive: true,
    maintainAspectRatio: false,
    animation: false,
    plugins: { legend: { display: false } },
    scales: {
      x: {
        type: "category",
        labels: colLabels,
        offset: true,
        display: true,
        ticks: { display: false },
        grid: { display: false },
        border: { display: false },
        afterFit: (scale) => {
          scale.height = X_AXIS_RESERVE;
        },
      },
      y: {
        type: "category",
        labels: orderedSetNames,
        offset: true,
        display: true,
        ticks: { display: false },
        grid: { display: false },
        border: { display: false },
        afterFit: (scale) => {
          scale.width = Y_AXIS_RESERVE;
        },
      },
    },
  },
});
Runnable source as JSON, for any HTTP client: https://api.anyplot.ai/specs/upset-basic/chartjs/code. Any spec id and library id listed in llms-full.txt fit the same URL shape; every URL below is complete and callable.
{
  "spec_id": "upset-basic",
  "language": "javascript",
  "library": "chartjs",
  "page": "https://anyplot.ai/upset-basic/javascript/chartjs",
  "hub": "https://anyplot.ai/upset-basic",
  "code_json": "https://api.anyplot.ai/specs/upset-basic/chartjs/code",
  "spec_json": "https://api.anyplot.ai/specs/upset-basic",
  "render_light_png": "https://storage.googleapis.com/anyplot-images/plots/upset-basic/javascript/chartjs/plot-light.png",
  "render_dark_png": "https://storage.googleapis.com/anyplot-images/plots/upset-basic/javascript/chartjs/plot-dark.png",
  "interactive_light_html": "https://storage.googleapis.com/anyplot-images/plots/upset-basic/javascript/chartjs/plot-light.html",
  "interactive_dark_html": "https://storage.googleapis.com/anyplot-images/plots/upset-basic/javascript/chartjs/plot-dark.html",
  "quality_score": 93.0,
  "license": "MIT",
  "guide": "https://anyplot.ai/llms.txt"
}
Part of UpSet Plot for Multi-Set Intersection Analysis on anyplot.ai.