The same plot in 14 other libraries — JavaScript: Chart.js, D3.js, Apache ECharts, MUI X Charts; Python: Altair, Bokeh, lets-plot, Matplotlib, Plotly, plotnine, Pygal, Seaborn; R: ggplot2; Julia: Makie.jl. Compare all 15 side by side: UpSet Plot for Multi-Set Intersection Analysis in Python, R, Julia and JavaScript.
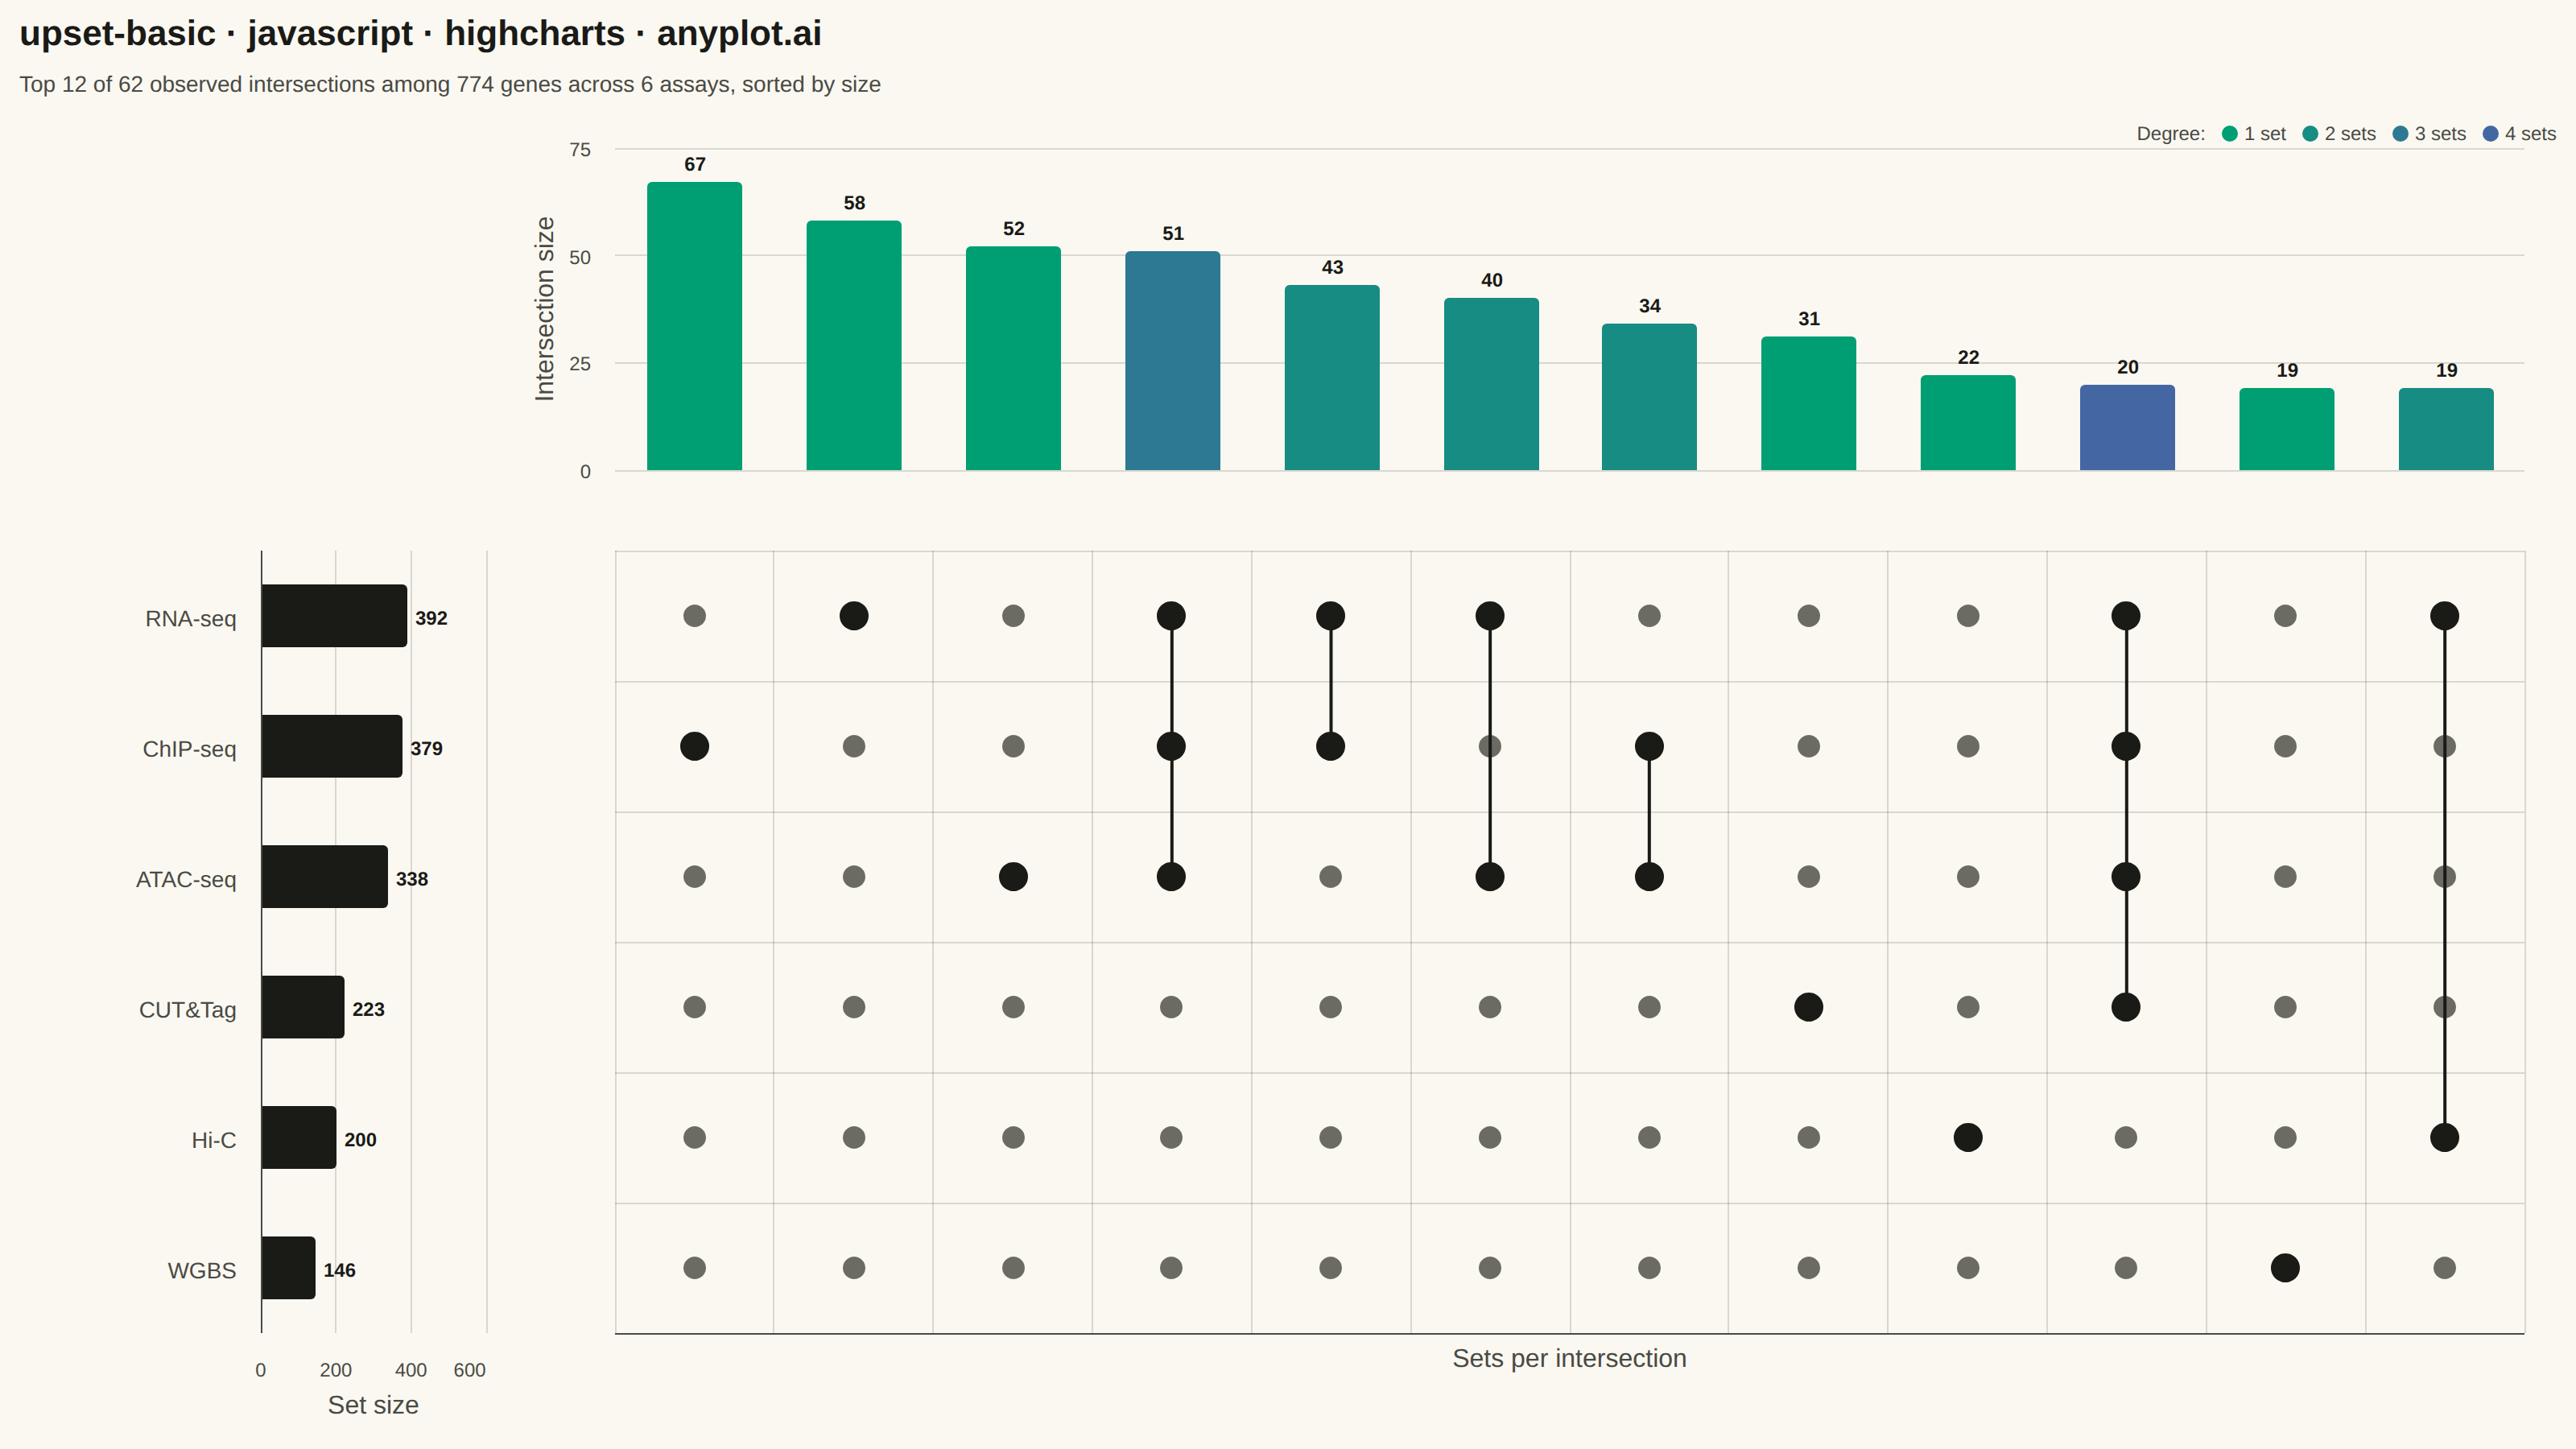
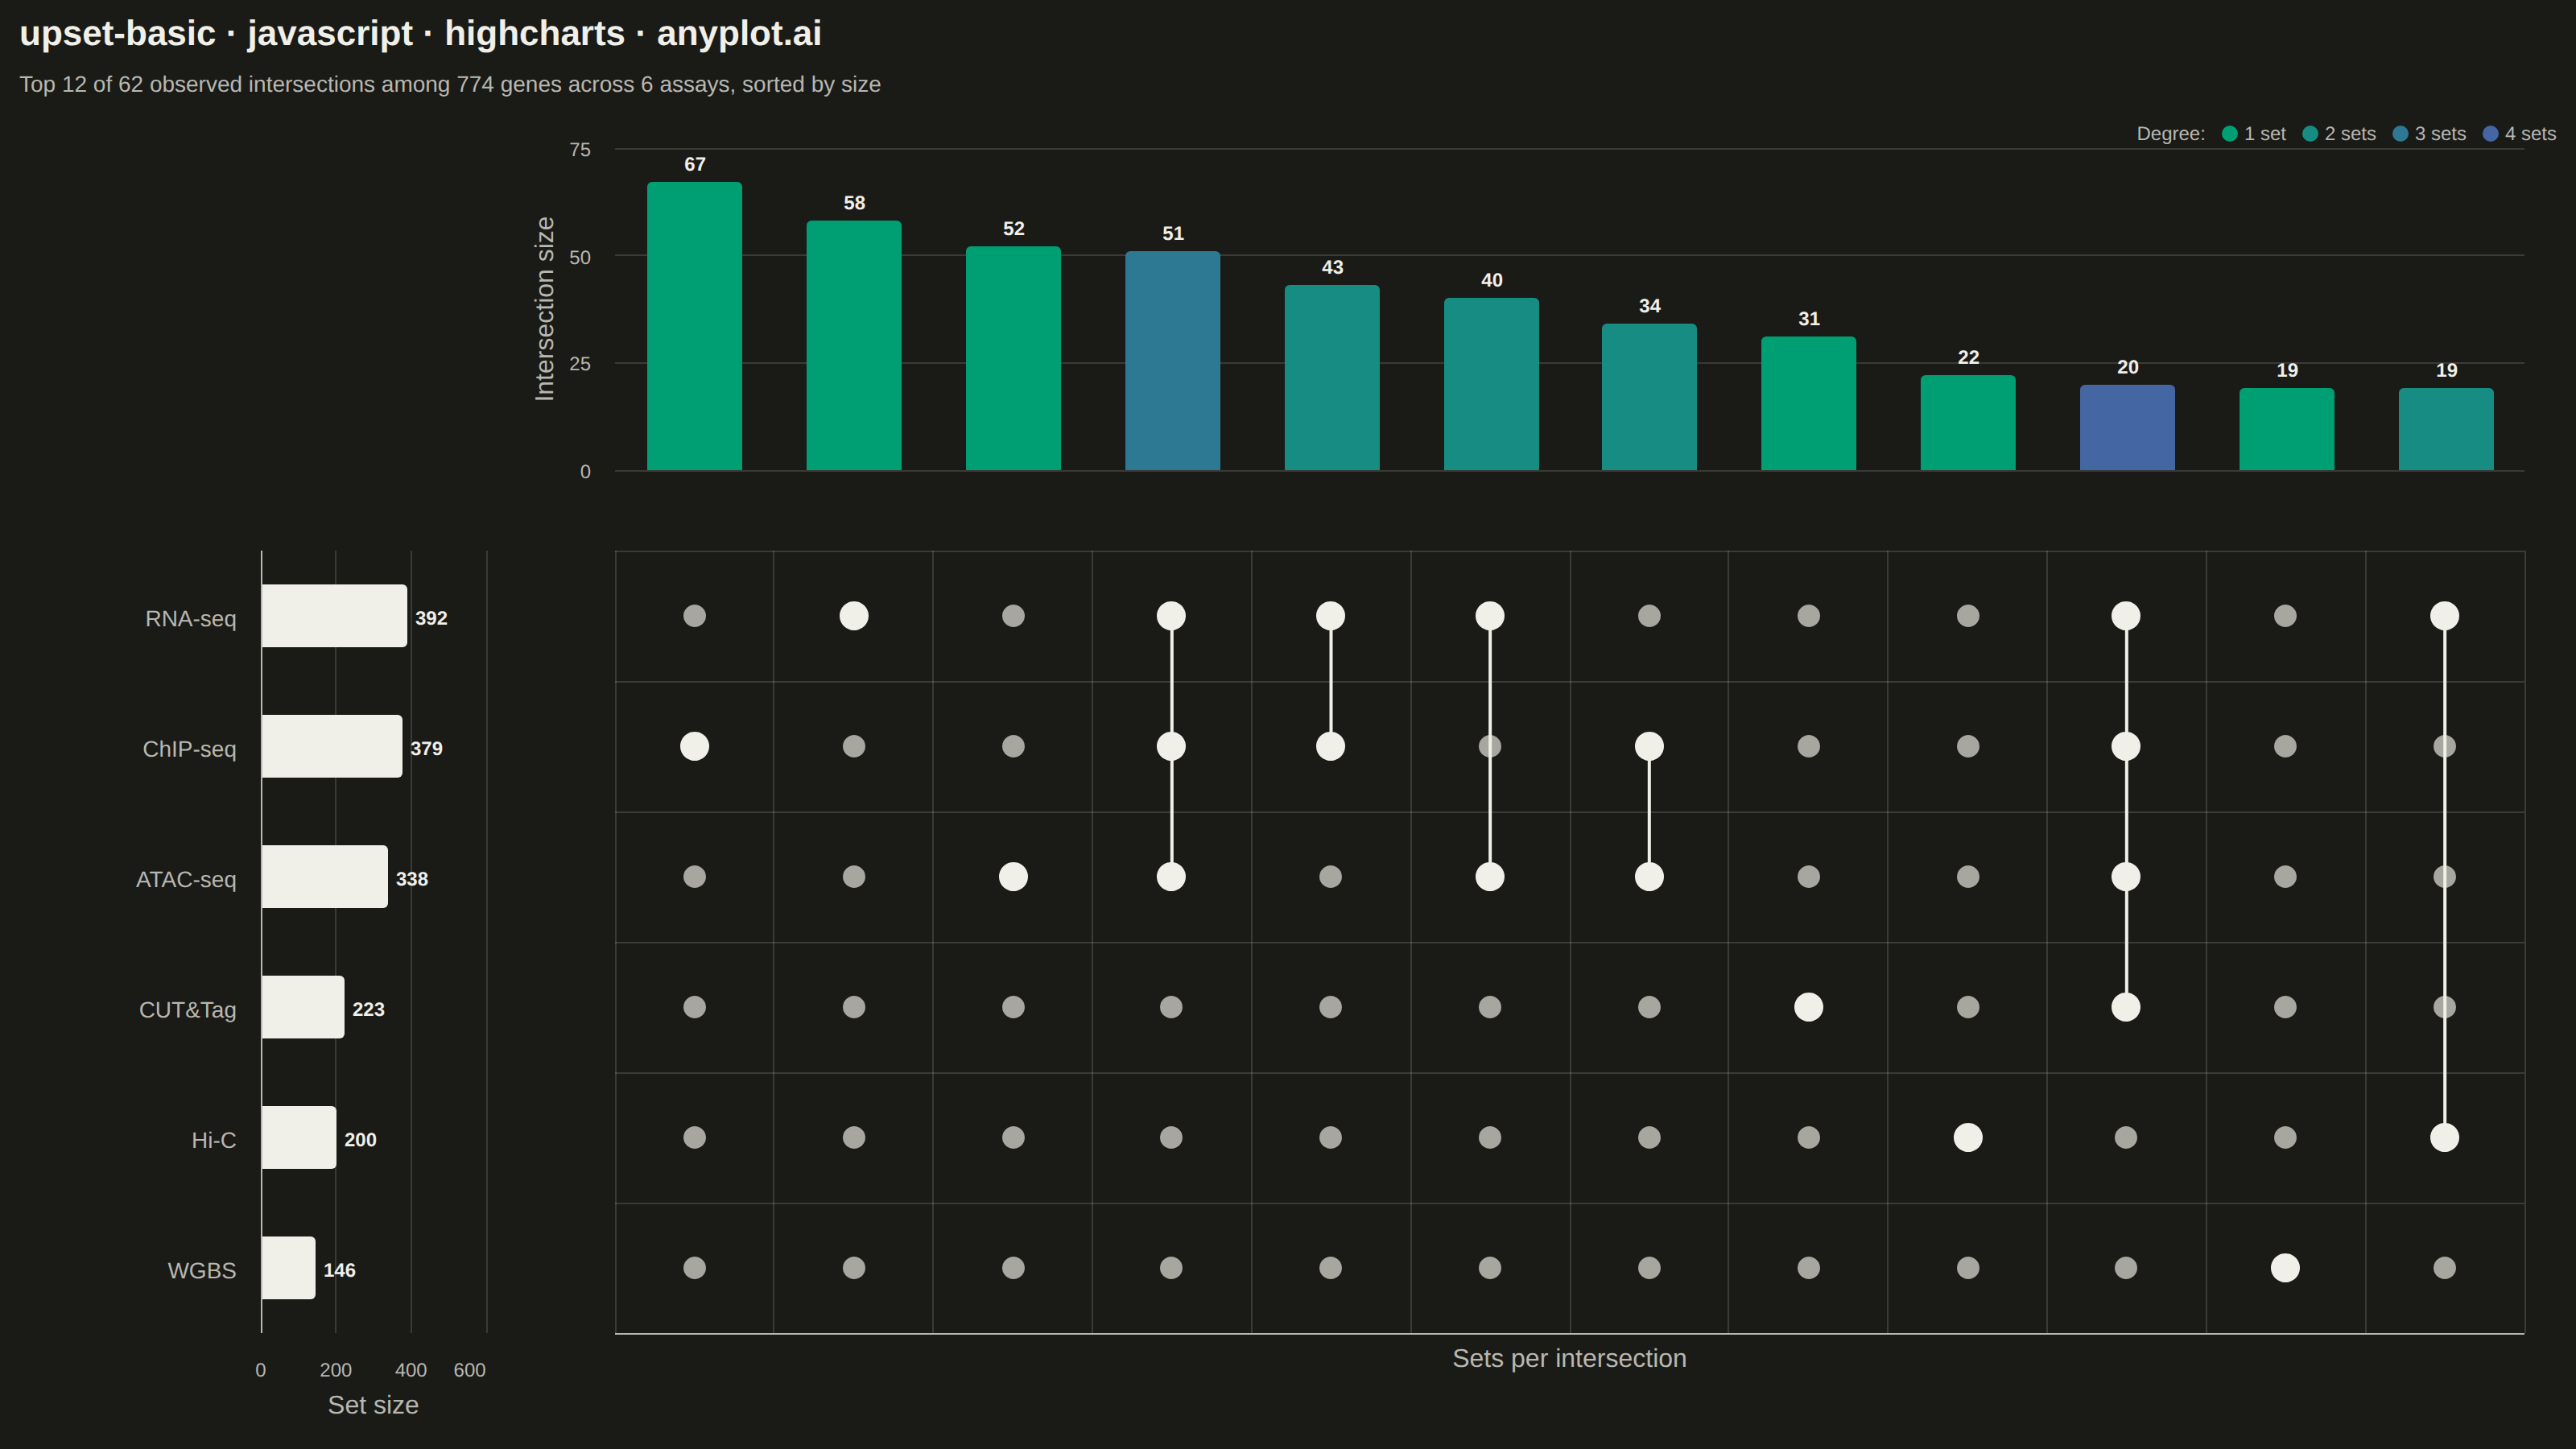
An UpSet plot visualizes intersections of multiple sets using a matrix-based layout that scales far better than Venn diagrams beyond 3 sets. A horizontal bar chart shows individual set sizes, a dot-matrix indicates which sets participate in each intersection, and a vertical bar chart above shows the intersection cardinality. This is the modern standard for set intersection analysis, making complex overlaps between many sets immediately readable.
// anyplot.ai
// upset-basic: UpSet Plot for Multi-Set Intersection Analysis
// Library: highcharts 12.6.0 | JavaScript 22.23.2
// Quality: 93/100 | Created: 2026-09-09
//# anyplot-orientation: landscape

const t = window.ANYPLOT_TOKENS;
// "muted" is a style-guide semantic anchor (other/rest, background layer) that the
// harness doesn't expose as its own token — only its two theme-adaptive hexes are
// documented, so they're hard-coded here rather than derived from `t`.
const MUTED = t.theme === "dark" ? "#A8A79F" : "#6B6A63";
const NEUTRAL = t.ink; // totals / baseline anchor — same hex as structural chrome

// --- Deterministic data (in-memory, no network) -----------------------------
// Small fixed-seed LCG; Node/browser has no seeded RNG built in.
function makeLCG(seed) {
  let s = seed >>> 0;
  return () => {
    s = (Math.imul(s, 1664525) + 1013904223) >>> 0;
    return s / 4294967296;
  };
}
const rand = makeLCG(20260909);

// Six genomic assays profiling the same gene pool (spec's own example scenario).
const SET_NAMES_RAW = ["RNA-seq", "ChIP-seq", "ATAC-seq", "CUT&Tag", "Hi-C", "WGBS"];
const N_SETS = SET_NAMES_RAW.length;
const N_CANDIDATES = 900;
const BASE_P = [0.34, 0.3, 0.28, 0.2, 0.16, 0.14];

const comboCounts = new Map();
const setSizeRaw = new Array(N_SETS).fill(0);
let totalGenes = 0;

for (let i = 0; i < N_CANDIDATES; i++) {
  // Two correlated biological signatures create realistic, sizeable overlaps
  // instead of a flat independent-draw distribution.
  const activePromoter = rand() < 0.22; // RNA-seq + ChIP-seq + ATAC-seq co-signal
  const chromatinLoop = rand() < 0.16; // CUT&Tag + Hi-C co-signal, weakly extends to WGBS
  const members = [];
  for (let s = 0; s < N_SETS; s++) {
    let p = BASE_P[s];
    if (activePromoter && s <= 2) p += 0.42;
    if (chromatinLoop && (s === 3 || s === 4)) p += 0.4;
    if (chromatinLoop && s === 5) p += 0.22;
    if (rand() < Math.min(p, 0.93)) members.push(s);
  }
  if (members.length === 0) continue;
  totalGenes++;
  members.forEach((s) => setSizeRaw[s]++);
  const key = members.join(",");
  comboCounts.set(key, (comboCounts.get(key) || 0) + 1);
}

// Sets ordered largest-first (top-to-bottom in the matrix), the UpSet convention.
const order = SET_NAMES_RAW.map((_, i) => i).sort((a, b) => setSizeRaw[b] - setSizeRaw[a]);
const setNames = order.map((i) => SET_NAMES_RAW[i]);
const setSizes = order.map((i) => setSizeRaw[i]);
const rankOf = new Array(N_SETS);
order.forEach((rawIdx, newIdx) => (rankOf[rawIdx] = newIdx));

const combos = Array.from(comboCounts.entries()).map(([key, count]) => {
  const members = key
    .split(",")
    .map(Number)
    .map((r) => rankOf[r])
    .sort((a, b) => a - b);
  return { members, degree: members.length, count };
});
combos.sort((a, b) => b.count - a.count || a.degree - b.degree);

// Cap columns to the top 12 by size (default sort per spec) — beyond that the
// matrix gets unreadably narrow at this canvas width.
const intersections = combos.slice(0, Math.min(12, combos.length));
const nCols = intersections.length;
const colLabels = intersections.map((iv) => String(iv.degree));

function hexToRgb(hex) {
  const n = parseInt(hex.slice(1), 16);
  return [(n >> 16) & 255, (n >> 8) & 255, n & 255];
}
function lerpColor(hexA, hexB, frac) {
  const a = hexToRgb(hexA);
  const b = hexToRgb(hexB);
  const c = a.map((v, i) => Math.round(v + (b[i] - v) * frac));
  return `rgb(${c[0]},${c[1]},${c[2]})`;
}
const minDeg = Math.min(...intersections.map((iv) => iv.degree));
const maxDeg = Math.max(...intersections.map((iv) => iv.degree));
const degreeSpan = maxDeg - minDeg || 1;
function degreeColor(degree) {
  return lerpColor(t.seq[0], t.seq[1], (degree - minDeg) / degreeSpan);
}

// --- Layout: three synced Highcharts panes inside #container -----------------
// Highcharts core has no built-in "UpSet" type, so the plot is composed from a
// column chart (top), a bar chart (left) and a scatter+line matrix (main), each
// its own Highcharts.chart instance. Row/column alignment across instances is
// guaranteed by giving the paired charts *identical* left/right (columns) or
// top/bottom (rows) pixel margins and matching div sizes — never derived from
// axis-label auto-sizing, which could drift between instances.
const root = document.getElementById("container");

const PAD = 12;
const TITLE_TOP = 8;
const TITLE_H = 34;
const SUBTITLE_TOP = 44;
const SUBTITLE_H = 20;
const CHART_TOP = 72;
const CHART_BOTTOM = 888;
const LEFT_COL_W = 300;
const TOP_ROW_H = 260;

const chartLeft = PAD;
const chartRight = 1600 - PAD;
const chartAreaW = chartRight - chartLeft;
const chartAreaH = CHART_BOTTOM - CHART_TOP;

const rightW = chartAreaW - LEFT_COL_W;
const bottomH = chartAreaH - TOP_ROW_H;

function makeDiv(x, y, w, h) {
  const el = document.createElement("div");
  el.style.position = "absolute";
  el.style.left = `${x}px`;
  el.style.top = `${y}px`;
  el.style.width = `${w}px`;
  el.style.height = `${h}px`;
  root.appendChild(el);
  return el;
}

// Compact swatch legend decoding the top-bar degree gradient — sits in the
// column chart's own top margin (20px), so it never overlaps the bars.
const degreesShown = Array.from(new Set(intersections.map((iv) => iv.degree))).sort((a, b) => a - b);
const legendW = 60 + degreesShown.length * 64;
const legendDiv = makeDiv(chartRight - legendW, CHART_TOP + 2, legendW, 18);
legendDiv.style.display = "flex";
legendDiv.style.alignItems = "center";
legendDiv.style.justifyContent = "flex-end";
legendDiv.style.gap = "10px";
legendDiv.style.fontSize = "12px";
legendDiv.style.color = t.inkSoft;
legendDiv.style.whiteSpace = "nowrap";
const legendPrefix = document.createElement("span");
legendPrefix.textContent = "Degree:";
legendDiv.appendChild(legendPrefix);
degreesShown.forEach((d) => {
  const item = document.createElement("span");
  item.style.display = "inline-flex";
  item.style.alignItems = "center";
  item.style.gap = "4px";
  const swatch = document.createElement("span");
  swatch.style.width = "10px";
  swatch.style.height = "10px";
  swatch.style.borderRadius = "50%";
  swatch.style.backgroundColor = degreeColor(d);
  swatch.style.display = "inline-block";
  const label = document.createElement("span");
  label.textContent = `${d} set${d > 1 ? "s" : ""}`;
  item.appendChild(swatch);
  item.appendChild(label);
  legendDiv.appendChild(item);
});

const titleDiv = makeDiv(chartLeft, TITLE_TOP, chartAreaW, TITLE_H);
titleDiv.style.color = t.ink;
titleDiv.style.fontSize = "22px";
titleDiv.style.fontWeight = "600";
titleDiv.textContent = "upset-basic · javascript · highcharts · anyplot.ai";

const subtitleDiv = makeDiv(chartLeft, SUBTITLE_TOP, chartAreaW, SUBTITLE_H);
subtitleDiv.style.color = t.inkSoft;
subtitleDiv.style.fontSize = "14px";
subtitleDiv.textContent = `Top ${nCols} of ${combos.length} observed intersections among ${totalGenes} genes across ${N_SETS} assays, sorted by size`;

const topDiv = makeDiv(chartLeft + LEFT_COL_W, CHART_TOP, rightW, TOP_ROW_H);
const leftDiv = makeDiv(chartLeft, CHART_TOP + TOP_ROW_H, LEFT_COL_W, bottomH);
const matrixDiv = makeDiv(chartLeft + LEFT_COL_W, CHART_TOP + TOP_ROW_H, rightW, bottomH);

// --- Left pane: horizontal bars for individual set sizes ---------------------
Highcharts.chart(leftDiv, {
  chart: {
    type: "bar",
    backgroundColor: "transparent",
    animation: false,
    margin: [10, 10, 60, 150],
    style: { fontFamily: "inherit" },
  },
  credits: { enabled: false },
  title: { text: null },
  xAxis: {
    categories: setNames,
    reversed: true,
    lineColor: t.inkSoft,
    tickWidth: 0,
    gridLineWidth: 0,
    labels: { style: { color: t.inkSoft, fontSize: "14px" } },
  },
  yAxis: {
    title: { text: "Set size", style: { color: t.inkSoft, fontSize: "16px" } },
    gridLineColor: t.grid,
    gridLineWidth: 1,
    lineColor: t.inkSoft,
    tickColor: t.inkSoft,
    labels: { style: { color: t.inkSoft, fontSize: "12px" } },
  },
  legend: { enabled: false },
  tooltip: {
    formatter() {
      return `<b>${this.point.category}</b><br/>${this.y} genes`;
    },
  },
  plotOptions: {
    series: { animation: false },
    bar: {
      color: NEUTRAL,
      borderWidth: 0,
      dataLabels: {
        enabled: true,
        color: t.ink,
        style: { fontSize: "12px", textOutline: "none" },
      },
    },
  },
  series: [{ name: "Set size", data: setSizes }],
});

// --- Top pane: vertical bars for intersection cardinality --------------------
Highcharts.chart(topDiv, {
  chart: {
    type: "column",
    backgroundColor: "transparent",
    animation: false,
    margin: [20, 20, 40, 70],
    style: { fontFamily: "inherit" },
  },
  credits: { enabled: false },
  title: { text: null },
  xAxis: {
    categories: colLabels,
    lineWidth: 0,
    tickWidth: 0,
    gridLineWidth: 0,
    labels: { enabled: false },
  },
  yAxis: {
    title: { text: "Intersection size", style: { color: t.inkSoft, fontSize: "16px" } },
    gridLineColor: t.grid,
    gridLineWidth: 1,
    lineColor: t.inkSoft,
    tickColor: t.inkSoft,
    labels: { style: { color: t.inkSoft, fontSize: "12px" } },
  },
  legend: { enabled: false },
  tooltip: {
    formatter() {
      const iv = intersections[this.point.index];
      const combo = iv.members.map((r) => setNames[r]).join(" ∩ ");
      return `<b>${combo}</b><br/>${this.y} genes`;
    },
  },
  plotOptions: {
    series: { animation: false },
    column: {
      pointPadding: 0.15,
      groupPadding: 0.08,
      borderWidth: 0,
      dataLabels: {
        enabled: true,
        color: t.ink,
        style: { fontSize: "12px", textOutline: "none" },
      },
    },
  },
  series: [
    {
      name: "Intersection size",
      data: intersections.map((iv) => ({ y: iv.count, color: degreeColor(iv.degree) })),
    },
  ],
});

// --- Main pane: dot matrix + connecting lines --------------------------------
const backgroundDots = [];
for (let r = 0; r < setNames.length; r++) {
  for (let c = 0; c < nCols; c++) backgroundDots.push({ x: c, y: r });
}
const connectorSeries = intersections.map((iv, c) => {
  const label = iv.members.map((r) => setNames[r]).join(" ∩ ");
  return {
    type: "line",
    name: `${label} (n=${iv.count})`,
    color: NEUTRAL,
    lineWidth: 2,
    marker: { enabled: true, symbol: "circle", radius: 9, fillColor: NEUTRAL, lineWidth: 0 },
    data: iv.members.map((r) => ({ x: c, y: r, setName: setNames[r] })),
  };
});

Highcharts.chart(matrixDiv, {
  chart: {
    type: "scatter",
    backgroundColor: "transparent",
    animation: false,
    margin: [10, 20, 60, 70],
    style: { fontFamily: "inherit" },
  },
  credits: { enabled: false },
  title: { text: null },
  xAxis: {
    categories: colLabels,
    title: { text: "Sets per intersection", style: { color: t.inkSoft, fontSize: "16px" } },
    lineColor: t.inkSoft,
    tickWidth: 0,
    gridLineWidth: 1,
    gridLineColor: t.grid,
    // Degree numbers are non-monotonic per column ("1,1,1,3,2,…") and read as a
    // broken axis if shown as tick labels; the swatch legend above already
    // decodes degree via color, so no numeral row is needed here.
    labels: { enabled: false },
  },
  yAxis: {
    categories: setNames,
    reversed: true,
    title: { text: null },
    lineWidth: 0,
    tickWidth: 0,
    gridLineWidth: 1,
    gridLineColor: t.grid,
    labels: { enabled: false },
  },
  legend: { enabled: false },
  tooltip: {
    formatter() {
      if (this.series.index === 0) {
        const iv = intersections[this.point.x];
        const combo = iv.members.map((r) => setNames[r]).join(" ∩ ");
        return `<b>${setNames[this.point.y]}</b><br/>not in "${combo}"`;
      }
      return `<b>${this.point.setName}</b><br/>member of "${this.series.name}"`;
    },
  },
  plotOptions: { series: { animation: false, stickyTracking: false } },
  series: [
    {
      type: "scatter",
      name: "All combinations",
      data: backgroundDots,
      marker: { symbol: "circle", radius: 7, fillColor: MUTED, lineWidth: 0 },
      showInLegend: false,
    },
    ...connectorSeries,
  ],
});

window.__anyplotReady = true;
Runnable source as JSON, for any HTTP client: https://api.anyplot.ai/specs/upset-basic/highcharts/code. Any spec id and library id listed in llms-full.txt fit the same URL shape; every URL below is complete and callable.
{
  "spec_id": "upset-basic",
  "language": "javascript",
  "library": "highcharts",
  "page": "https://anyplot.ai/upset-basic/javascript/highcharts",
  "hub": "https://anyplot.ai/upset-basic",
  "code_json": "https://api.anyplot.ai/specs/upset-basic/highcharts/code",
  "spec_json": "https://api.anyplot.ai/specs/upset-basic",
  "render_light_png": "https://storage.googleapis.com/anyplot-images/plots/upset-basic/javascript/highcharts/plot-light.png",
  "render_dark_png": "https://storage.googleapis.com/anyplot-images/plots/upset-basic/javascript/highcharts/plot-dark.png",
  "interactive_light_html": "https://storage.googleapis.com/anyplot-images/plots/upset-basic/javascript/highcharts/plot-light.html",
  "interactive_dark_html": "https://storage.googleapis.com/anyplot-images/plots/upset-basic/javascript/highcharts/plot-dark.html",
  "quality_score": 93.0,
  "license": "MIT",
  "guide": "https://anyplot.ai/llms.txt"
}
Part of UpSet Plot for Multi-Set Intersection Analysis on anyplot.ai.