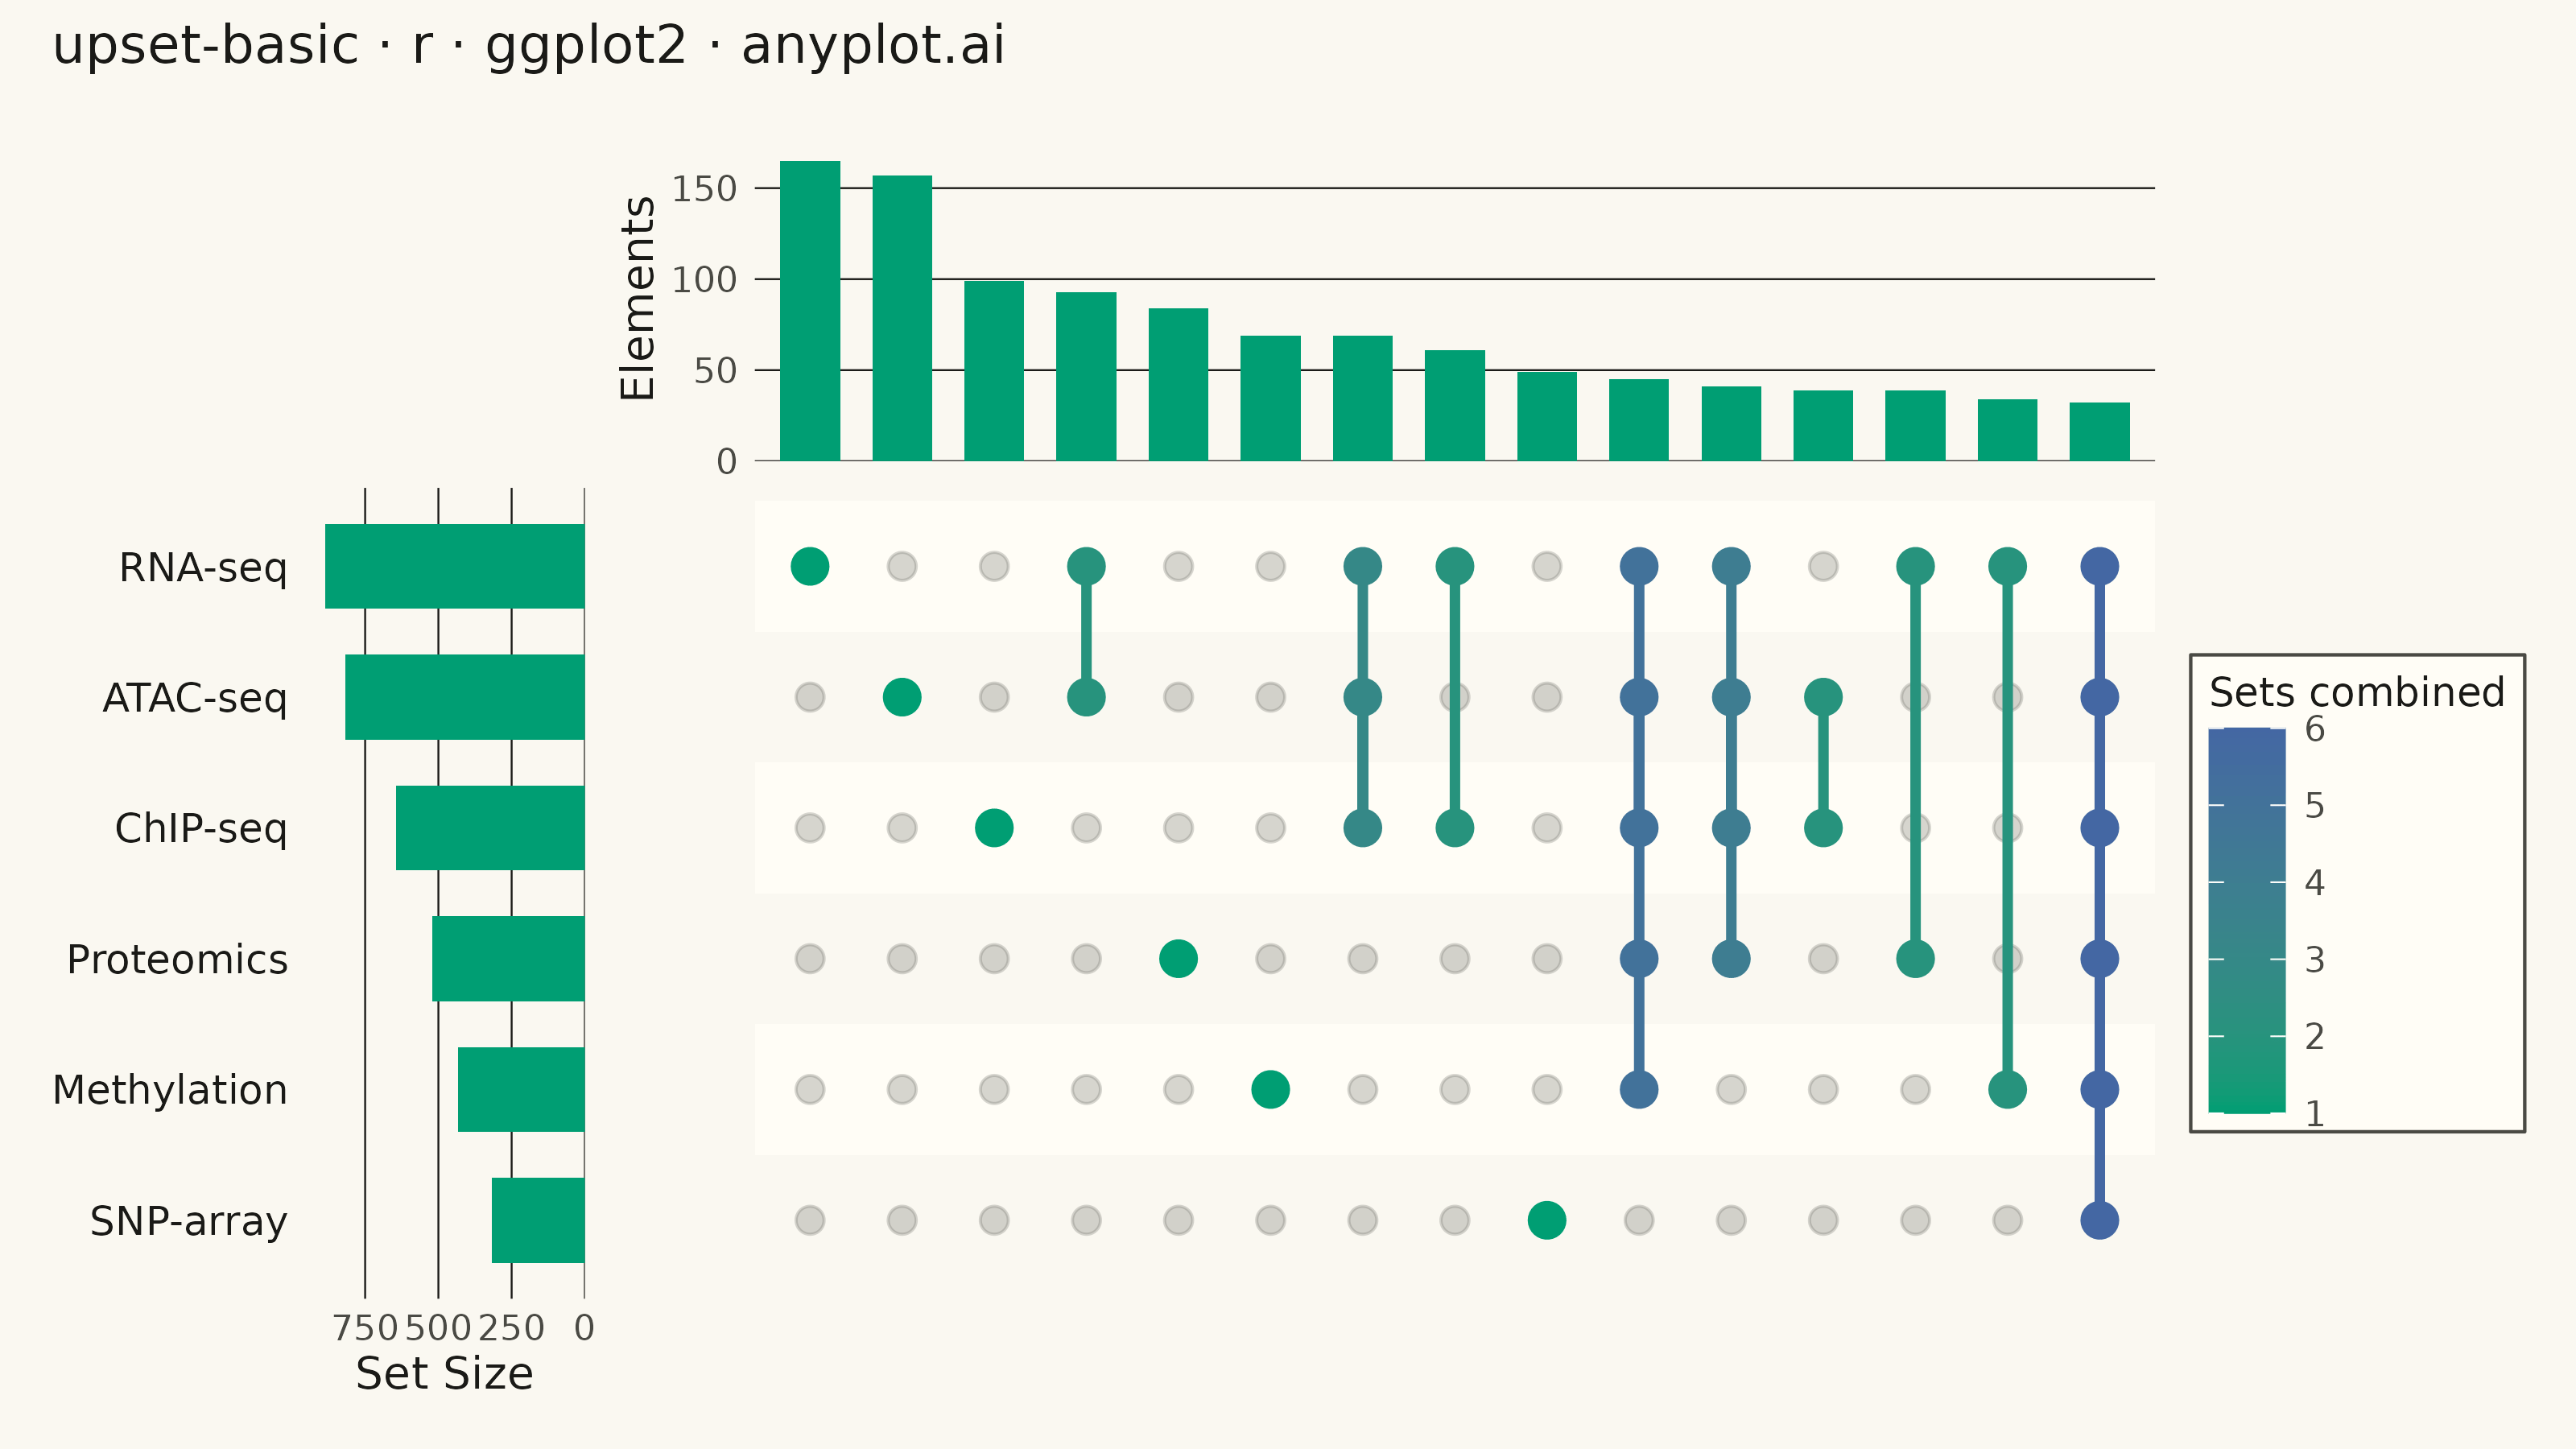
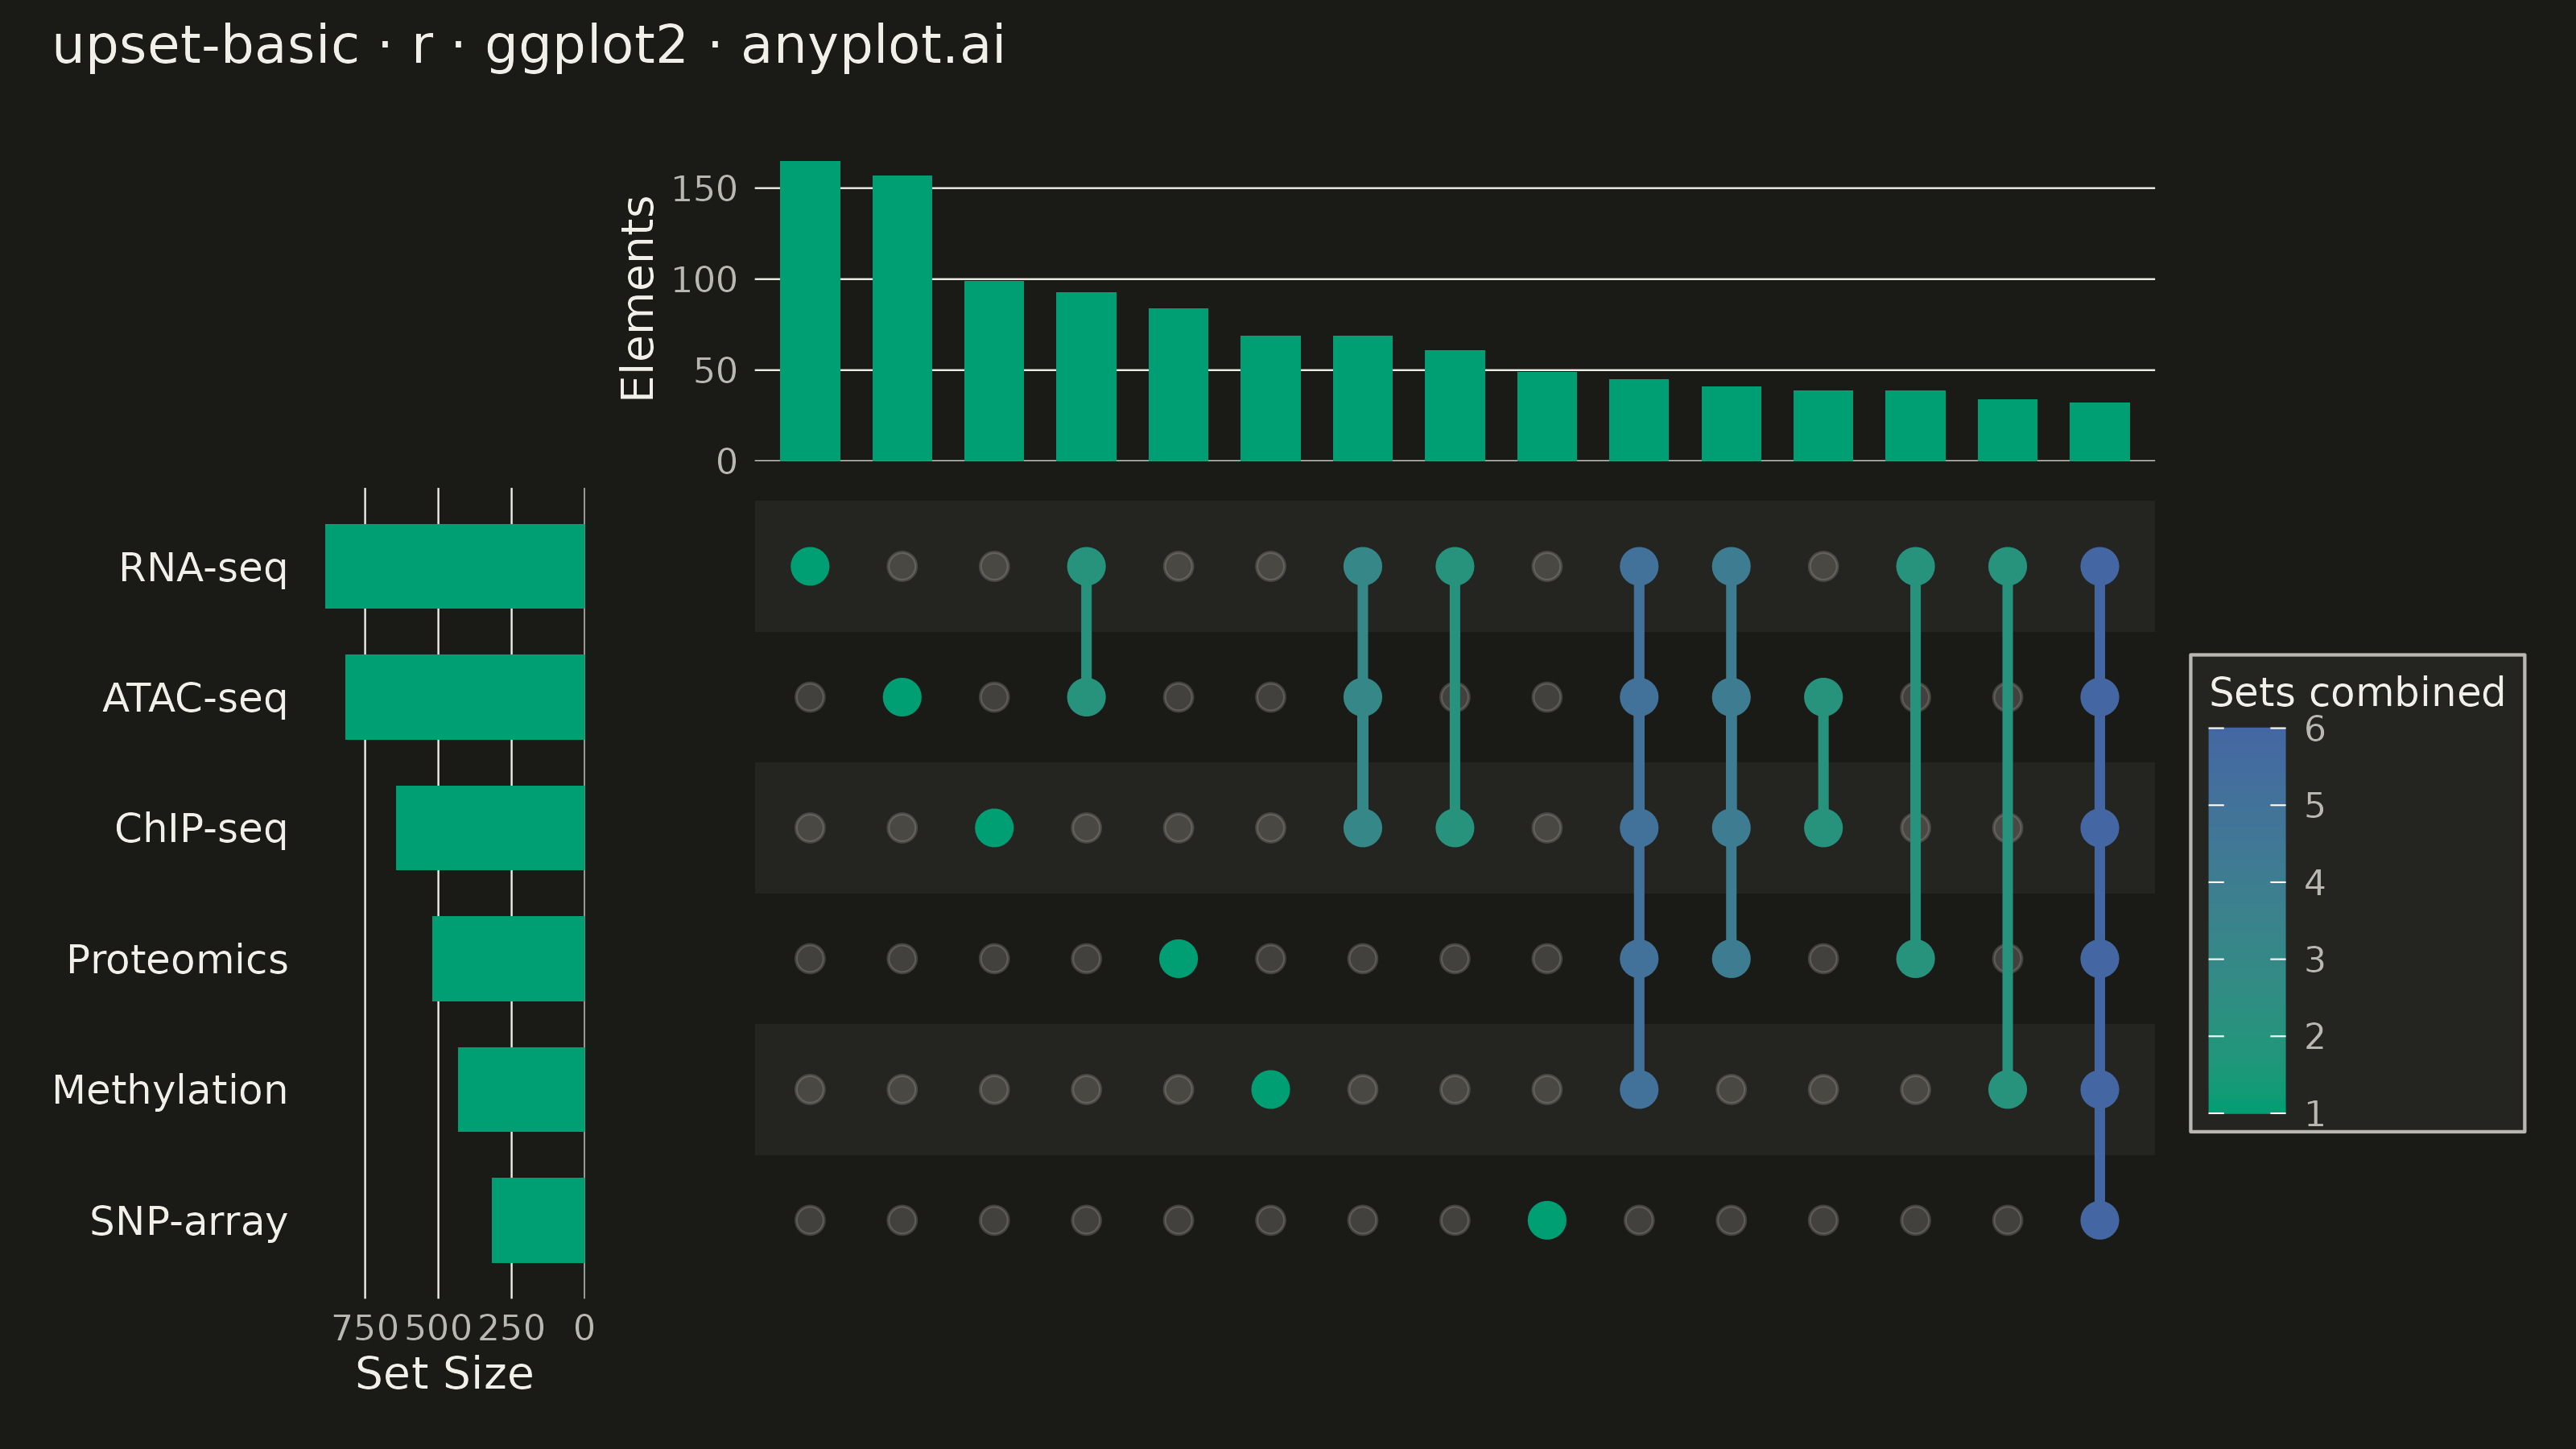
The same plot in 14 other libraries — Python: Altair, Bokeh, lets-plot, Matplotlib, Plotly, plotnine, Pygal, Seaborn; Julia: Makie.jl; JavaScript: Chart.js, D3.js, Apache ECharts, Highcharts, MUI X Charts. Compare all 15 side by side: UpSet Plot for Multi-Set Intersection Analysis in Python, R, Julia and JavaScript.
An UpSet plot visualizes intersections of multiple sets using a matrix-based layout that scales far better than Venn diagrams beyond 3 sets. A horizontal bar chart shows individual set sizes, a dot-matrix indicates which sets participate in each intersection, and a vertical bar chart above shows the intersection cardinality. This is the modern standard for set intersection analysis, making complex overlaps between many sets immediately readable.
#' anyplot.ai
#' upset-basic: UpSet Plot for Multi-Set Intersection Analysis
#' Library: ggplot2 3.5.1 | R 4.4.1
#' Quality: 93/100 | Created: 2026-09-09

library(ggplot2)
library(dplyr)
library(patchwork)
library(ragg)

set.seed(42)

# --- Theme tokens -------------------------------------------------------
THEME       <- Sys.getenv("ANYPLOT_THEME", "light")
PAGE_BG     <- if (THEME == "light") "#FAF8F1" else "#1A1A17"
ELEVATED_BG <- if (THEME == "light") "#FFFDF6" else "#242420"
INK         <- if (THEME == "light") "#1A1A17" else "#F0EFE8"
INK_SOFT    <- if (THEME == "light") "#4A4A44" else "#B8B7B0"
INK_MUTED   <- if (THEME == "light") "#6B6A63" else "#A8A79F"

BRAND <- "#009E73"  # Imprint palette position 1 — always first series
BLUE  <- "#4467A3"  # Imprint palette position 3 — high end of imprint_seq

# --- Data: differential-expression gene sets across genomic assays -----
# A shared "true DE signal" liability per gene correlates detection across
# assays, so genes with strong signal tend to surface in several assays at
# once — the realistic pattern that gives an UpSet plot higher-degree bars.
n_genes  <- 2500
set_names_all <- c("RNA-seq", "ChIP-seq", "ATAC-seq", "Proteomics", "Methylation", "SNP-array")
set_intercepts <- c(-0.9, -1.3, -1.0, -1.7, -1.9, -2.2)
set_slopes     <- c(1.7, 1.4, 1.6, 1.3, 1.2, 1.0)

liability <- rnorm(n_genes)
membership <- vapply(seq_along(set_names_all), function(i) {
  rbinom(n_genes, 1, plogis(set_intercepts[i] + set_slopes[i] * liability))
}, integer(n_genes))
colnames(membership) <- set_names_all
membership <- membership[rowSums(membership) > 0, ]

combo_key <- apply(membership, 1, function(row) paste(set_names_all[row == 1], collapse = "|"))

intersections <- tibble(combo = combo_key) %>%
  count(combo, name = "size") %>%
  arrange(desc(size)) %>%
  slice_head(n = 15) %>%
  mutate(
    intersection_id = row_number(),
    degree = sapply(strsplit(combo, "\\|"), length)
  )
n_int <- nrow(intersections)
member_sets <- strsplit(intersections$combo, "\\|")

set_sizes <- tibble(set = set_names_all, size = colSums(membership)) %>%
  arrange(desc(size))
set_order <- set_sizes$set
set_sizes$set <- factor(set_sizes$set, levels = rev(set_order))

matrix_df <- expand.grid(
  intersection_id = intersections$intersection_id,
  set = set_names_all,
  stringsAsFactors = FALSE
) %>%
  as_tibble() %>%
  rowwise() %>%
  mutate(member = set %in% member_sets[[intersection_id]]) %>%
  ungroup() %>%
  left_join(intersections %>% select(intersection_id, degree), by = "intersection_id") %>%
  mutate(set = factor(set, levels = rev(set_order)))

row_stripes <- tibble(set = factor(set_order, levels = rev(set_order))) %>%
  mutate(y_pos = as.integer(set)) %>%
  filter(y_pos %% 2 == 0)

degree_breaks <- seq(min(intersections$degree), max(intersections$degree), by = 1)

# --- Panel A: horizontal set-size bars (left) ---------------------------
p_left <- ggplot(set_sizes, aes(x = size, y = set)) +
  geom_col(fill = BRAND, width = 0.65) +
  scale_x_reverse(expand = expansion(mult = c(0.08, 0))) +
  labs(x = "Set Size") +
  theme_minimal(base_size = 8) +
  theme(
    plot.background   = element_rect(fill = PAGE_BG, color = PAGE_BG),
    panel.background  = element_rect(fill = PAGE_BG, color = NA),
    panel.grid.major.y = element_blank(),
    panel.grid.minor  = element_blank(),
    panel.grid.major.x = element_line(color = INK, linewidth = 0.2),
    axis.title.y      = element_blank(),
    axis.text.y       = element_text(color = INK, size = 9, hjust = 1),
    axis.ticks.y      = element_blank(),
    axis.title.x      = element_text(color = INK, size = 10),
    axis.text.x       = element_text(color = INK_SOFT, size = 8),
    axis.ticks.x      = element_blank(),
    plot.margin       = margin(t = 2, r = 2, b = 6, l = 6)
  )

# --- Panel B: intersection-size bars (top) ------------------------------
p_top <- ggplot(intersections, aes(x = factor(intersection_id, levels = seq_len(n_int)), y = size)) +
  geom_col(fill = BRAND, width = 0.65) +
  scale_y_continuous(expand = expansion(mult = c(0, 0.08))) +
  labs(y = "Elements") +
  theme_minimal(base_size = 8) +
  theme(
    plot.background   = element_rect(fill = PAGE_BG, color = PAGE_BG),
    panel.background  = element_rect(fill = PAGE_BG, color = NA),
    panel.grid.major.x = element_blank(),
    panel.grid.minor  = element_blank(),
    panel.grid.major.y = element_line(color = INK, linewidth = 0.2),
    axis.title.x      = element_blank(),
    axis.text.x       = element_blank(),
    axis.ticks.x      = element_blank(),
    axis.title.y      = element_text(color = INK, size = 10),
    axis.text.y       = element_text(color = INK_SOFT, size = 8),
    axis.ticks.y      = element_blank(),
    plot.margin       = margin(t = 6, r = 2, b = 2, l = 6)
  )

# --- Panel C: dot matrix (set membership per intersection) -------------
p_matrix <- ggplot() +
  geom_rect(
    data = row_stripes,
    aes(ymin = y_pos - 0.5, ymax = y_pos + 0.5, xmin = -Inf, xmax = Inf),
    inherit.aes = FALSE, fill = ELEVATED_BG, color = NA
  ) +
  geom_point(
    data = matrix_df,
    aes(x = factor(intersection_id, levels = seq_len(n_int)), y = set),
    color = INK_MUTED, alpha = 0.28, size = 2.6
  ) +
  geom_line(
    data = filter(matrix_df, member),
    aes(x = factor(intersection_id, levels = seq_len(n_int)), y = set, group = intersection_id, color = degree),
    linewidth = 1.1
  ) +
  geom_point(
    data = filter(matrix_df, member),
    aes(x = factor(intersection_id, levels = seq_len(n_int)), y = set, color = degree),
    size = 3.4
  ) +
  scale_color_gradient(low = BRAND, high = BLUE, name = "Sets combined", breaks = degree_breaks) +
  scale_x_discrete(expand = expansion(add = 0.6)) +
  theme_minimal(base_size = 8) +
  theme(
    plot.background   = element_rect(fill = PAGE_BG, color = PAGE_BG),
    panel.background  = element_rect(fill = PAGE_BG, color = NA),
    panel.grid        = element_blank(),
    axis.title        = element_blank(),
    axis.text         = element_blank(),
    axis.ticks        = element_blank(),
    legend.position    = "right",
    legend.background = element_rect(fill = ELEVATED_BG, color = INK_SOFT),
    legend.text        = element_text(color = INK_SOFT, size = 8),
    legend.title       = element_text(color = INK, size = 9),
    plot.margin        = margin(t = 2, r = 6, b = 6, l = 2)
  )

# --- Compose: blank corner, top bars, left bars, matrix -----------------
design <- "
#BBBBB
#BBBBB
ACCCCC
ACCCCC
ACCCCC
ACCCCC
ACCCCC
"

combined <- p_left + p_top + p_matrix +
  patchwork::plot_layout(design = design) +
  patchwork::plot_annotation(
    title = "upset-basic · r · ggplot2 · anyplot.ai",
    theme = theme(
      plot.background = element_rect(fill = PAGE_BG, color = PAGE_BG),
      plot.title       = element_text(color = INK, size = 12, margin = margin(b = 8))
    )
  )

# --- Save -----------------------------------------------------------------
ggsave(
  filename = sprintf("plot-%s.png", THEME),
  plot     = combined,
  device   = ragg::agg_png,
  width    = 8,
  height   = 4.5,
  units    = "in",
  dpi      = 400,
  bg       = PAGE_BG
)
Runnable source as JSON, for any HTTP client: https://api.anyplot.ai/specs/upset-basic/ggplot2/code. Any spec id and library id listed in llms-full.txt fit the same URL shape; every URL below is complete and callable.
{
  "spec_id": "upset-basic",
  "language": "r",
  "library": "ggplot2",
  "page": "https://anyplot.ai/upset-basic/r/ggplot2",
  "hub": "https://anyplot.ai/upset-basic",
  "code_json": "https://api.anyplot.ai/specs/upset-basic/ggplot2/code",
  "spec_json": "https://api.anyplot.ai/specs/upset-basic",
  "render_light_png": "https://storage.googleapis.com/anyplot-images/plots/upset-basic/r/ggplot2/plot-light.png",
  "render_dark_png": "https://storage.googleapis.com/anyplot-images/plots/upset-basic/r/ggplot2/plot-dark.png",
  "quality_score": 93.0,
  "license": "MIT",
  "guide": "https://anyplot.ai/llms.txt"
}
Part of UpSet Plot for Multi-Set Intersection Analysis on anyplot.ai.