The same plot in 14 other libraries — Python: Altair, Bokeh, lets-plot, Matplotlib, Plotly, Pygal, Seaborn; R: ggplot2; Julia: Makie.jl; JavaScript: Chart.js, D3.js, Apache ECharts, Highcharts, MUI X Charts. Compare all 15 side by side: UpSet Plot for Multi-Set Intersection Analysis in Python, R, Julia and JavaScript.
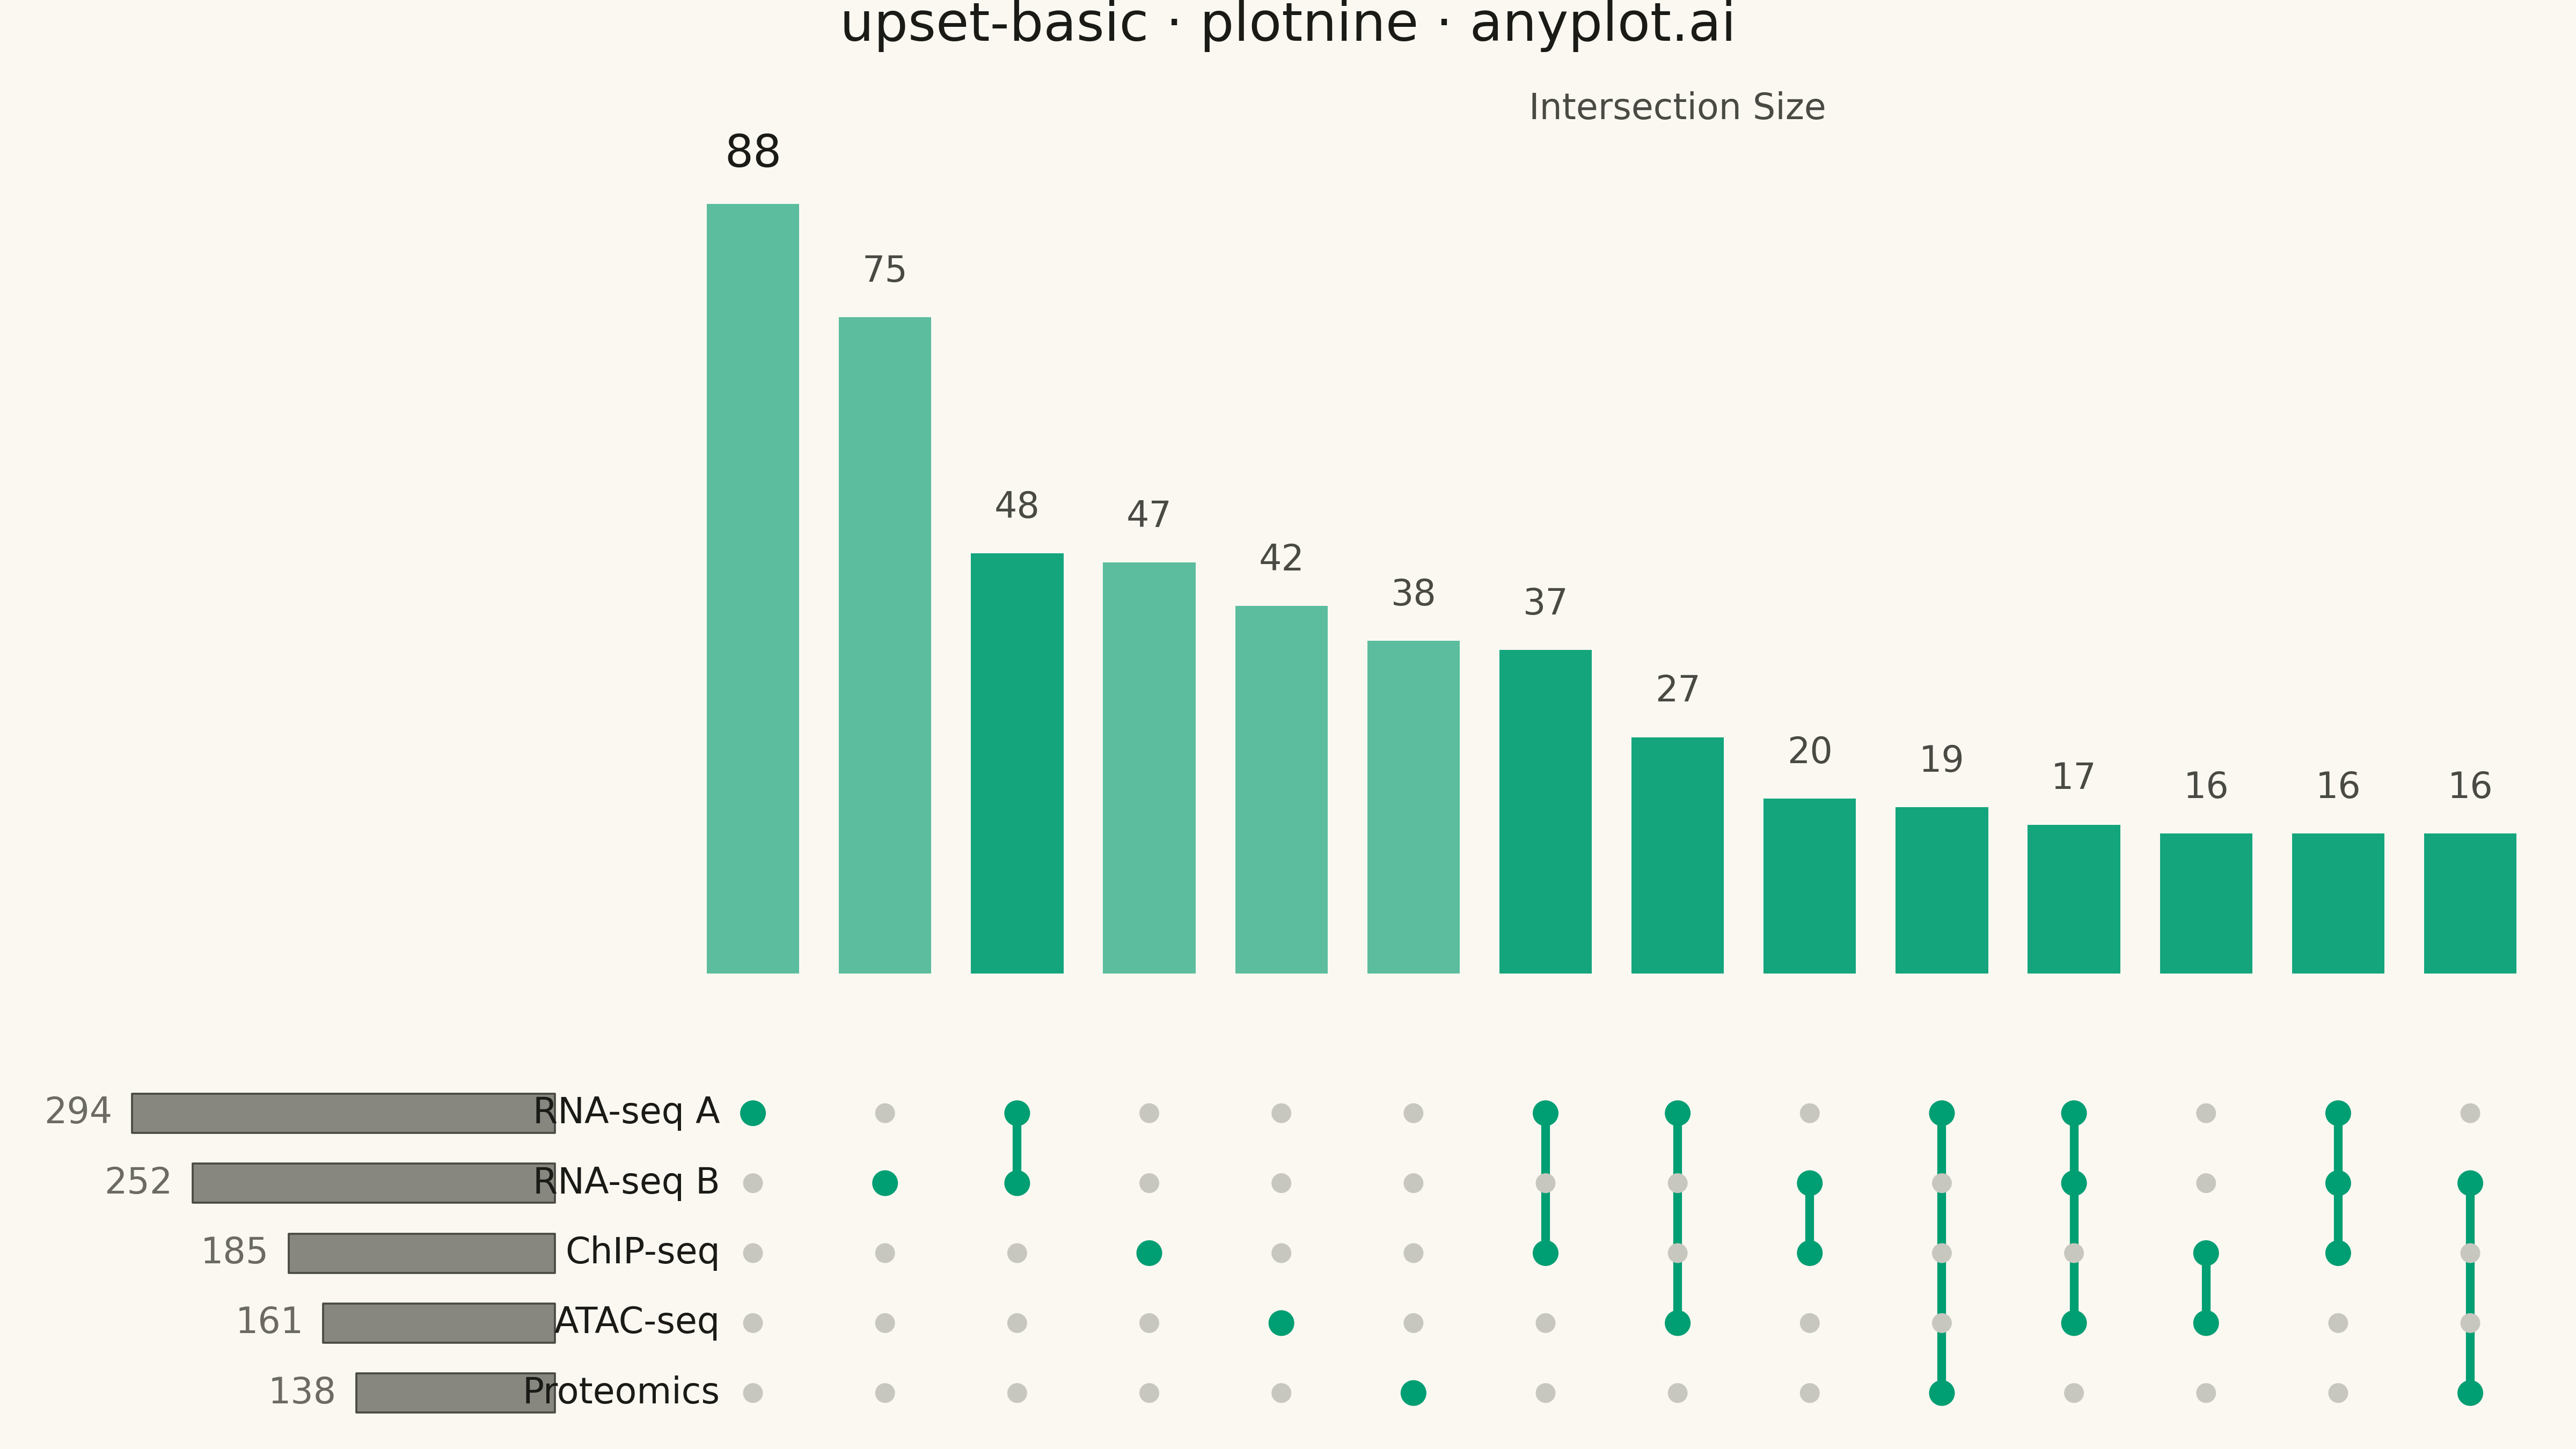
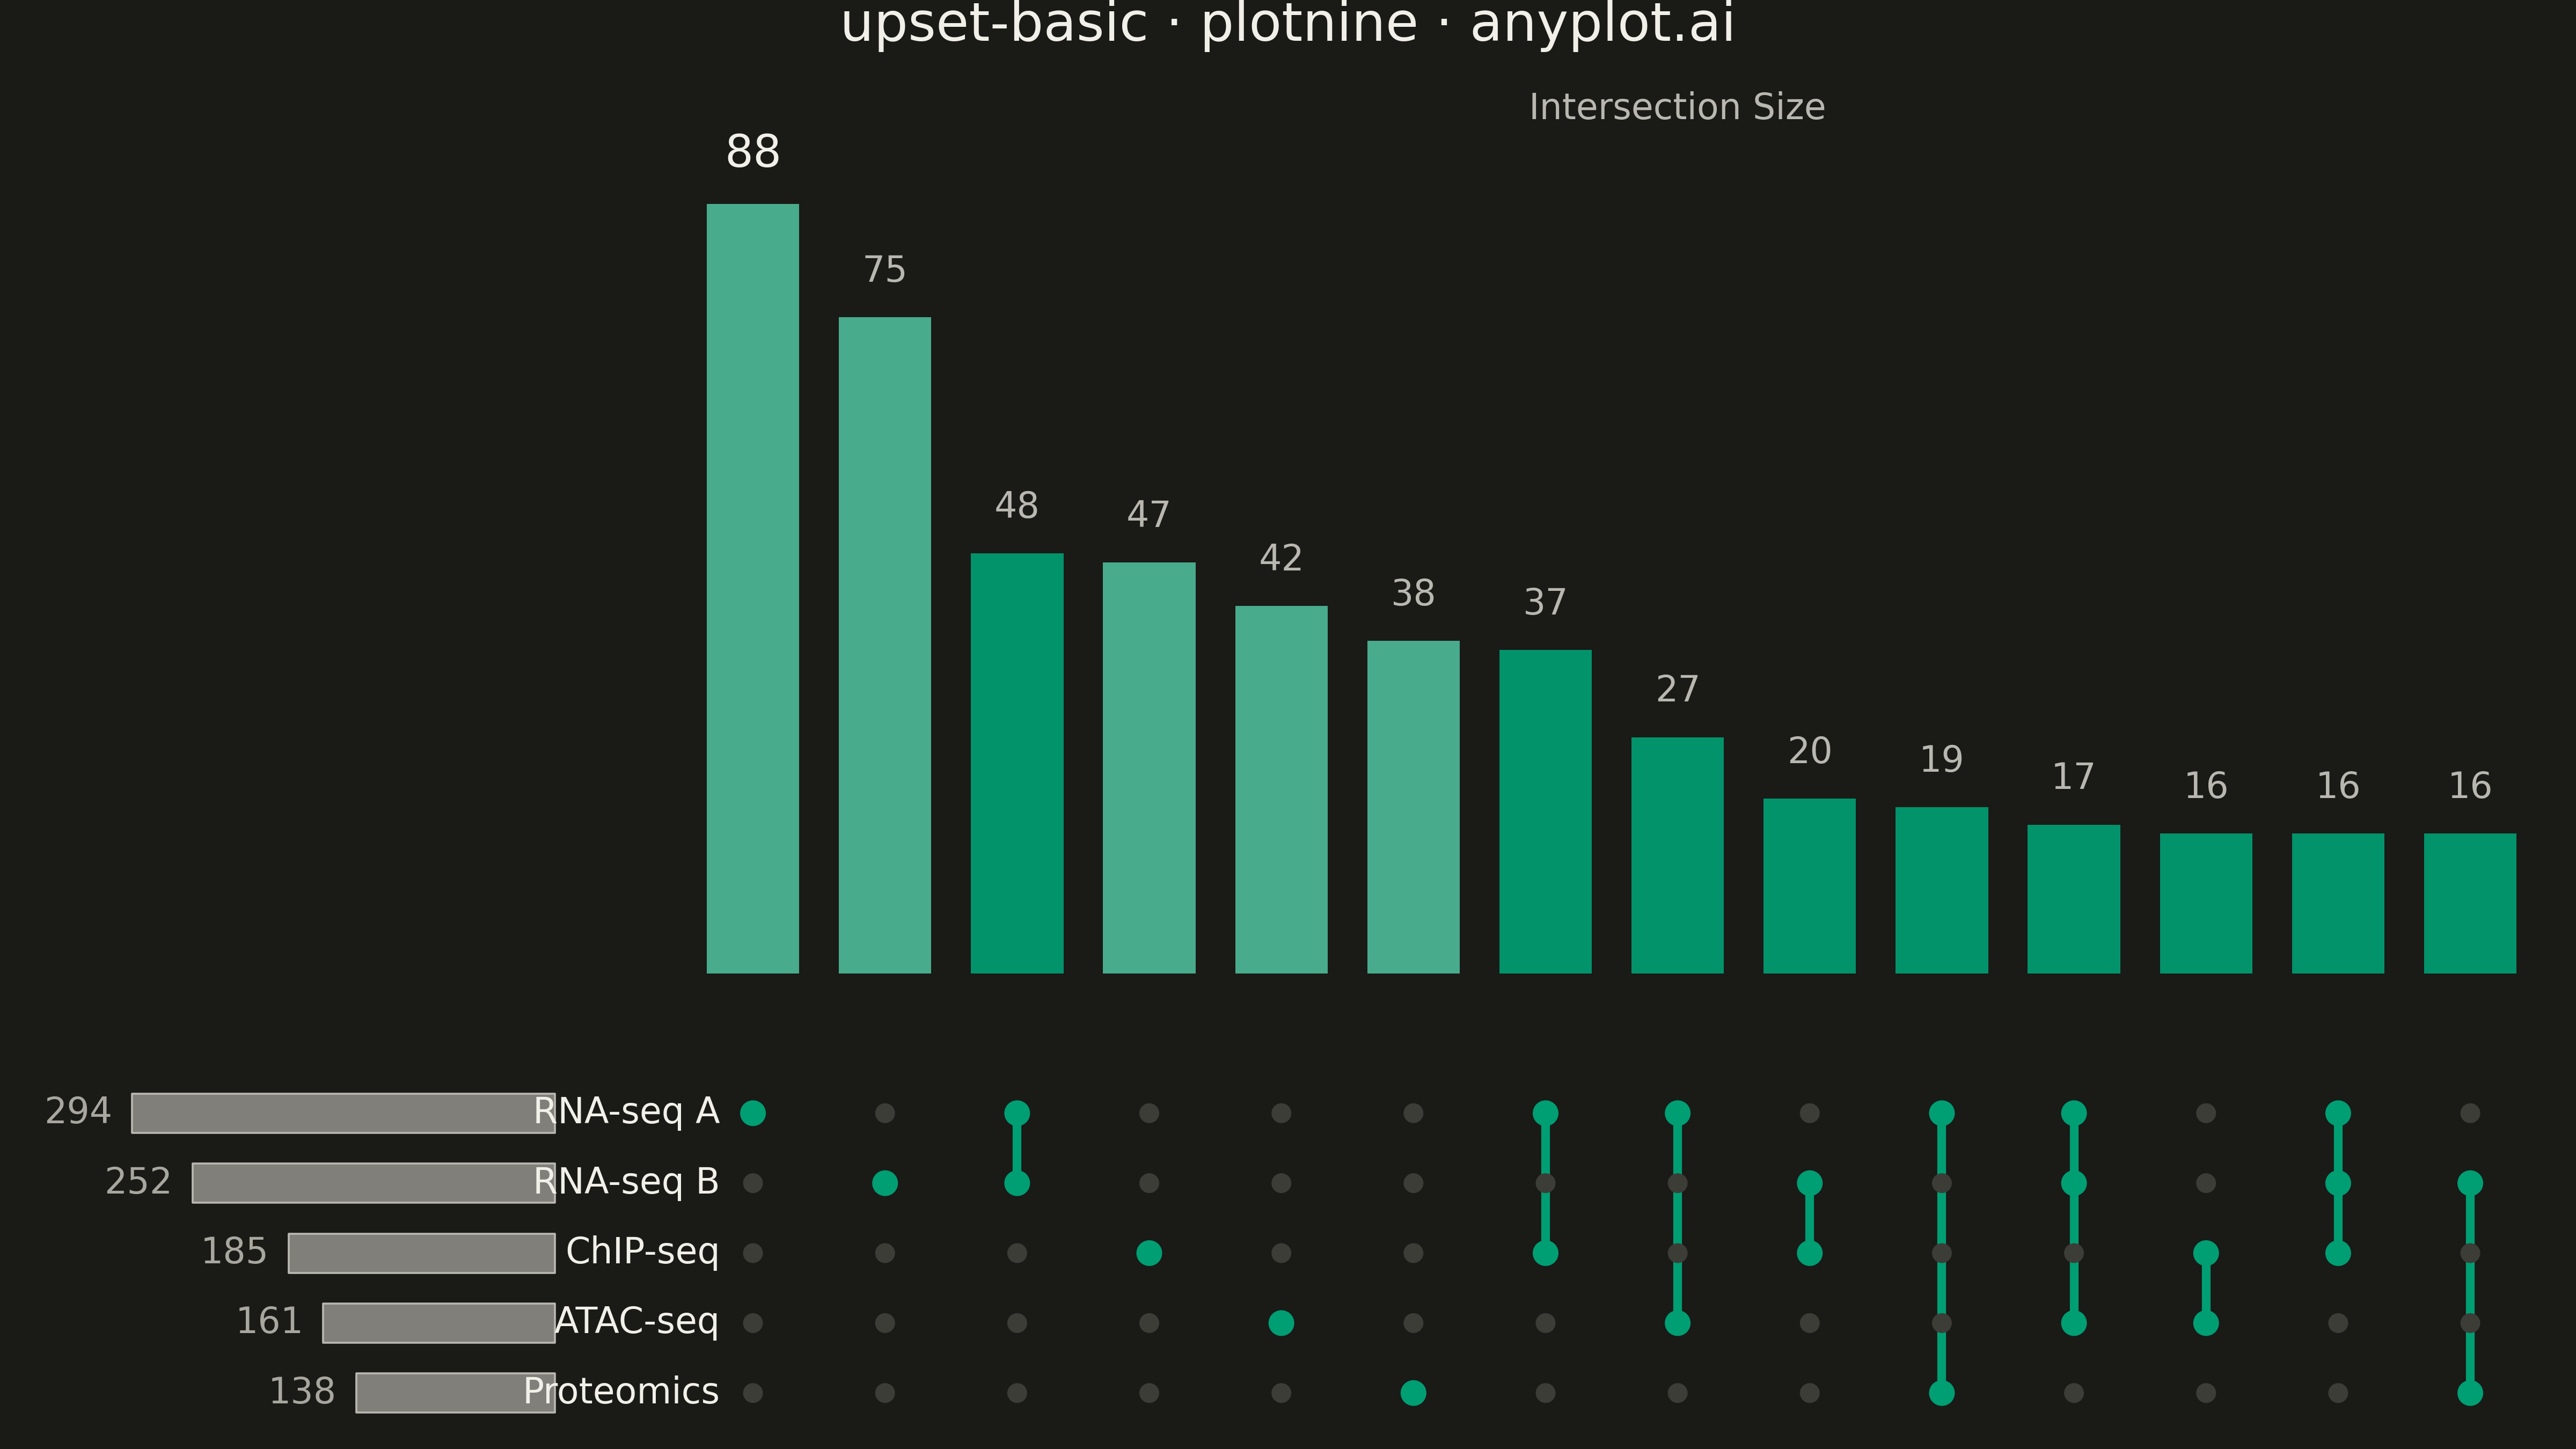
An UpSet plot visualizes intersections of multiple sets using a matrix-based layout that scales far better than Venn diagrams beyond 3 sets. A horizontal bar chart shows individual set sizes, a dot-matrix indicates which sets participate in each intersection, and a vertical bar chart above shows the intersection cardinality. This is the modern standard for set intersection analysis, making complex overlaps between many sets immediately readable.
""" anyplot.ai
upset-basic: UpSet Plot for Multi-Set Intersection Analysis
Library: plotnine 0.15.4 | Python 3.13.13
Quality: 86/100 | Created: 2026-05-13
"""

import os
import sys


# Prevent this file from shadowing the installed plotnine package
sys.path = [p for p in sys.path if p not in ("", os.path.dirname(os.path.abspath(__file__)))]

import numpy as np
import pandas as pd
from plotnine import (
    aes,
    element_rect,
    element_text,
    geom_point,
    geom_rect,
    geom_segment,
    geom_text,
    ggplot,
    labs,
    scale_x_continuous,
    scale_y_continuous,
    theme,
    theme_void,
)


# Theme tokens
THEME = os.getenv("ANYPLOT_THEME", "light")
PAGE_BG = "#FAF8F1" if THEME == "light" else "#1A1A17"
INK = "#1A1A17" if THEME == "light" else "#F0EFE8"
INK_SOFT = "#4A4A44" if THEME == "light" else "#B8B7B0"
INK_MUTED = "#6B6A63" if THEME == "light" else "#A8A79F"
BRAND = "#009E73"
DOT_DIM = "#C8C7BF" if THEME == "light" else "#3D3D38"

# ── Data ──────────────────────────────────────────────────────────────────────
np.random.seed(42)

experiments = ["RNA-seq A", "RNA-seq B", "ChIP-seq", "ATAC-seq", "Proteomics"]
n_sets = len(experiments)
n_genes = 600

probs = [0.45, 0.40, 0.30, 0.25, 0.20]
membership = np.column_stack([np.random.binomial(1, p, n_genes) for p in probs])
no_set_rows = membership.sum(axis=1) == 0
for idx in np.where(no_set_rows)[0]:
    membership[idx, np.random.randint(0, n_sets)] = 1

set_sizes = membership.sum(axis=0)

intersections = {}
for row in membership:
    key = tuple(row.astype(int))
    intersections[key] = intersections.get(key, 0) + 1

sorted_ints = sorted(intersections.items(), key=lambda x: -x[1])
n_cols = 14
top_ints = sorted_ints[:n_cols]

# ── Layout coordinates ────────────────────────────────────────────────────────
# Set rows: set 0 at y=n_sets (top), set n_sets-1 at y=1 (bottom)
set_row_y = {i: float(n_sets - i) for i in range(n_sets)}

max_count = top_ints[0][1]
BAR_BASE = float(n_sets) + 2.0
BAR_MAX_H = float(n_sets) * 2.2
bar_scale = BAR_MAX_H / max_count

# Set size bars: horizontal bars extending left from SET_BAR_RIGHT
max_set_size = float(max(set_sizes))
SET_BAR_MAXW = 3.2
SET_BAR_RIGHT = -0.5
set_bar_scale = SET_BAR_MAXW / max_set_size

# Set name labels right-aligned between set bars and dot matrix
SET_NAME_X = 0.75

# ── Component DataFrames ──────────────────────────────────────────────────────

# Intersection bars (geom_rect, one per column)
int_bars_df = pd.DataFrame(
    [
        {
            "xmin": float(i + 1) - 0.35,
            "xmax": float(i + 1) + 0.35,
            "ymin": BAR_BASE,
            "ymax": BAR_BASE + count * bar_scale,
        }
        for i, (key, count) in enumerate(top_ints)
    ]
)

# Count labels above each bar
count_labels_df = pd.DataFrame(
    [
        {"x": float(i + 1), "y": BAR_BASE + count * bar_scale + 0.4, "label": str(count)}
        for i, (key, count) in enumerate(top_ints)
    ]
)

# Connecting segments for multi-set intersections
segs_rows = []
for col_i, (key, _) in enumerate(top_ints):
    active_ys = [set_row_y[s] for s, v in enumerate(key) if v == 1]
    if len(active_ys) > 1:
        segs_rows.append({"x": float(col_i + 1), "xend": float(col_i + 1), "y": min(active_ys), "yend": max(active_ys)})
segs_df = pd.DataFrame(segs_rows) if segs_rows else pd.DataFrame(columns=["x", "xend", "y", "yend"])

# Dot matrix: all set × column combinations
dots_rows = [
    {"x": float(col_i + 1), "y": set_row_y[s], "active": bool(v)}
    for col_i, (key, _) in enumerate(top_ints)
    for s, v in enumerate(key)
]
dots_df = pd.DataFrame(dots_rows)
active_dots = dots_df[dots_df["active"]].copy()
dim_dots = dots_df[~dots_df["active"]].copy()

# Set size horizontal bars
set_bars_df = pd.DataFrame(
    [
        {
            "xmin": SET_BAR_RIGHT - set_sizes[i] * set_bar_scale,
            "xmax": SET_BAR_RIGHT,
            "ymin": set_row_y[i] - 0.28,
            "ymax": set_row_y[i] + 0.28,
        }
        for i in range(n_sets)
    ]
)

# Set size number labels (to the left of bars)
set_size_df = pd.DataFrame(
    [
        {"x": SET_BAR_RIGHT - set_sizes[i] * set_bar_scale - 0.15, "y": set_row_y[i], "label": str(int(set_sizes[i]))}
        for i in range(n_sets)
    ]
)

# Set name labels (right-aligned between set bars and dot matrix)
set_name_df = pd.DataFrame([{"x": SET_NAME_X, "y": set_row_y[i], "label": experiments[i]} for i in range(n_sets)])

# Section header: "Intersection Size" above bars
section_header_df = pd.DataFrame(
    [{"x": float(n_cols + 1) / 2.0 + 0.5, "y": BAR_BASE + BAR_MAX_H + 1.1, "label": "Intersection Size"}]
)

# ── Axis limits ───────────────────────────────────────────────────────────────
x_lo = SET_BAR_RIGHT - SET_BAR_MAXW - 1.0
x_hi = float(n_cols) + 0.8
y_lo = 0.2
y_hi = BAR_BASE + BAR_MAX_H + 1.8

# ── Plot ──────────────────────────────────────────────────────────────────────
plot = (
    ggplot()
    # Intersection bars
    + geom_rect(
        data=int_bars_df,
        mapping=aes(xmin="xmin", xmax="xmax", ymin="ymin", ymax="ymax"),
        fill=BRAND,
        color=BRAND,
        alpha=0.92,
    )
    # Count labels above bars
    + geom_text(data=count_labels_df, mapping=aes(x="x", y="y", label="label"), color=INK_SOFT, size=9, va="bottom")
    # Connecting lines in dot matrix
    + geom_segment(data=segs_df, mapping=aes(x="x", xend="xend", y="y", yend="yend"), color=BRAND, size=2.2)
    # Inactive (dim) dots
    + geom_point(data=dim_dots, mapping=aes(x="x", y="y"), color=DOT_DIM, fill=DOT_DIM, size=4.0)
    # Active (highlighted) dots
    + geom_point(data=active_dots, mapping=aes(x="x", y="y"), color=BRAND, fill=BRAND, size=5.5)
    # Set size horizontal bars
    + geom_rect(
        data=set_bars_df,
        mapping=aes(xmin="xmin", xmax="xmax", ymin="ymin", ymax="ymax"),
        fill=INK_SOFT,
        color=INK_SOFT,
        alpha=0.65,
    )
    # Set size number labels
    + geom_text(data=set_size_df, mapping=aes(x="x", y="y", label="label"), color=INK_MUTED, size=8.5, ha="right")
    # Set name labels
    + geom_text(data=set_name_df, mapping=aes(x="x", y="y", label="label"), color=INK, size=10.5, ha="right")
    # Section header
    + geom_text(data=section_header_df, mapping=aes(x="x", y="y", label="label"), color=INK_SOFT, size=10, va="bottom")
    + labs(title="upset-basic · plotnine · anyplot.ai")
    + scale_x_continuous(limits=(x_lo, x_hi), expand=(0, 0))
    + scale_y_continuous(limits=(y_lo, y_hi), expand=(0, 0))
    + theme_void()
    + theme(
        figure_size=(16, 9),
        plot_background=element_rect(fill=PAGE_BG, color=PAGE_BG),
        plot_title=element_text(color=INK, size=20, ha="center"),
    )
)

# ── Save ──────────────────────────────────────────────────────────────────────
plot.save(f"plot-{THEME}.png", dpi=300, verbose=False)
Runnable source as JSON, for any HTTP client: https://api.anyplot.ai/specs/upset-basic/plotnine/code. Any spec id and library id listed in llms-full.txt fit the same URL shape; every URL below is complete and callable.
{
  "spec_id": "upset-basic",
  "language": "python",
  "library": "plotnine",
  "page": "https://anyplot.ai/upset-basic/python/plotnine",
  "hub": "https://anyplot.ai/upset-basic",
  "code_json": "https://api.anyplot.ai/specs/upset-basic/plotnine/code",
  "spec_json": "https://api.anyplot.ai/specs/upset-basic",
  "render_light_png": "https://storage.googleapis.com/anyplot-images/plots/upset-basic/python/plotnine/plot-light.png",
  "render_dark_png": "https://storage.googleapis.com/anyplot-images/plots/upset-basic/python/plotnine/plot-dark.png",
  "quality_score": 86.0,
  "license": "MIT",
  "guide": "https://anyplot.ai/llms.txt"
}
Part of UpSet Plot for Multi-Set Intersection Analysis on anyplot.ai.