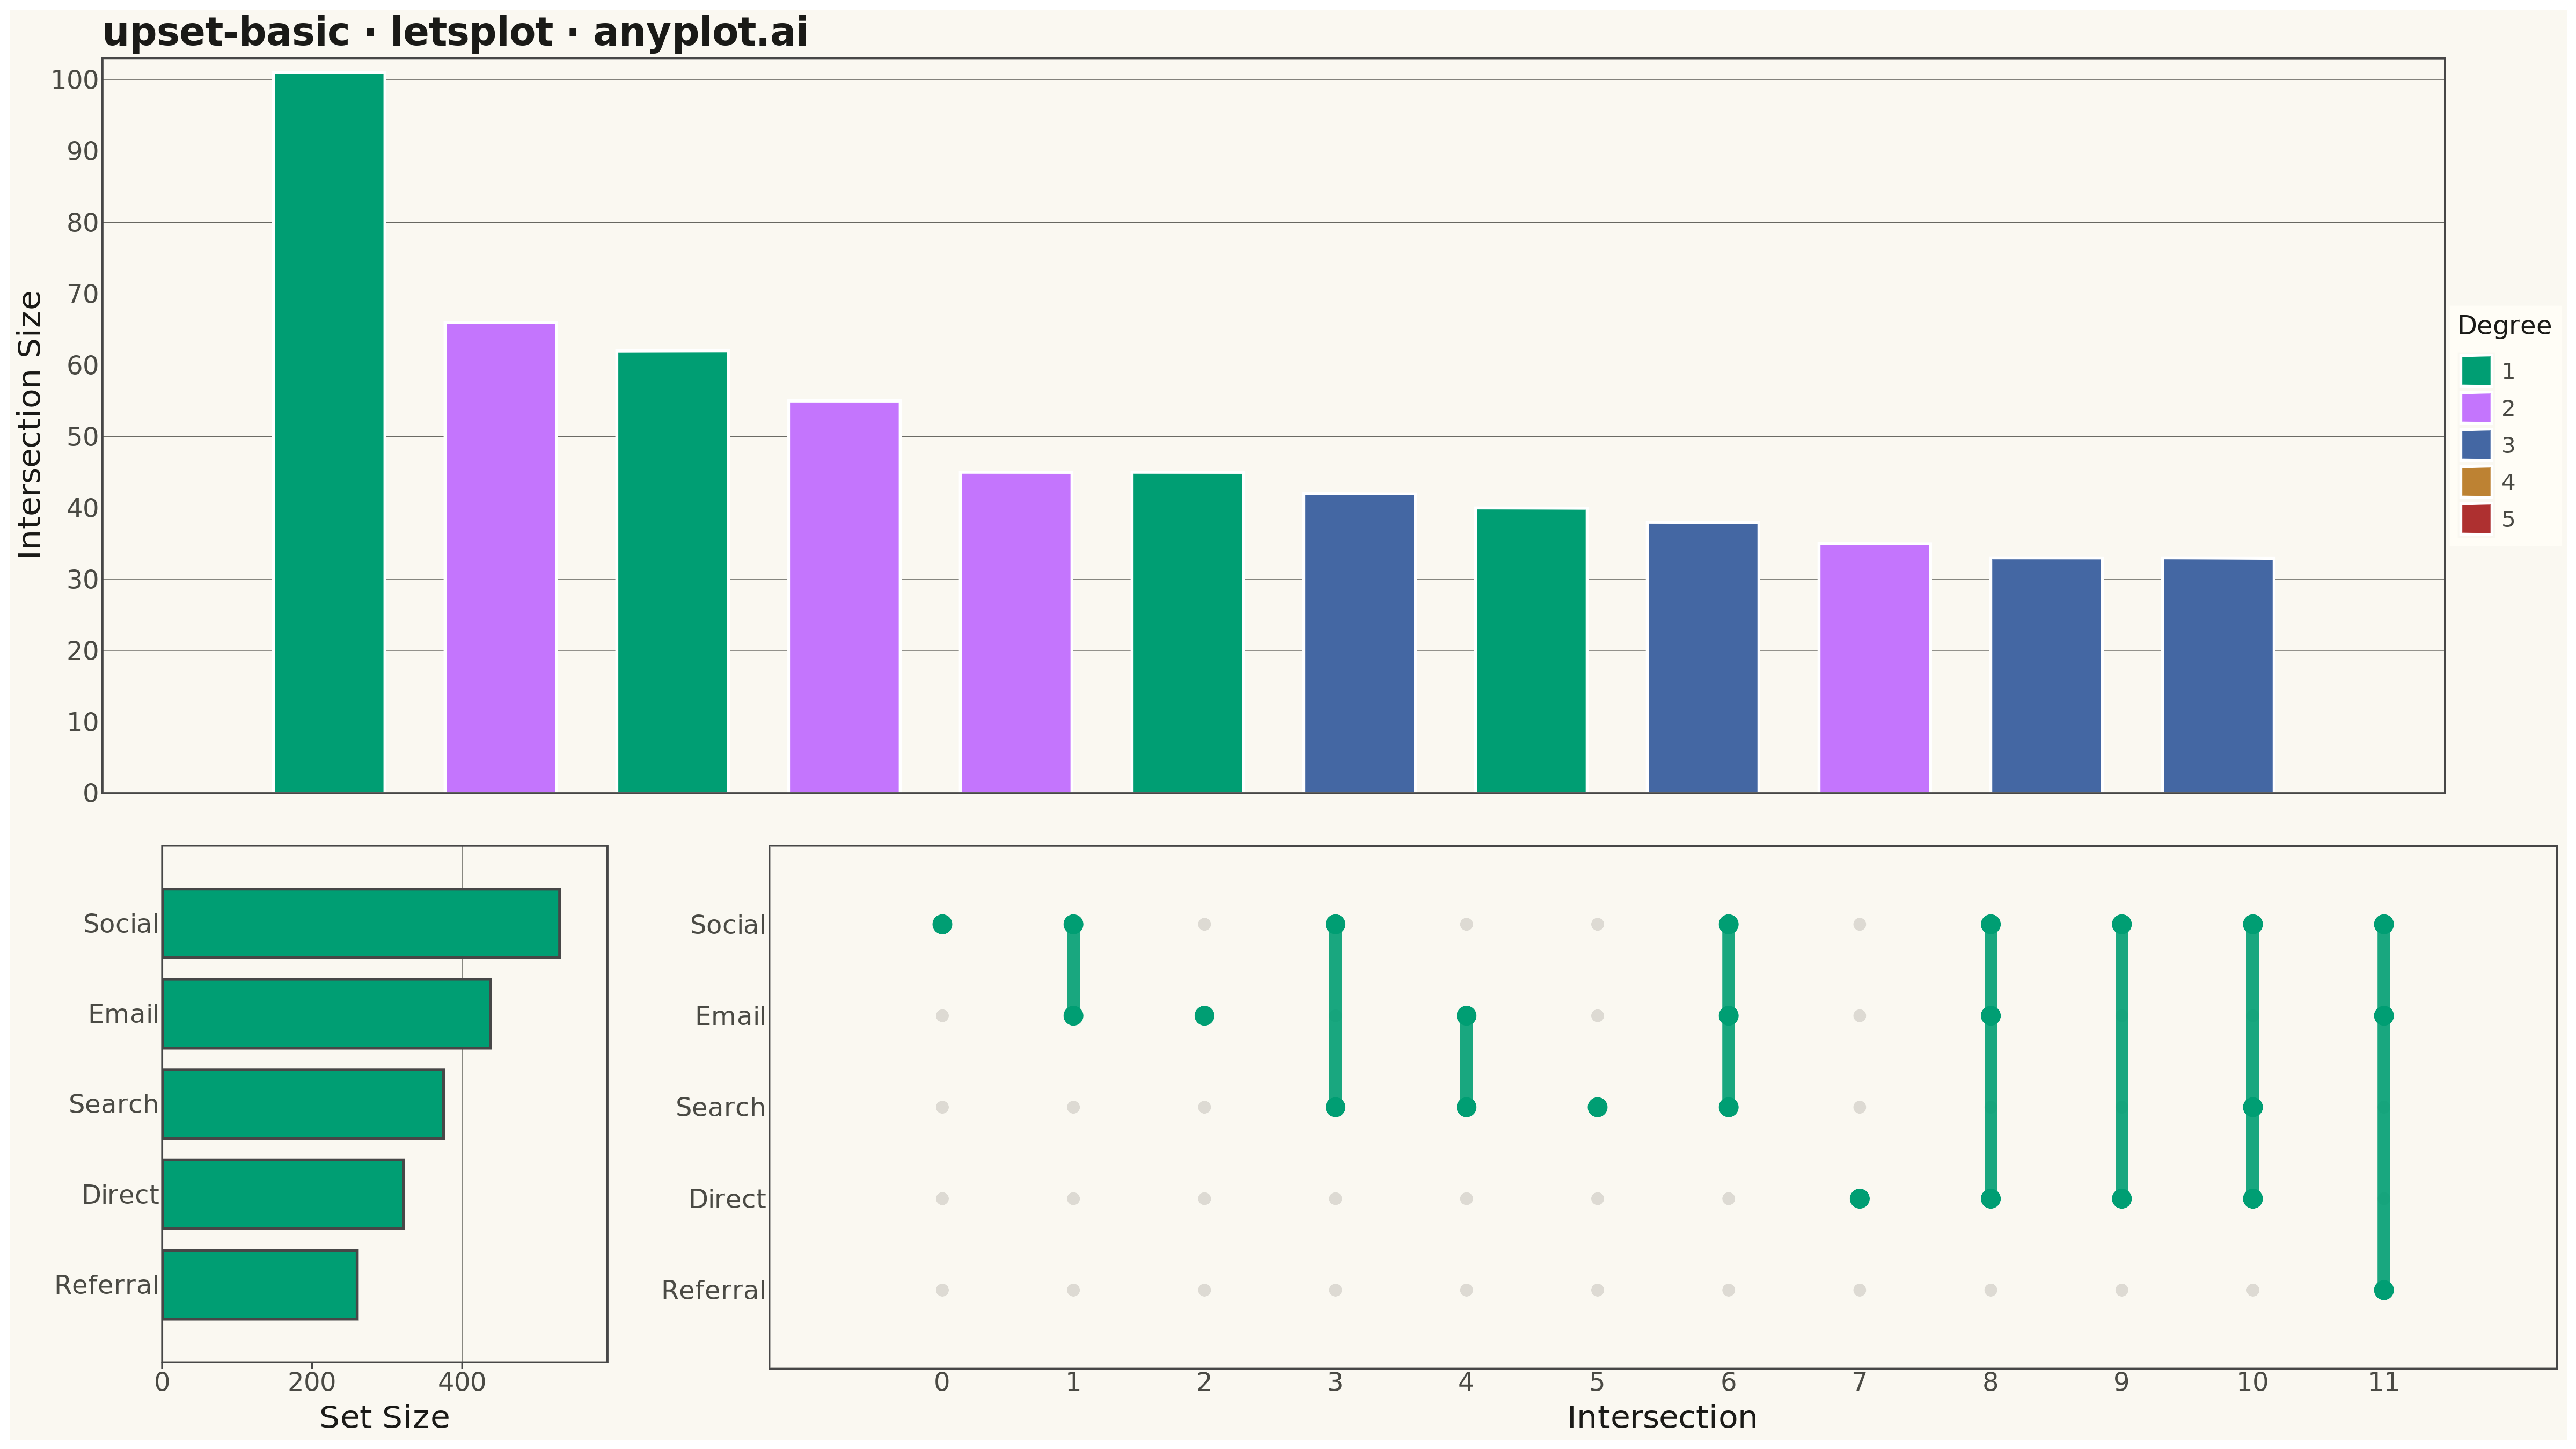
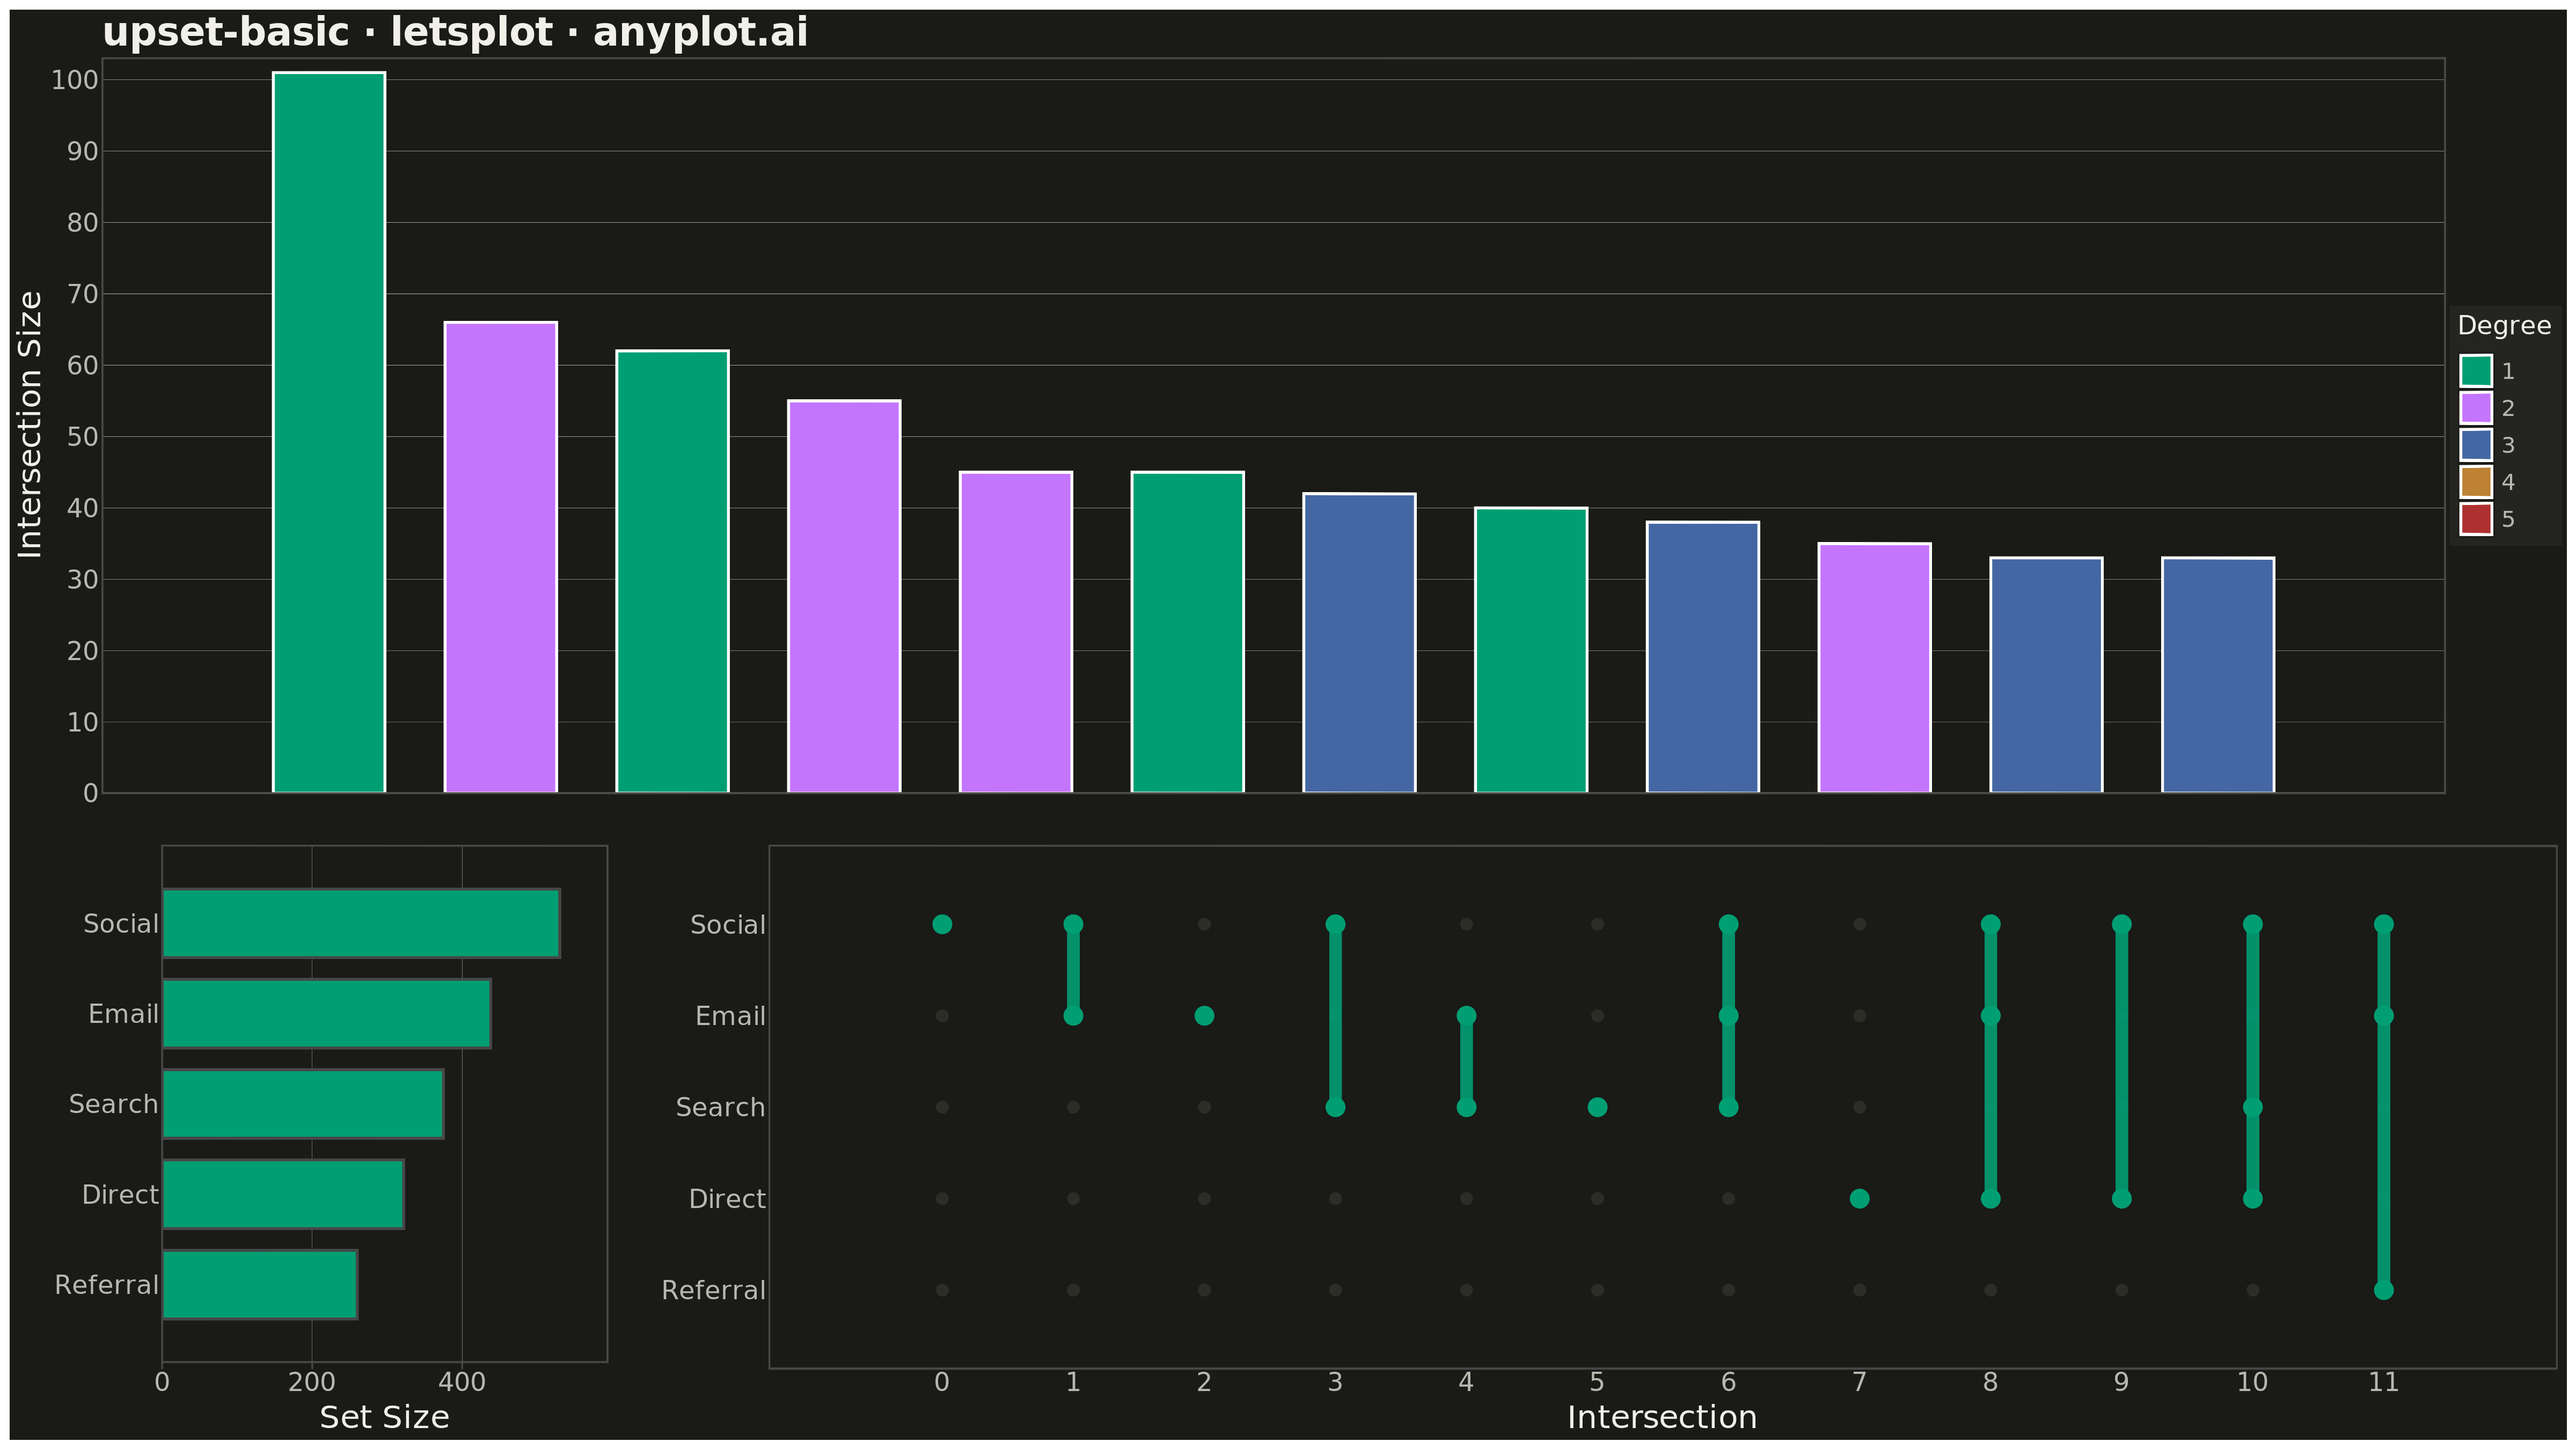
The same plot in 14 other libraries — Python: Altair, Bokeh, Matplotlib, Plotly, plotnine, Pygal, Seaborn; R: ggplot2; Julia: Makie.jl; JavaScript: Chart.js, D3.js, Apache ECharts, Highcharts, MUI X Charts. Compare all 15 side by side: UpSet Plot for Multi-Set Intersection Analysis in Python, R, Julia and JavaScript.
An UpSet plot visualizes intersections of multiple sets using a matrix-based layout that scales far better than Venn diagrams beyond 3 sets. A horizontal bar chart shows individual set sizes, a dot-matrix indicates which sets participate in each intersection, and a vertical bar chart above shows the intersection cardinality. This is the modern standard for set intersection analysis, making complex overlaps between many sets immediately readable.
""" anyplot.ai
upset-basic: UpSet Plot for Multi-Set Intersection Analysis
Library: letsplot 4.9.0 | Python 3.13.13
Quality: 90/100 | Created: 2026-05-13
"""

import os

import numpy as np
import pandas as pd
from lets_plot import (
    LetsPlot,
    aes,
    element_blank,
    element_line,
    element_rect,
    element_text,
    geom_bar,
    geom_point,
    geom_rect,
    geom_segment,
    ggbunch,
    ggplot,
    ggsave,
    ggsize,
    labs,
    scale_fill_manual,
    scale_x_continuous,
    scale_y_continuous,
    theme,
)


LetsPlot.setup_html()

# Theme tokens
THEME = os.getenv("ANYPLOT_THEME", "light")
PAGE_BG = "#FAF8F1" if THEME == "light" else "#1A1A17"
ELEVATED_BG = "#FFFDF6" if THEME == "light" else "#242420"
INK = "#1A1A17" if THEME == "light" else "#F0EFE8"
INK_SOFT = "#4A4A44" if THEME == "light" else "#B8B7B0"
BRAND = "#009E73"
IMPRINT = ["#009E73", "#C475FD", "#4467A3", "#BD8233", "#AE3030"]

# Data: user acquisition channels (marketing segments)
np.random.seed(42)
channels = ["Email", "Social", "Search", "Referral", "Direct"]
n_users = 1000
probs = [0.42, 0.55, 0.38, 0.25, 0.32]

raw = {ch: (np.random.random(n_users) < p) for ch, p in zip(channels, probs, strict=False)}
df = pd.DataFrame(raw)
df = df[df.any(axis=1)].reset_index(drop=True)

# Compute intersections sorted by size
df["key"] = df.apply(lambda r: frozenset(ch for ch in channels if r[ch]), axis=1)
inter = df.groupby("key").size().reset_index(name="count")
inter = inter.sort_values("count", ascending=False).head(12).reset_index(drop=True)
inter["idx"] = range(len(inter))
inter["degree"] = inter["key"].apply(len)
inter["degree_str"] = inter["degree"].astype(str)

# Set ordering: smallest size at bottom (y=0), largest at top
set_sizes_raw = df[channels].sum().sort_values(ascending=True)
ordered_sets = list(set_sizes_raw.index)
set_y = {s: i for i, s in enumerate(ordered_sets)}

# Dot matrix data
dot_rows = []
for _, row in inter.iterrows():
    for ch in channels:
        dot_rows.append({"x": row["idx"], "y": set_y[ch], "active": ch in row["key"]})
dot_df = pd.DataFrame(dot_rows)

# Vertical connecting lines for each intersection column
line_rows = []
for _, row in inter.iterrows():
    ys = [set_y[ch] for ch in channels if ch in row["key"]]
    if len(ys) > 1:
        line_rows.append({"x": row["idx"], "ymin": min(ys), "ymax": max(ys)})
line_df = pd.DataFrame(line_rows)

# Set size bars data (using geom_rect for precise horizontal bars)
bar_h = 0.38
set_df = pd.DataFrame(
    {"set": ordered_sets, "y": [set_y[s] for s in ordered_sets], "size": [int(set_sizes_raw[s]) for s in ordered_sets]}
)
set_df["xmin"] = 0
set_df["xmax"] = set_df["size"]
set_df["ymin"] = set_df["y"] - bar_h
set_df["ymax"] = set_df["y"] + bar_h

# Shared axis limits
y_lim = [-0.6, len(channels) - 0.4]
y_breaks = list(range(len(channels)))
x_lim = [-0.7, len(inter) - 0.3]
x_breaks = list(range(len(inter)))
max_set_size = int(set_df["size"].max())

# Shared base theme
base_theme = theme(
    plot_background=element_rect(fill=PAGE_BG, color=PAGE_BG),
    panel_background=element_rect(fill=PAGE_BG),
    panel_grid_major=element_line(color=INK_SOFT, size=0.15),
    panel_grid_minor=element_blank(),
    axis_title=element_text(color=INK, size=20),
    axis_text=element_text(color=INK_SOFT, size=16),
    axis_line=element_line(color=INK_SOFT),
    plot_title=element_text(color=INK, size=24, face="bold"),
    legend_background=element_rect(fill=ELEVATED_BG),
    legend_text=element_text(color=INK_SOFT, size=14),
    legend_title=element_text(color=INK, size=16),
)

# Intersection size bars (top panel)
degree_palette = {str(d): IMPRINT[d - 1] for d in range(1, 6)}

p_top = (
    ggplot(inter, aes(x="idx", y="count", fill="degree_str"))
    + geom_bar(stat="identity", width=0.65)
    + scale_fill_manual(values=degree_palette, name="Degree")
    + scale_x_continuous(limits=x_lim, breaks=x_breaks)
    + scale_y_continuous(expand=[0.02, 0])
    + labs(x="", y="Intersection Size", title="upset-basic · letsplot · anyplot.ai")
    + base_theme
    + theme(
        axis_text_x=element_blank(),
        axis_ticks_x=element_blank(),
        panel_grid_major_x=element_blank(),
        legend_position="right",
    )
)

# Dot matrix (bottom-right panel)
inactive_color = "#C0BDB5" if THEME == "light" else "#404038"

p_matrix = (
    ggplot()
    + geom_point(
        data=dot_df[~dot_df["active"]].reset_index(drop=True),
        mapping=aes(x="x", y="y"),
        color=inactive_color,
        size=3.5,
        alpha=0.5,
    )
    + geom_segment(data=line_df, mapping=aes(x="x", xend="x", y="ymin", yend="ymax"), color=BRAND, size=3.5, alpha=0.9)
    + geom_point(data=dot_df[dot_df["active"]].reset_index(drop=True), mapping=aes(x="x", y="y"), color=BRAND, size=5.5)
    + scale_x_continuous(limits=x_lim, breaks=x_breaks)
    + scale_y_continuous(limits=y_lim, breaks=y_breaks, labels=ordered_sets)
    + labs(x="Intersection", y="")
    + base_theme
    + theme(axis_ticks=element_blank(), panel_grid_major=element_blank())
)

# Set size bars (bottom-left panel, horizontal via geom_rect)
p_sets = (
    ggplot(set_df, aes(xmin="xmin", xmax="xmax", ymin="ymin", ymax="ymax"))
    + geom_rect(fill=BRAND, color=None)
    + scale_x_continuous(limits=[0, max_set_size * 1.12], expand=[0, 0])
    + scale_y_continuous(limits=y_lim, breaks=y_breaks, labels=ordered_sets)
    + labs(x="Set Size", y="")
    + base_theme
    + theme(axis_ticks_y=element_blank(), panel_grid_major_y=element_blank())
)

# Combine with ggbunch (1600x900 base; scale=3 → 4800x2700 px)
# Regions: (x, y, width, height) in relative [0,1] coordinates
top_h = 520 / 900
bot_h = 380 / 900
left_w = 380 / 1600
right_w = 1220 / 1600

fig = ggbunch(
    [p_top, p_sets, p_matrix], [(0, 0, 1.0, top_h), (0, top_h, left_w, bot_h), (left_w, top_h, right_w, bot_h)]
) + ggsize(1600, 900)

# Save
ggsave(fig, f"plot-{THEME}.png", path=".", scale=3)
ggsave(fig, f"plot-{THEME}.html", path=".")
Runnable source as JSON, for any HTTP client: https://api.anyplot.ai/specs/upset-basic/letsplot/code. Any spec id and library id listed in llms-full.txt fit the same URL shape; every URL below is complete and callable.
{
  "spec_id": "upset-basic",
  "language": "python",
  "library": "letsplot",
  "page": "https://anyplot.ai/upset-basic/python/letsplot",
  "hub": "https://anyplot.ai/upset-basic",
  "code_json": "https://api.anyplot.ai/specs/upset-basic/letsplot/code",
  "spec_json": "https://api.anyplot.ai/specs/upset-basic",
  "render_light_png": "https://storage.googleapis.com/anyplot-images/plots/upset-basic/python/letsplot/plot-light.png",
  "render_dark_png": "https://storage.googleapis.com/anyplot-images/plots/upset-basic/python/letsplot/plot-dark.png",
  "interactive_light_html": "https://storage.googleapis.com/anyplot-images/plots/upset-basic/python/letsplot/plot-light.html",
  "interactive_dark_html": "https://storage.googleapis.com/anyplot-images/plots/upset-basic/python/letsplot/plot-dark.html",
  "quality_score": 90.0,
  "license": "MIT",
  "guide": "https://anyplot.ai/llms.txt"
}
Part of UpSet Plot for Multi-Set Intersection Analysis on anyplot.ai.