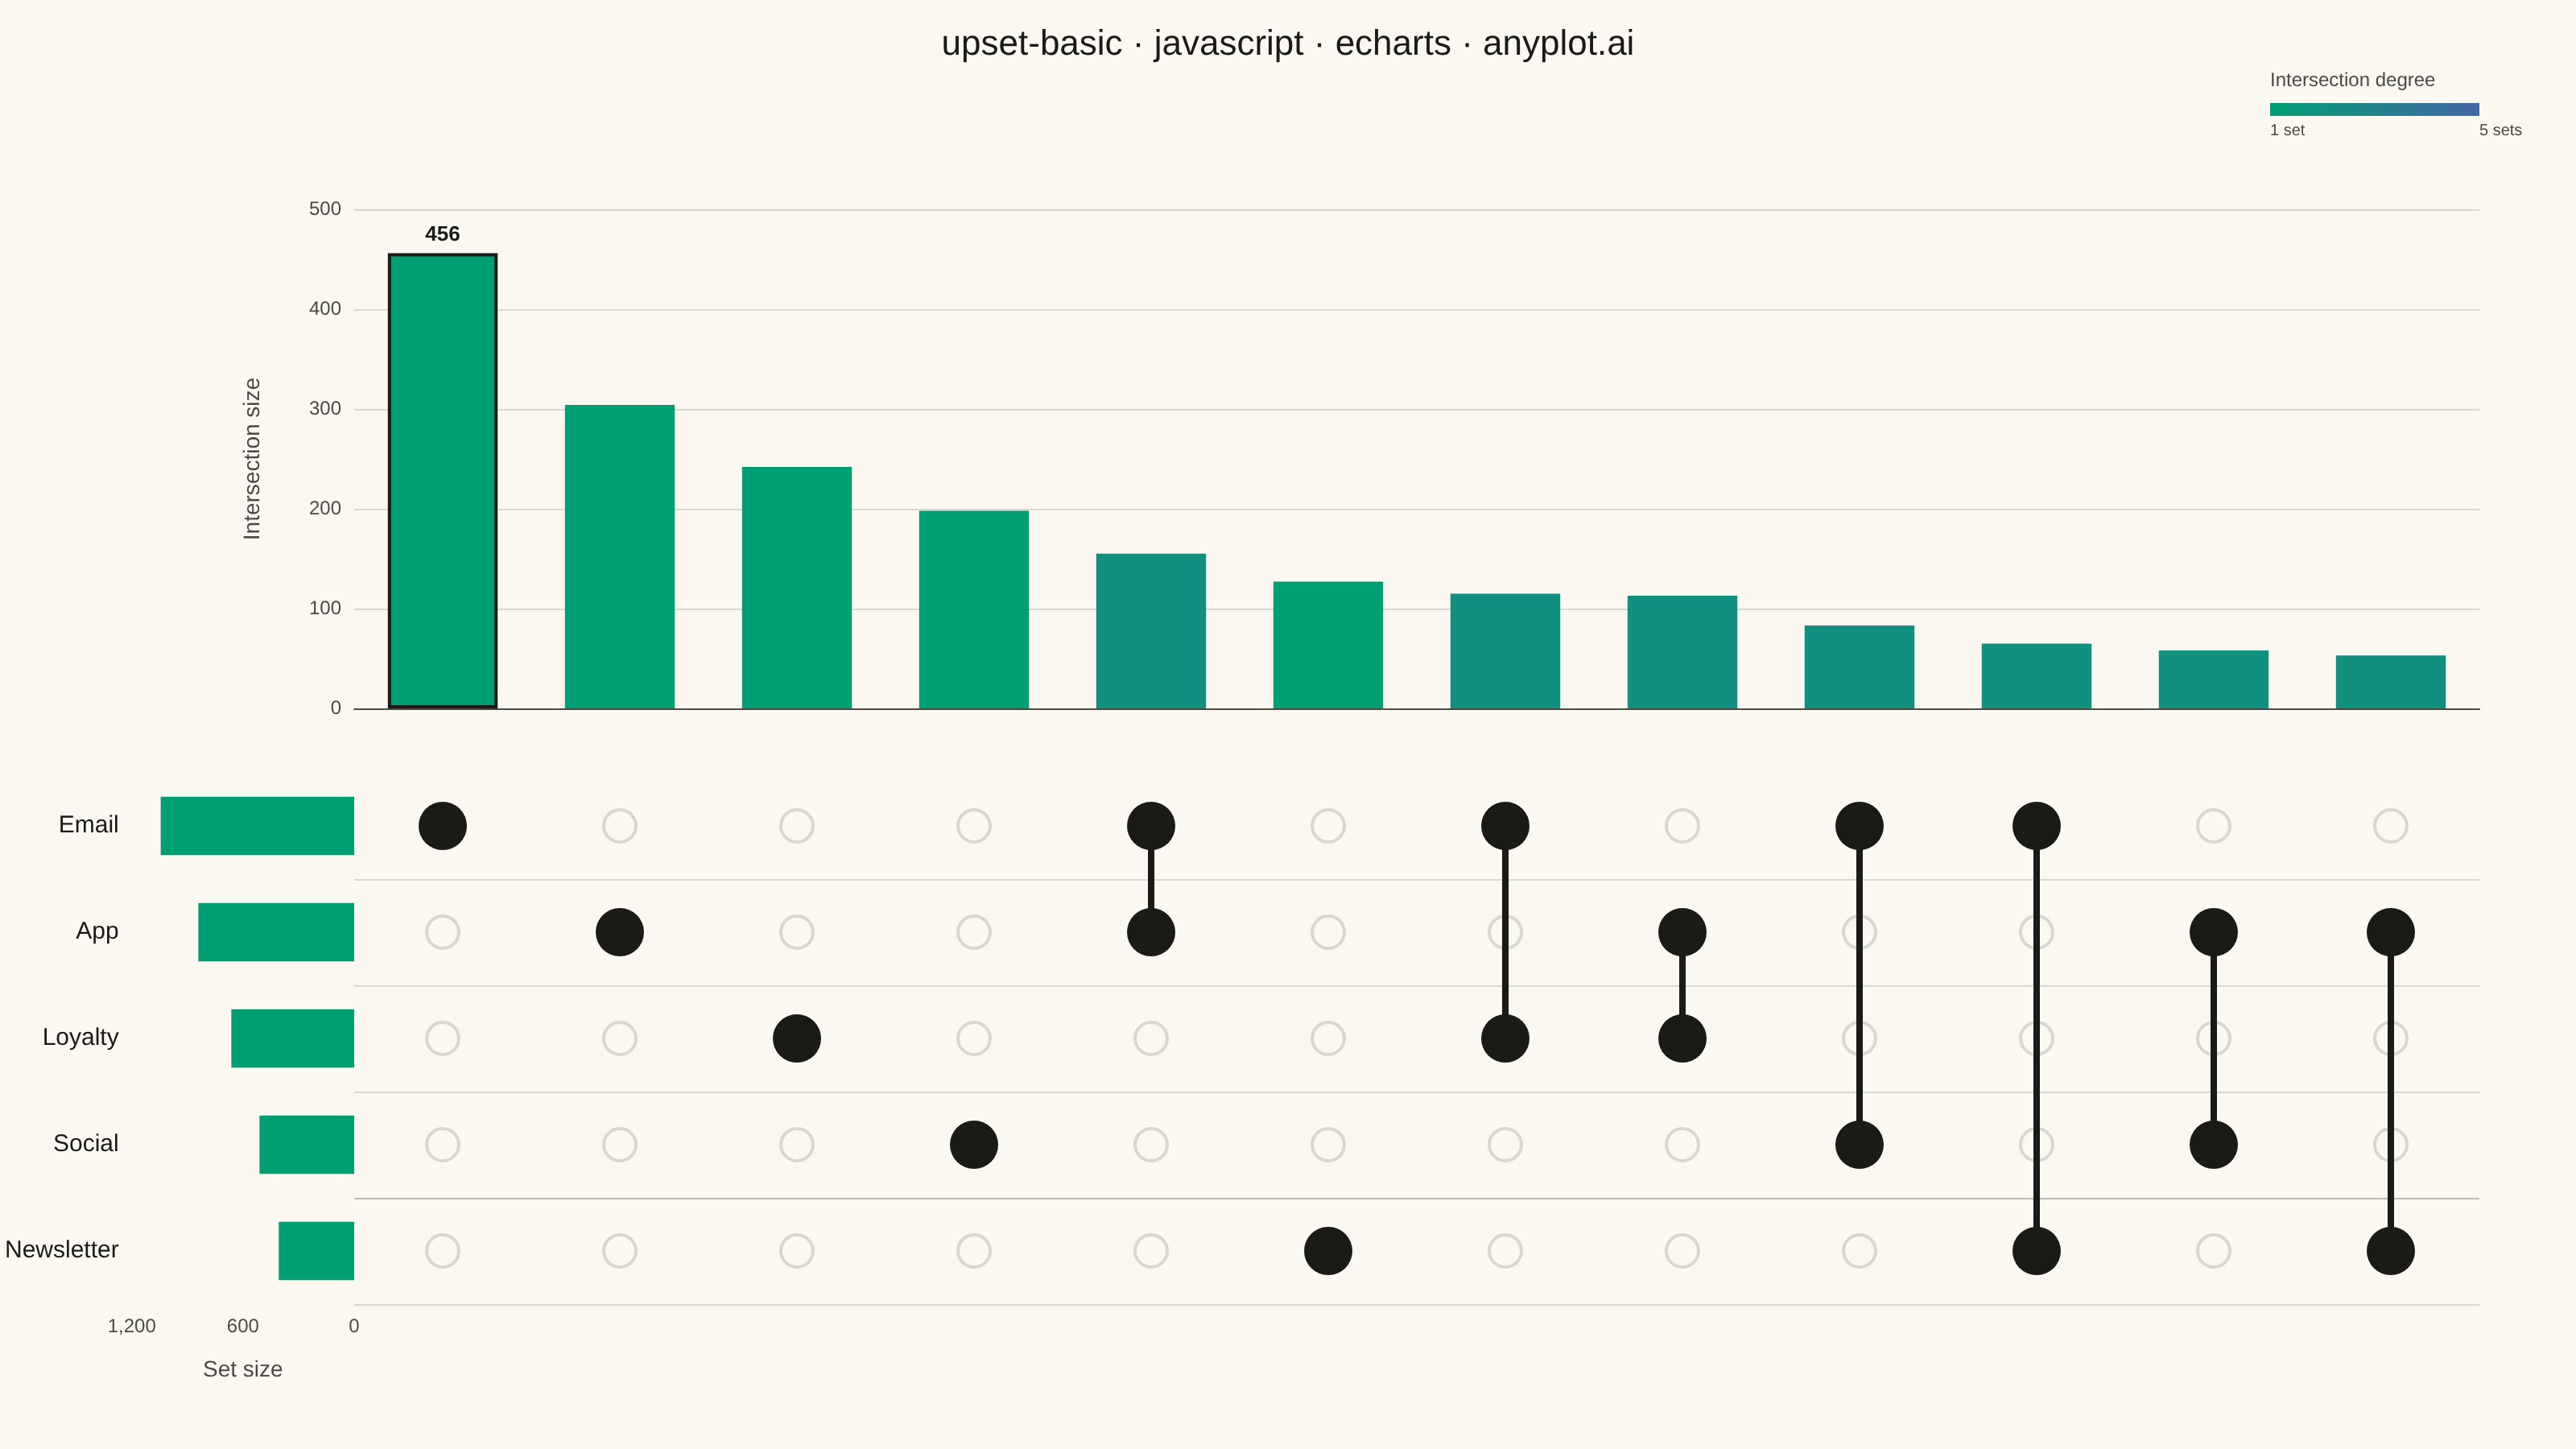
The same plot in 14 other libraries — JavaScript: Chart.js, D3.js, Highcharts, MUI X Charts; Python: Altair, Bokeh, lets-plot, Matplotlib, Plotly, plotnine, Pygal, Seaborn; R: ggplot2; Julia: Makie.jl. Compare all 15 side by side: UpSet Plot for Multi-Set Intersection Analysis in Python, R, Julia and JavaScript.
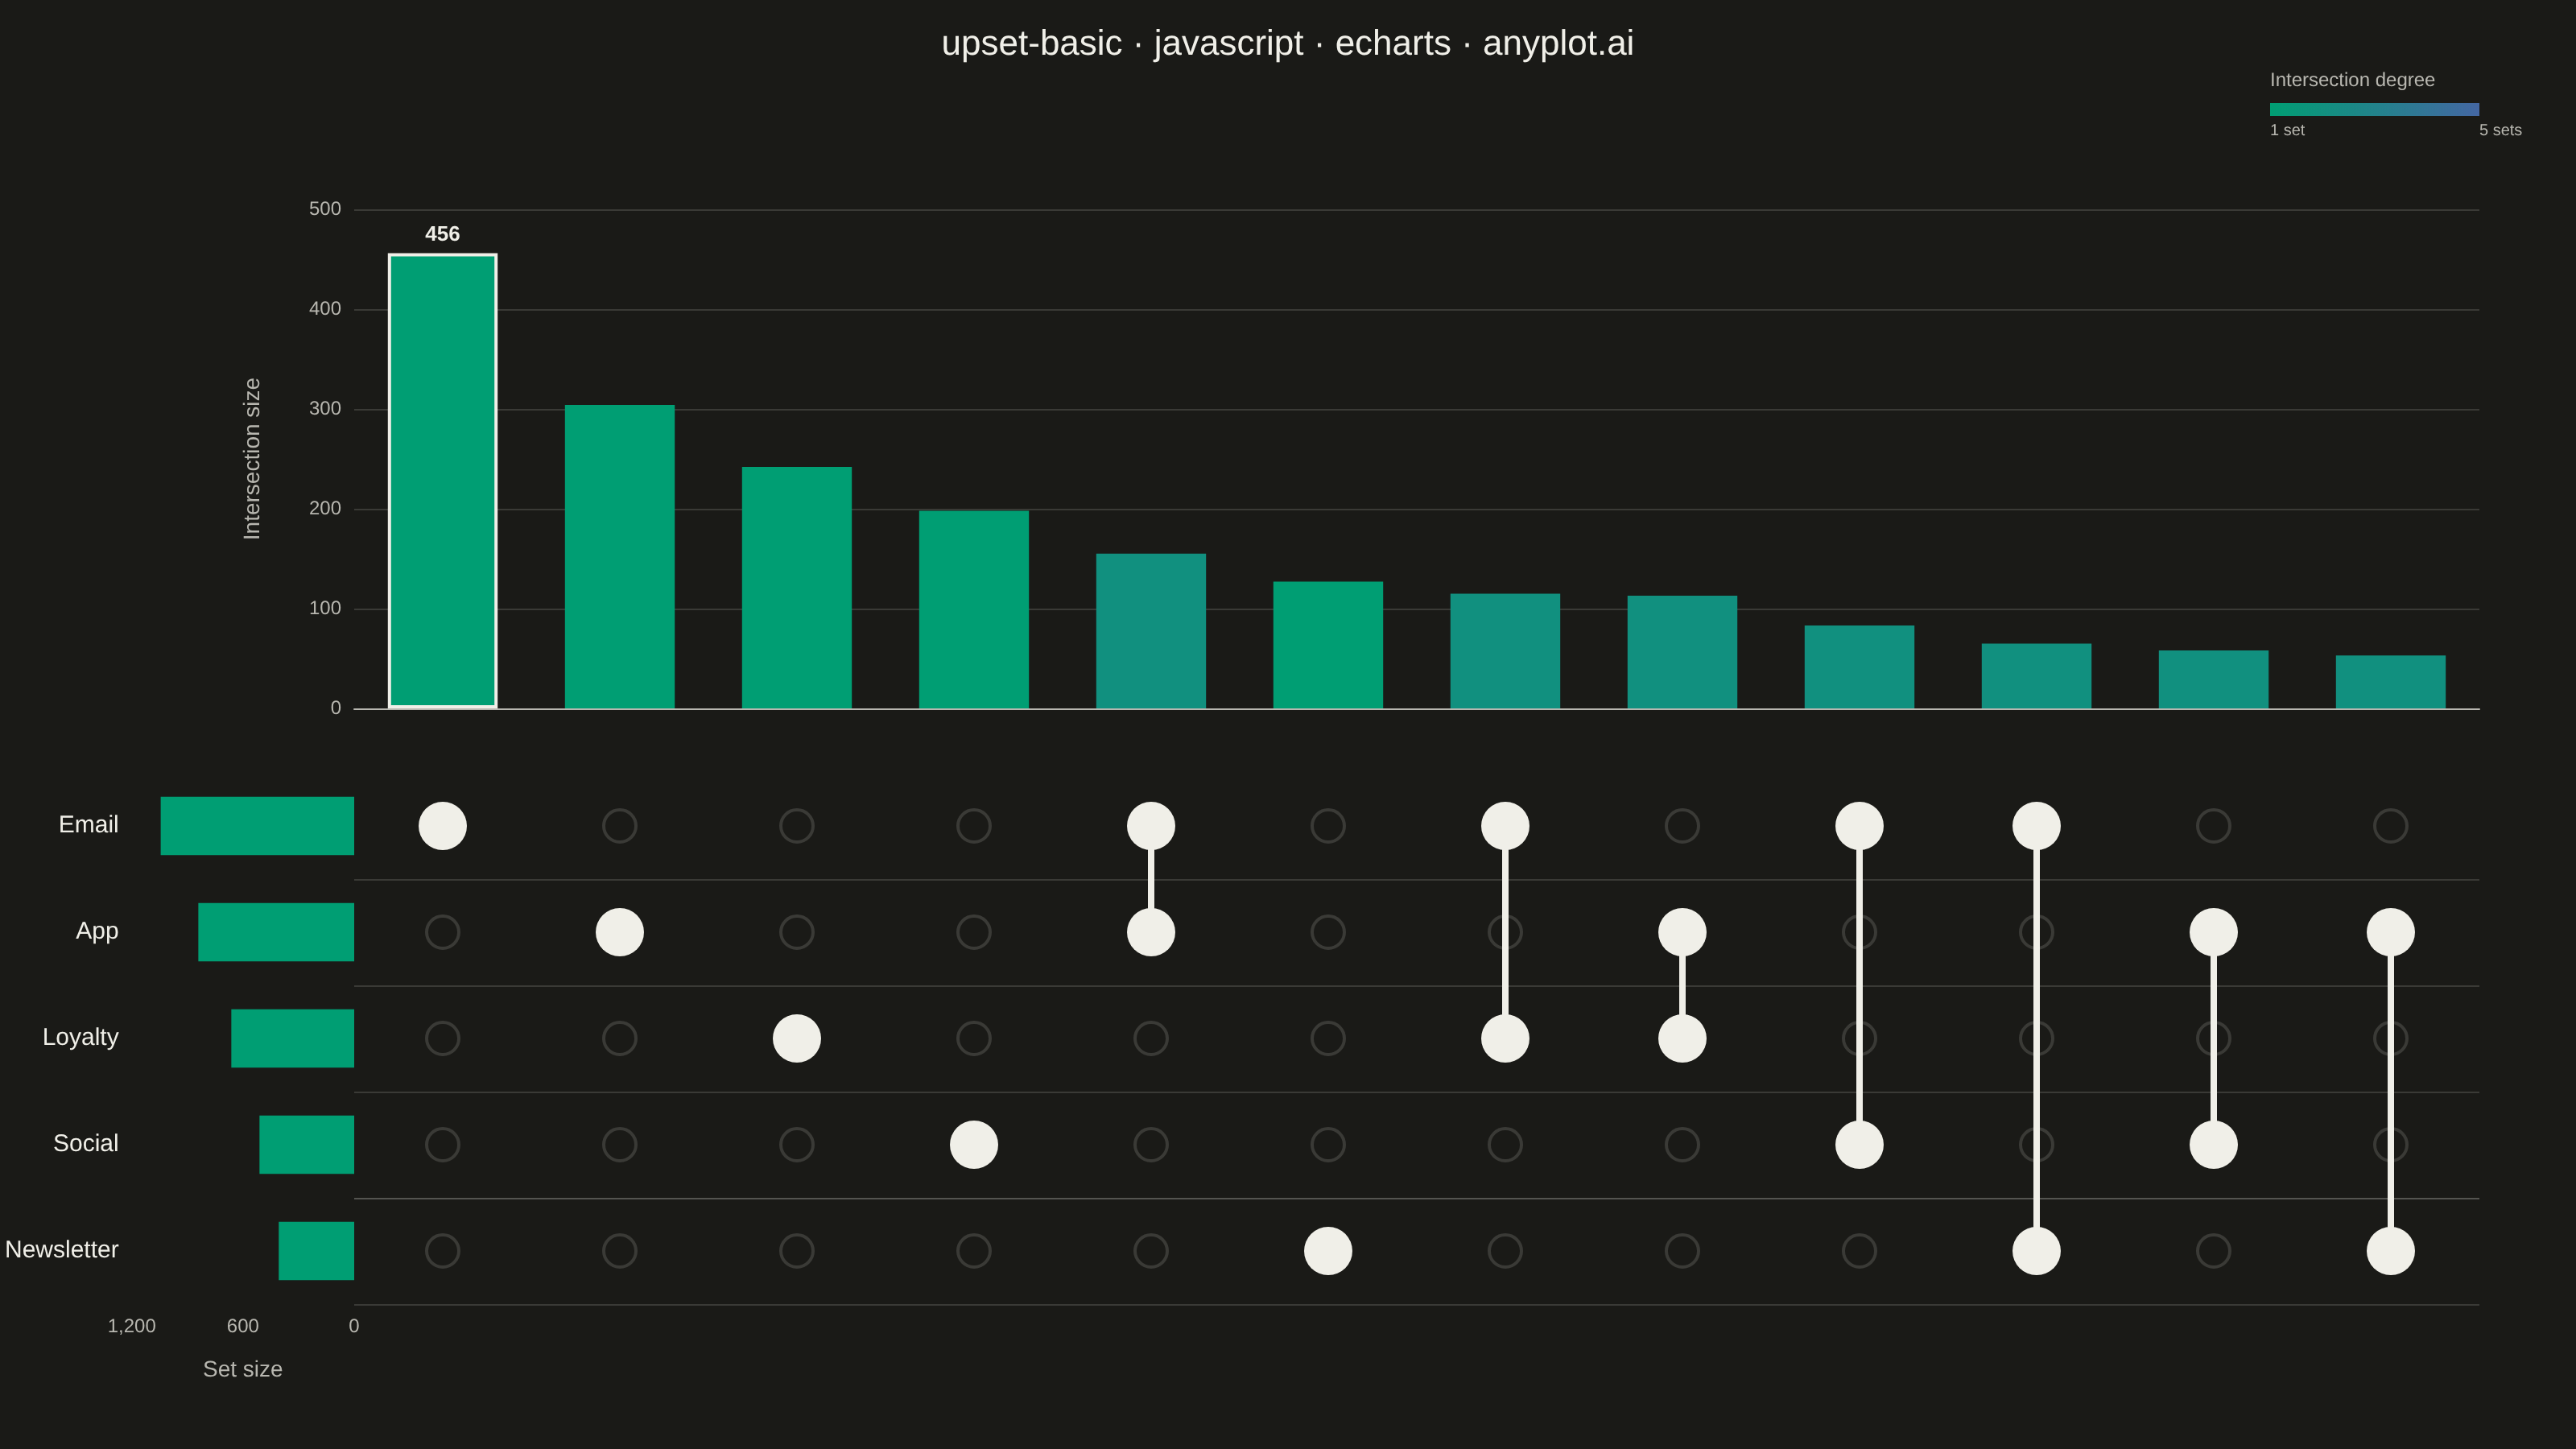
An UpSet plot visualizes intersections of multiple sets using a matrix-based layout that scales far better than Venn diagrams beyond 3 sets. A horizontal bar chart shows individual set sizes, a dot-matrix indicates which sets participate in each intersection, and a vertical bar chart above shows the intersection cardinality. This is the modern standard for set intersection analysis, making complex overlaps between many sets immediately readable.
// anyplot.ai
// upset-basic: UpSet Plot for Multi-Set Intersection Analysis
// Library: echarts 6.1.0 | JavaScript 22.23.2
// Quality: 89/100 | Created: 2026-09-09

//# anyplot-orientation: landscape
const t = window.ANYPLOT_TOKENS;

// --- Data: customer membership across five marketing-engagement criteria ---
function lcg(seed) {
  let s = seed >>> 0;
  return function () {
    s = (1103515245 * s + 12345) >>> 0;
    return (s % 2147483648) / 2147483648;
  };
}
const rand = lcg(42);

const setLabels = ["Email", "App", "Loyalty", "Social", "Newsletter"];
const probabilities = [0.34, 0.27, 0.21, 0.17, 0.13];
const elementCount = 3200;

const intersectionCounts = new Map();
const setTotals = new Array(setLabels.length).fill(0);

for (let i = 0; i < elementCount; i++) {
  let mask = 0;
  for (let s = 0; s < setLabels.length; s++) {
    if (rand() < probabilities[s]) mask |= 1 << s;
  }
  if (mask === 0) continue;
  intersectionCounts.set(mask, (intersectionCounts.get(mask) || 0) + 1);
  for (let s = 0; s < setLabels.length; s++) {
    if (mask & (1 << s)) setTotals[s]++;
  }
}

const intersections = Array.from(intersectionCounts.entries())
  .map(([mask, size]) => ({
    mask,
    size,
    degree: mask.toString(2).split("1").length - 1,
  }))
  .sort((a, b) => b.size - a.size)
  .slice(0, 12);

const maxDegree = setLabels.length;
const setSizeAxisMax = Math.ceil(Math.max(...setTotals) / 200) * 200;

// interpolate between the two imprint_seq stops by intersection degree
function seqColor(degree) {
  const ratio = maxDegree > 1 ? (degree - 1) / (maxDegree - 1) : 0;
  const hex = (c) => parseInt(c, 16);
  const from = t.seq[0].replace("#", "");
  const to = t.seq[1].replace("#", "");
  const r = Math.round(hex(from.slice(0, 2)) + ratio * (hex(to.slice(0, 2)) - hex(from.slice(0, 2))));
  const g = Math.round(hex(from.slice(2, 4)) + ratio * (hex(to.slice(2, 4)) - hex(from.slice(2, 4))));
  const b = Math.round(hex(from.slice(4, 6)) + ratio * (hex(to.slice(4, 6)) - hex(from.slice(4, 6))));
  return `rgb(${r}, ${g}, ${b})`;
}

// membership matrix dots — one entry per (column, row) cell
const dotData = [];
for (let col = 0; col < intersections.length; col++) {
  const mask = intersections[col].mask;
  for (let row = 0; row < setLabels.length; row++) {
    const member = (mask & (1 << row)) !== 0 ? 1 : 0;
    dotData.push({ value: [col, row, member] });
  }
}

// connecting lines — one entry per column, spanning min..max member row
const lineData = intersections.map((it, col) => {
  const rows = [];
  for (let row = 0; row < setLabels.length; row++) {
    if (it.mask & (1 << row)) rows.push(row);
  }
  return { value: [col, Math.min(...rows), Math.max(...rows)] };
});

// --- Init --------------------------------------------------------------
const chart = echarts.init(document.getElementById("container"));

const columnLabels = intersections.map(() => "");

// --- Option --------------------------------------------------------------
chart.setOption({
  animation: false,
  backgroundColor: "transparent",
  title: {
    text: "upset-basic · javascript · echarts · anyplot.ai",
    left: "center",
    top: 12,
    textStyle: { color: t.ink, fontSize: 22, fontWeight: 500 },
  },
  grid: [
    { id: "topBar", left: 220, right: 60, top: 130, bottom: 460 },
    { id: "leftBar", left: 40, right: 1380, top: 480, bottom: 90 },
    { id: "matrix", left: 220, right: 60, top: 480, bottom: 90 },
  ],
  graphic: [
    {
      type: "text",
      left: 1410,
      top: 44,
      style: { text: "Intersection degree", fill: t.inkSoft, fontSize: 12, fontWeight: 500 },
    },
    {
      type: "rect",
      left: 1410,
      top: 64,
      shape: { width: 130, height: 8 },
      style: {
        fill: new echarts.graphic.LinearGradient(0, 0, 1, 0, [
          { offset: 0, color: t.seq[0] },
          { offset: 1, color: t.seq[1] },
        ]),
      },
    },
    {
      type: "text",
      left: 1410,
      top: 76,
      style: { text: "1 set", fill: t.inkSoft, fontSize: 10 },
    },
    {
      type: "text",
      left: 1410 + 130,
      top: 76,
      style: { text: `${maxDegree} sets`, fill: t.inkSoft, fontSize: 10, align: "right" },
    },
  ],
  xAxis: [
    {
      gridId: "topBar",
      type: "category",
      data: columnLabels,
      axisLabel: { show: false },
      axisTick: { show: false },
      axisLine: { lineStyle: { color: t.inkSoft } },
    },
    {
      gridId: "leftBar",
      type: "value",
      inverse: true,
      position: "bottom",
      min: 0,
      max: setSizeAxisMax,
      interval: setSizeAxisMax / 2,
      name: "Set size",
      nameLocation: "middle",
      nameGap: 34,
      nameTextStyle: { color: t.inkSoft, fontSize: 14 },
      axisLabel: { color: t.inkSoft, fontSize: 12 },
      axisLine: { lineStyle: { color: t.inkSoft } },
      splitLine: { show: false },
    },
    {
      gridId: "matrix",
      type: "category",
      data: columnLabels,
      axisLabel: { show: false },
      axisTick: { show: false },
      axisLine: { show: false },
    },
  ],
  yAxis: [
    {
      gridId: "topBar",
      type: "value",
      name: "Intersection size",
      nameLocation: "middle",
      nameGap: 56,
      nameTextStyle: { color: t.inkSoft, fontSize: 14 },
      axisLabel: { color: t.inkSoft, fontSize: 12 },
      axisLine: { lineStyle: { color: t.inkSoft } },
      splitLine: { lineStyle: { color: t.grid } },
    },
    {
      gridId: "leftBar",
      type: "category",
      data: setLabels,
      inverse: true,
      axisLabel: { color: t.ink, fontSize: 15 },
      axisTick: { show: false },
      axisLine: { show: false },
    },
    {
      gridId: "matrix",
      type: "category",
      data: setLabels,
      inverse: true,
      axisLabel: { show: false },
      axisTick: { show: false },
      axisLine: { show: false },
      splitLine: {
        show: true,
        interval: 0,
        lineStyle: { color: t.grid },
      },
    },
  ],
  series: [
    {
      name: "Intersection size",
      type: "bar",
      xAxisIndex: 0,
      yAxisIndex: 0,
      barWidth: "62%",
      data: intersections.map((it, idx) => ({
        value: it.size,
        itemStyle:
          idx === 0
            ? { color: seqColor(it.degree), borderColor: t.ink, borderWidth: 2 }
            : { color: seqColor(it.degree) },
        label:
          idx === 0
            ? { show: true, position: "top", color: t.ink, fontSize: 13, fontWeight: 600 }
            : undefined,
      })),
    },
    {
      name: "Set size",
      type: "bar",
      xAxisIndex: 1,
      yAxisIndex: 1,
      barWidth: "55%",
      itemStyle: { color: t.palette[0] },
      data: setTotals,
    },
    {
      name: "connections",
      type: "custom",
      coordinateSystem: "cartesian2d",
      xAxisIndex: 2,
      yAxisIndex: 2,
      data: lineData,
      renderItem: (params, api) => {
        const col = api.value(0);
        const rowMin = api.value(1);
        const rowMax = api.value(2);
        if (rowMin === rowMax) return null;
        const p1 = api.coord([col, rowMin]);
        const p2 = api.coord([col, rowMax]);
        return {
          type: "line",
          shape: { x1: p1[0], y1: p1[1], x2: p2[0], y2: p2[1] },
          style: { stroke: t.ink, lineWidth: 4 },
          silent: true,
        };
      },
    },
    {
      name: "membership",
      type: "custom",
      coordinateSystem: "cartesian2d",
      xAxisIndex: 2,
      yAxisIndex: 2,
      data: dotData,
      renderItem: (params, api) => {
        const col = api.value(0);
        const row = api.value(1);
        const member = api.value(2) === 1;
        const pos = api.coord([col, row]);
        return {
          type: "circle",
          shape: { cx: pos[0], cy: pos[1], r: member ? 15 : 10 },
          style: member
            ? { fill: t.ink }
            : { fill: "transparent", stroke: t.grid, lineWidth: 2 },
          silent: true,
        };
      },
    },
  ],
});
Runnable source as JSON, for any HTTP client: https://api.anyplot.ai/specs/upset-basic/echarts/code. Any spec id and library id listed in llms-full.txt fit the same URL shape; every URL below is complete and callable.
{
  "spec_id": "upset-basic",
  "language": "javascript",
  "library": "echarts",
  "page": "https://anyplot.ai/upset-basic/javascript/echarts",
  "hub": "https://anyplot.ai/upset-basic",
  "code_json": "https://api.anyplot.ai/specs/upset-basic/echarts/code",
  "spec_json": "https://api.anyplot.ai/specs/upset-basic",
  "render_light_png": "https://storage.googleapis.com/anyplot-images/plots/upset-basic/javascript/echarts/plot-light.png",
  "render_dark_png": "https://storage.googleapis.com/anyplot-images/plots/upset-basic/javascript/echarts/plot-dark.png",
  "interactive_light_html": "https://storage.googleapis.com/anyplot-images/plots/upset-basic/javascript/echarts/plot-light.html",
  "interactive_dark_html": "https://storage.googleapis.com/anyplot-images/plots/upset-basic/javascript/echarts/plot-dark.html",
  "quality_score": 89.0,
  "license": "MIT",
  "guide": "https://anyplot.ai/llms.txt"
}
Part of UpSet Plot for Multi-Set Intersection Analysis on anyplot.ai.