The same plot in 14 other libraries — JavaScript: Chart.js, D3.js, Apache ECharts, Highcharts; Python: Altair, Bokeh, lets-plot, Matplotlib, Plotly, plotnine, Pygal, Seaborn; R: ggplot2; Julia: Makie.jl. Compare all 15 side by side: UpSet Plot for Multi-Set Intersection Analysis in Python, R, Julia and JavaScript.
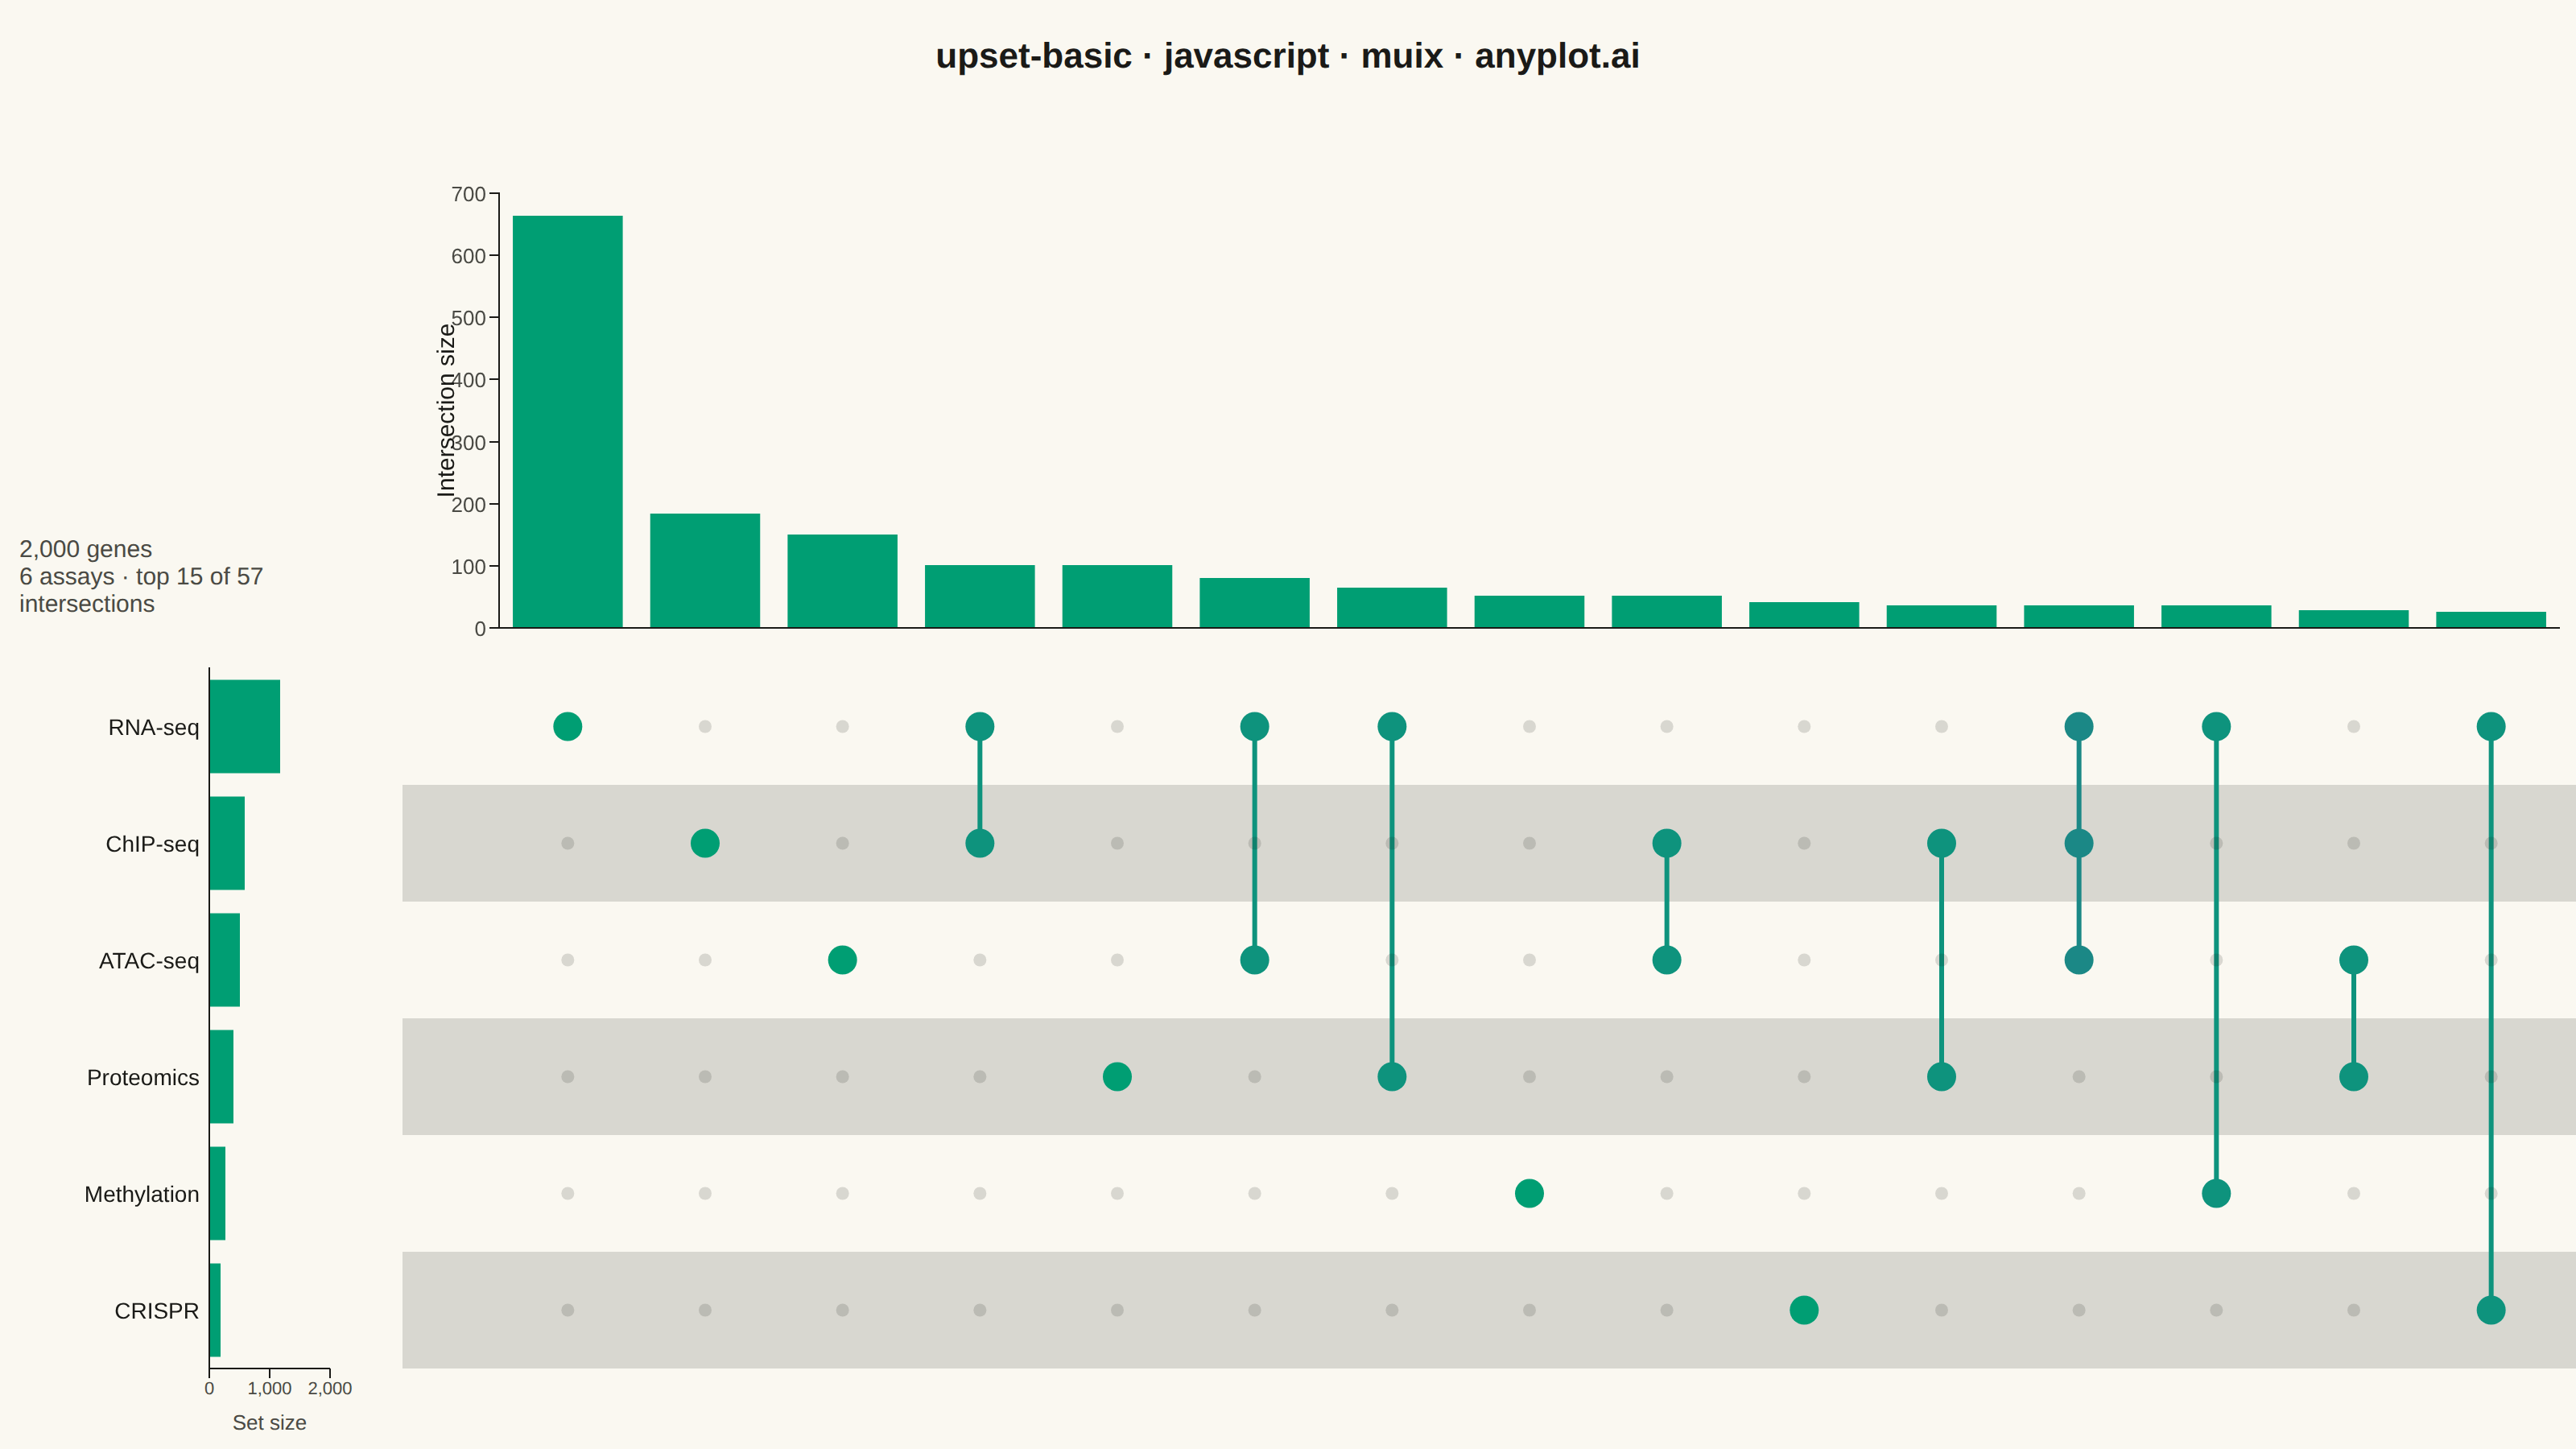
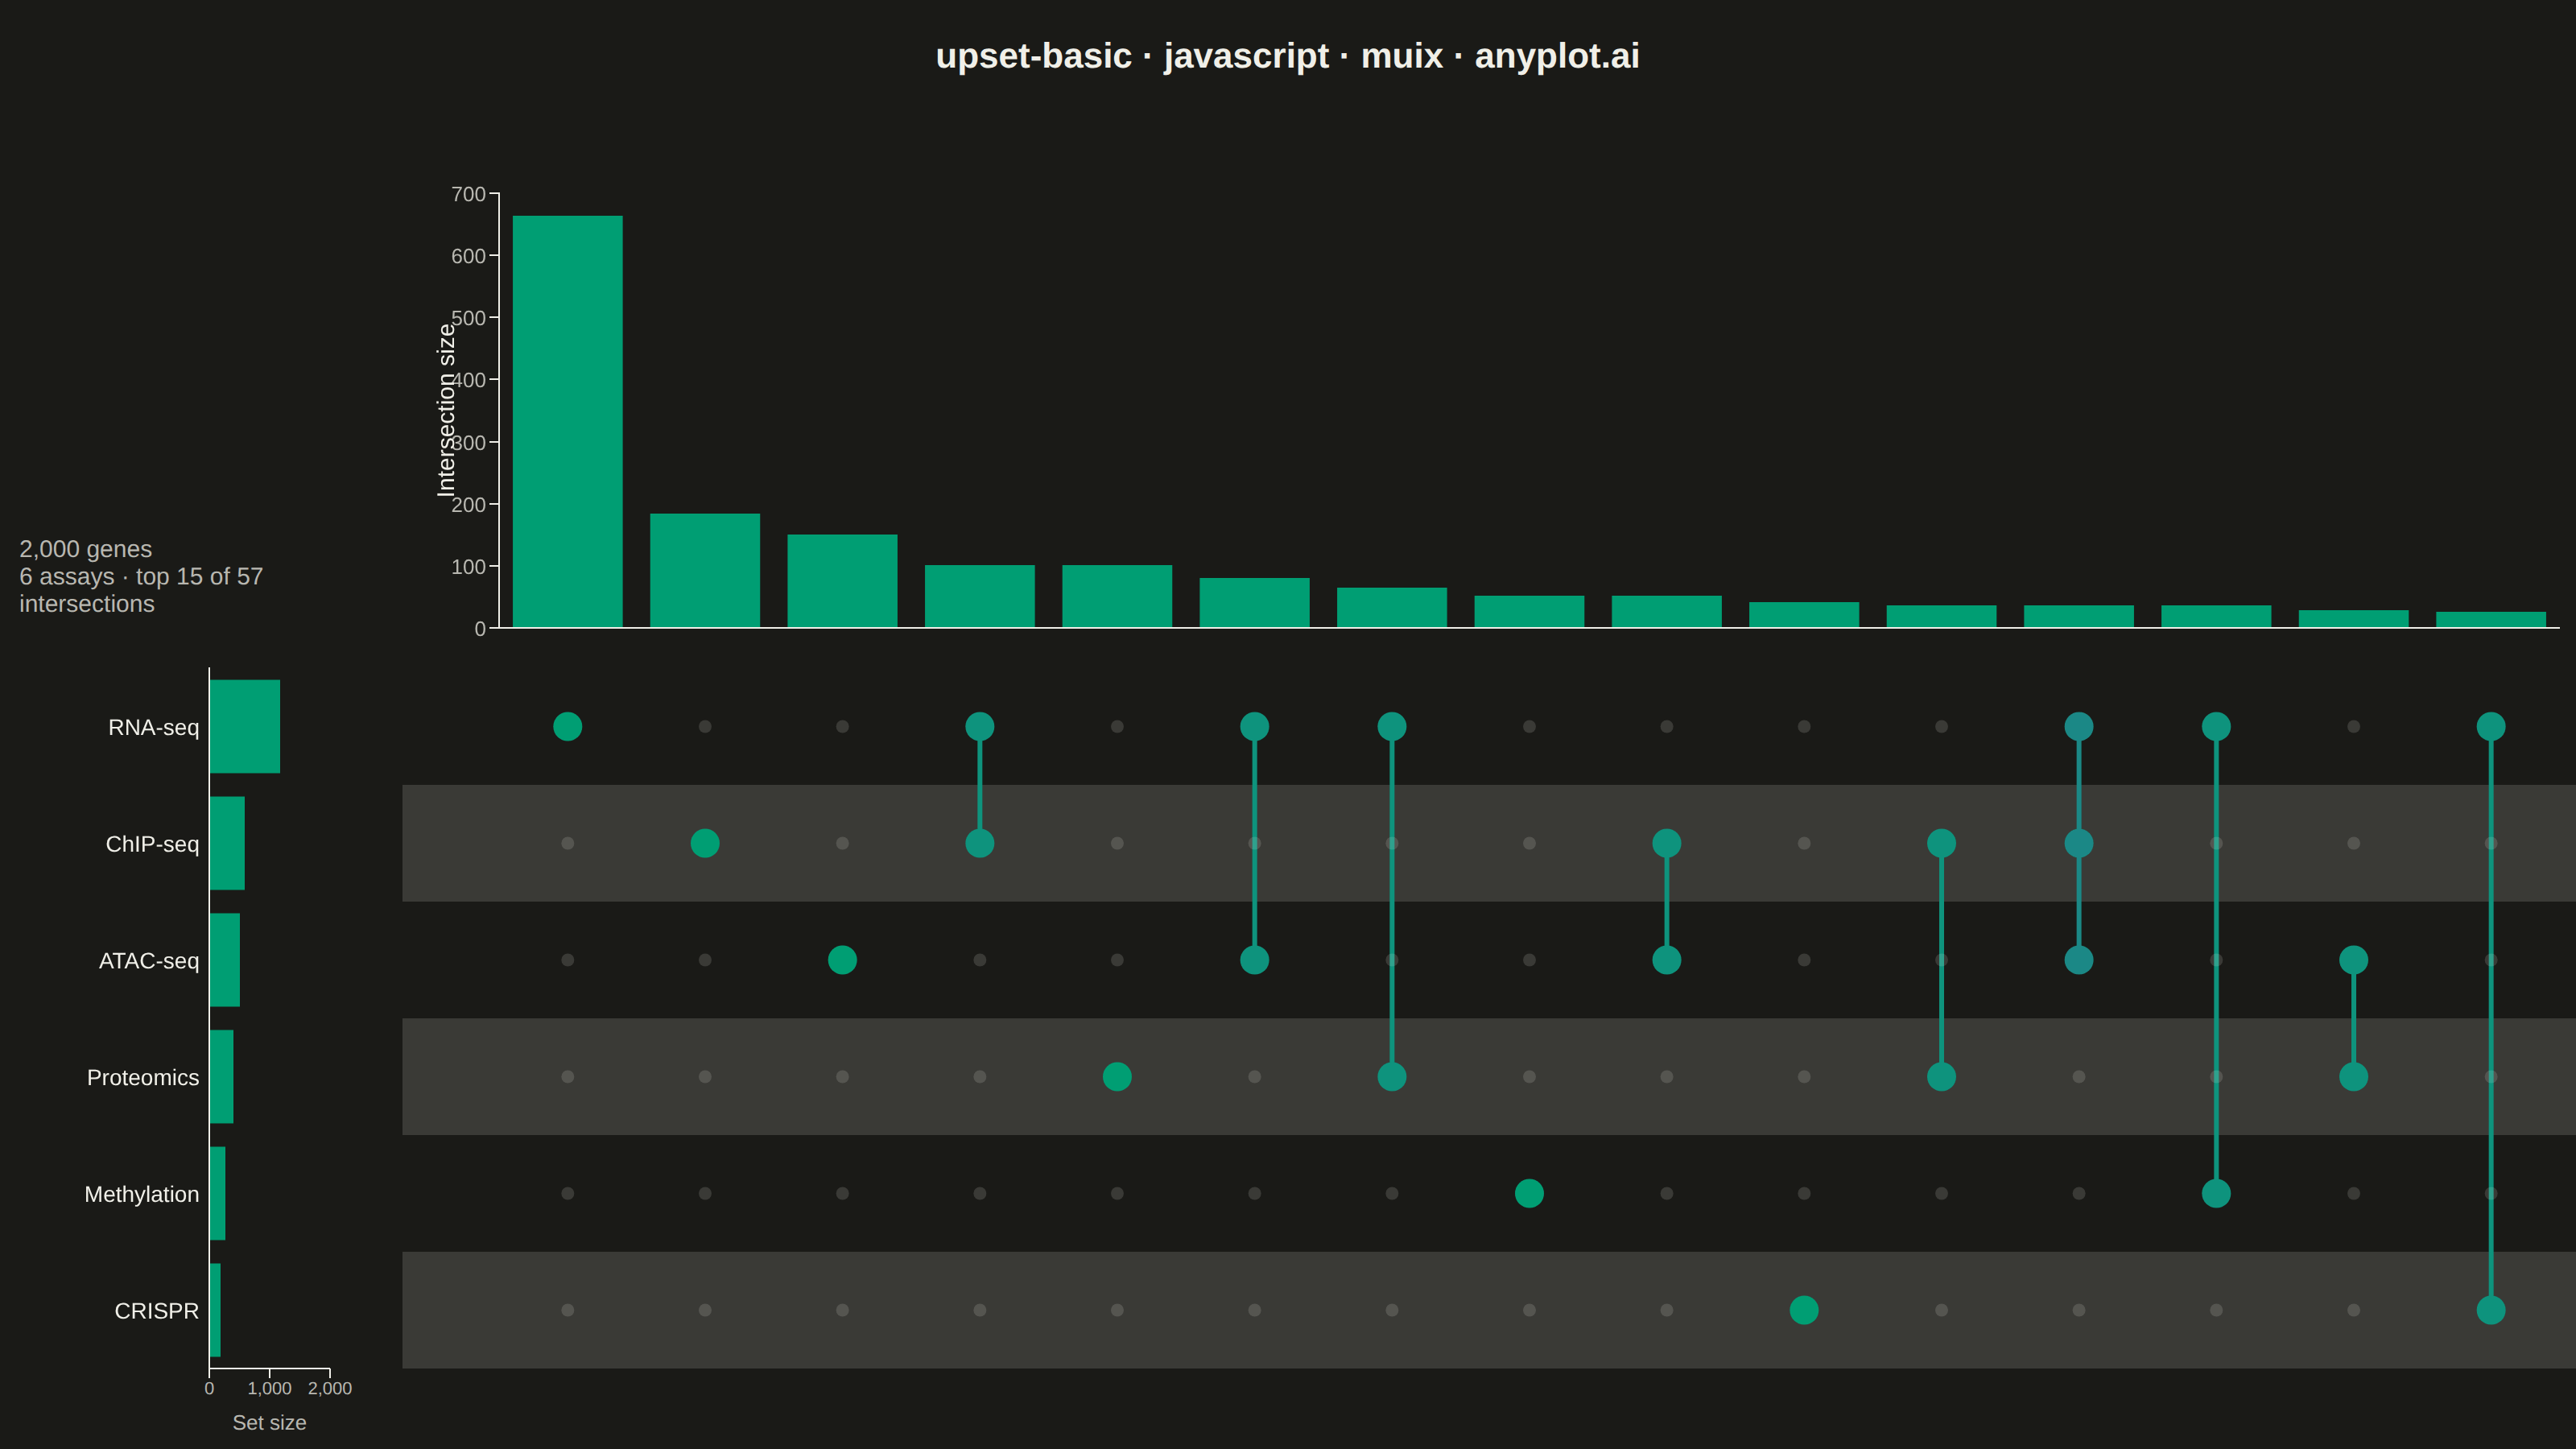
An UpSet plot visualizes intersections of multiple sets using a matrix-based layout that scales far better than Venn diagrams beyond 3 sets. A horizontal bar chart shows individual set sizes, a dot-matrix indicates which sets participate in each intersection, and a vertical bar chart above shows the intersection cardinality. This is the modern standard for set intersection analysis, making complex overlaps between many sets immediately readable.
// anyplot.ai
// upset-basic: UpSet Plot for Multi-Set Intersection Analysis
// Library: muix 7.29.1 | JavaScript 22.23.2
// Quality: 82/100 | Created: 2026-09-09
import { BarChart } from "@mui/x-charts/BarChart";
import { ChartsReferenceLine } from "@mui/x-charts/ChartsReferenceLine";
const t = window.ANYPLOT_TOKENS;
// --- Data (in-memory, deterministic) ----------------------------------------
// Six differential-expression gene sets from independent genomic assays.
// Each gene is assigned to sets by an LCG-driven coin flip per assay, with
// per-assay hit rates decreasing left to right — this naturally produces the
// realistic pattern real UpSet plots show: many genes flagged by one or two
// assays, progressively fewer flagged by many assays at once.
let seed = 42;
const nextRandom = () => {
seed = (Math.imul(seed, 1103515245) + 12345) & 0x7fffffff;
return seed / 0x7fffffff;
};
const SET_NAMES = [
"RNA-seq",
"ChIP-seq",
"ATAC-seq",
"Proteomics",
"Methylation",
"CRISPR",
];
const HIT_RATES = [0.38, 0.29, 0.24, 0.19, 0.14, 0.1];
const GENE_COUNT = 2000;
const setSizes = new Array(SET_NAMES.length).fill(0);
const comboCounts = new Map();
for (let i = 0; i < GENE_COUNT; i += 1) {
const memberIndices = [];
HIT_RATES.forEach((rate, setIndex) => {
if (nextRandom() < rate) memberIndices.push(setIndex);
});
if (memberIndices.length === 0) memberIndices.push(0); // every gene flagged by at least one assay
memberIndices.forEach((setIndex) => {
setSizes[setIndex] += 1;
});
const key = memberIndices.join(",");
comboCounts.set(key, (comboCounts.get(key) || 0) + 1);
}
const TOTAL_COMBOS = comboCounts.size;
const intersections = Array.from(comboCounts.entries())
.map(([key, size]) => {
const setIndices = key.split(",").map(Number);
return { setIndices, size, degree: setIndices.length };
})
.sort((a, b) => b.size - a.size || a.degree - b.degree)
.slice(0, 15);
const MEAN_SIZE =
intersections.reduce((sum, d) => sum + d.size, 0) / intersections.length;
// --- Degree → color (Imprint sequential ramp: single-set green → all-set blue)
const hexToRgb = (hex) => {
const n = parseInt(hex.slice(1), 16);
return [(n >> 16) & 255, (n >> 8) & 255, n & 255];
};
const mixHex = (hexA, hexB, frac) => {
const a = hexToRgb(hexA);
const b = hexToRgb(hexB);
const [r, g, bl] = a.map((v, i) => Math.round(v + (b[i] - v) * frac));
return `rgb(${r}, ${g}, ${bl})`;
};
const maxDegree = SET_NAMES.length;
const degreeColor = (degree) =>
mixHex(
t.seq[0],
t.seq[1],
maxDegree > 1 ? (degree - 1) / (maxDegree - 1) : 0,
);
// --- Layout — title bar, then a 2x2 grid: corner / top bars / set bars / matrix
const W = window.ANYPLOT_SIZE.width;
const H = window.ANYPLOT_SIZE.height;
const TITLE_H = 70;
const LEFT_PANEL = 250;
const TOP_PANEL = 330;
const MATRIX_W = W - LEFT_PANEL;
const MATRIX_H = H - TITLE_H - TOP_PANEL;
// Shared margins: the top bar chart and the matrix columns share TOP_MARGIN's
// left/right, and the set-size bar chart and the matrix rows share
// LEFT_MARGIN's top/bottom — that's what keeps dots aligned under their bars.
const TOP_MARGIN = { left: 60, right: 10, top: 50, bottom: 10 };
const LEFT_MARGIN = { left: 130, right: 45, top: 15, bottom: 50 };
const colWidth =
(MATRIX_W - TOP_MARGIN.left - TOP_MARGIN.right) / intersections.length;
const colCenterX = (i) => TOP_MARGIN.left + (i + 0.5) * colWidth;
const rowHeight =
(MATRIX_H - LEFT_MARGIN.top - LEFT_MARGIN.bottom) / SET_NAMES.length;
const rowCenterY = (j) => LEFT_MARGIN.top + (j + 0.5) * rowHeight;
const TITLE = "upset-basic · javascript · muix · anyplot.ai";
const TITLE_FONTSIZE =
TITLE.length > 67 ? Math.round(22 * (67 / TITLE.length)) : 22;
export default function Chart() {
return (
<div style={{ width: W, height: H, background: t.pageBg }}>
<div
style={{
height: TITLE_H,
display: "flex",
alignItems: "center",
justifyContent: "center",
fontSize: TITLE_FONTSIZE,
fontWeight: 600,
color: t.ink,
fontFamily: "Roboto, Helvetica, Arial, sans-serif",
}}
>
{TITLE}
</div>
<div
style={{
width: W,
height: H - TITLE_H,
display: "grid",
gridTemplateColumns: `${LEFT_PANEL}px ${MATRIX_W}px`,
gridTemplateRows: `${TOP_PANEL}px ${MATRIX_H}px`,
}}
>
<div
style={{
gridColumn: 1,
gridRow: 1,
display: "flex",
flexDirection: "column",
justifyContent: "flex-end",
padding: "0 12px 16px 12px",
boxSizing: "border-box",
}}
>
<div style={{ fontSize: 13, color: t.inkSoft, marginBottom: 10 }}>
Degree
</div>
<div
style={{
display: "flex",
alignItems: "center",
gap: 6,
marginBottom: 16,
}}
>
<div
style={{
width: 70,
height: 8,
borderRadius: 4,
background: `linear-gradient(to right, ${t.seq[0]}, ${t.seq[1]})`,
}}
/>
<div style={{ fontSize: 12, color: t.inkSoft }}>
1 → {SET_NAMES.length} sets
</div>
</div>
<div style={{ fontSize: 15, color: t.inkSoft }}>
{GENE_COUNT.toLocaleString()} genes
</div>
<div style={{ fontSize: 15, color: t.inkSoft }}>
{SET_NAMES.length} assays · top {intersections.length} of{" "}
{TOTAL_COMBOS} intersections
</div>
</div>
<div style={{ gridColumn: 2, gridRow: 1 }}>
<BarChart
width={MATRIX_W}
height={TOP_PANEL}
skipAnimation
margin={TOP_MARGIN}
series={[
{ data: intersections.map((d) => d.size), color: t.palette[0] },
]}
xAxis={[
{
scaleType: "band",
data: intersections.map((_, i) => String(i)),
valueFormatter: () => "",
disableTicks: true,
},
]}
yAxis={[
{
label: "Intersection size",
labelStyle: { fontSize: 15, fill: t.ink },
tickLabelStyle: { fontSize: 13, fill: t.inkSoft },
},
]}
slotProps={{ legend: { hidden: true } }}
sx={{
"& .MuiChartsAxis-line": { stroke: t.inkSoft },
"& .MuiChartsGrid-line": { stroke: t.grid },
}}
>
<ChartsReferenceLine
y={MEAN_SIZE}
label={`Mean: ${Math.round(MEAN_SIZE)}`}
labelAlign="end"
labelStyle={{ fontSize: 12, fill: t.inkSoft }}
lineStyle={{ stroke: t.inkSoft, strokeDasharray: "4 4" }}
/>
</BarChart>
</div>
<div style={{ gridColumn: 1, gridRow: 2 }}>
<BarChart
layout="horizontal"
width={LEFT_PANEL}
height={MATRIX_H}
skipAnimation
margin={LEFT_MARGIN}
series={[{ data: setSizes, color: t.palette[0] }]}
yAxis={[
{
scaleType: "band",
data: SET_NAMES,
tickLabelStyle: { fontSize: 14, fill: t.ink },
disableTicks: true,
},
]}
xAxis={[
{
label: "Set size",
labelStyle: { fontSize: 13, fill: t.inkSoft },
tickLabelStyle: { fontSize: 11, fill: t.inkSoft },
},
]}
slotProps={{ legend: { hidden: true } }}
sx={{
"& .MuiChartsAxis-line": { stroke: t.inkSoft },
"& .MuiChartsGrid-line": { stroke: t.grid },
}}
/>
</div>
<div style={{ gridColumn: 2, gridRow: 2 }}>
<svg width={MATRIX_W} height={MATRIX_H}>
{SET_NAMES.map(
(_, j) =>
j % 2 === 1 && (
<rect
key={`band-${j}`}
x={0}
y={LEFT_MARGIN.top + j * rowHeight}
width={MATRIX_W}
height={rowHeight}
fill={t.grid}
/>
),
)}
{intersections.map((inter, i) => {
const cx = colCenterX(i);
const color = degreeColor(inter.degree);
const memberRowsY = inter.setIndices.map((si) => rowCenterY(si));
const yTop = Math.min(...memberRowsY);
const yBottom = Math.max(...memberRowsY);
return (
<g key={`col-${i}`}>
{inter.setIndices.length > 1 && (
<line
x1={cx}
y1={yTop}
x2={cx}
y2={yBottom}
stroke={color}
strokeWidth={3}
/>
)}
{SET_NAMES.map((_, j) => {
const active = inter.setIndices.includes(j);
return (
<circle
key={`dot-${i}-${j}`}
cx={cx}
cy={rowCenterY(j)}
r={active ? 9 : 5.5}
fill={active ? color : t.grid}
/>
);
})}
</g>
);
})}
</svg>
</div>
</div>
</div>
);
}
Runnable source as JSON, for any HTTP client: https://api.anyplot.ai/specs/upset-basic/muix/code. Any spec id and library id listed in llms-full.txt fit the same URL shape; every URL below is complete and callable.
{
  "spec_id": "upset-basic",
  "language": "javascript",
  "library": "muix",
  "page": "https://anyplot.ai/upset-basic/javascript/muix",
  "hub": "https://anyplot.ai/upset-basic",
  "code_json": "https://api.anyplot.ai/specs/upset-basic/muix/code",
  "spec_json": "https://api.anyplot.ai/specs/upset-basic",
  "render_light_png": "https://storage.googleapis.com/anyplot-images/plots/upset-basic/javascript/muix/plot-light.png",
  "render_dark_png": "https://storage.googleapis.com/anyplot-images/plots/upset-basic/javascript/muix/plot-dark.png",
  "interactive_light_html": "https://storage.googleapis.com/anyplot-images/plots/upset-basic/javascript/muix/plot-light.html",
  "interactive_dark_html": "https://storage.googleapis.com/anyplot-images/plots/upset-basic/javascript/muix/plot-dark.html",
  "quality_score": 82.0,
  "license": "MIT",
  "guide": "https://anyplot.ai/llms.txt"
}
Part of UpSet Plot for Multi-Set Intersection Analysis on anyplot.ai.