The same plot in 14 other libraries — Python: Altair, lets-plot, Matplotlib, Plotly, plotnine, Pygal, Seaborn; R: ggplot2; Julia: Makie.jl; JavaScript: Chart.js, D3.js, Apache ECharts, Highcharts, MUI X Charts. Compare all 15 side by side: UpSet Plot for Multi-Set Intersection Analysis in Python, R, Julia and JavaScript.
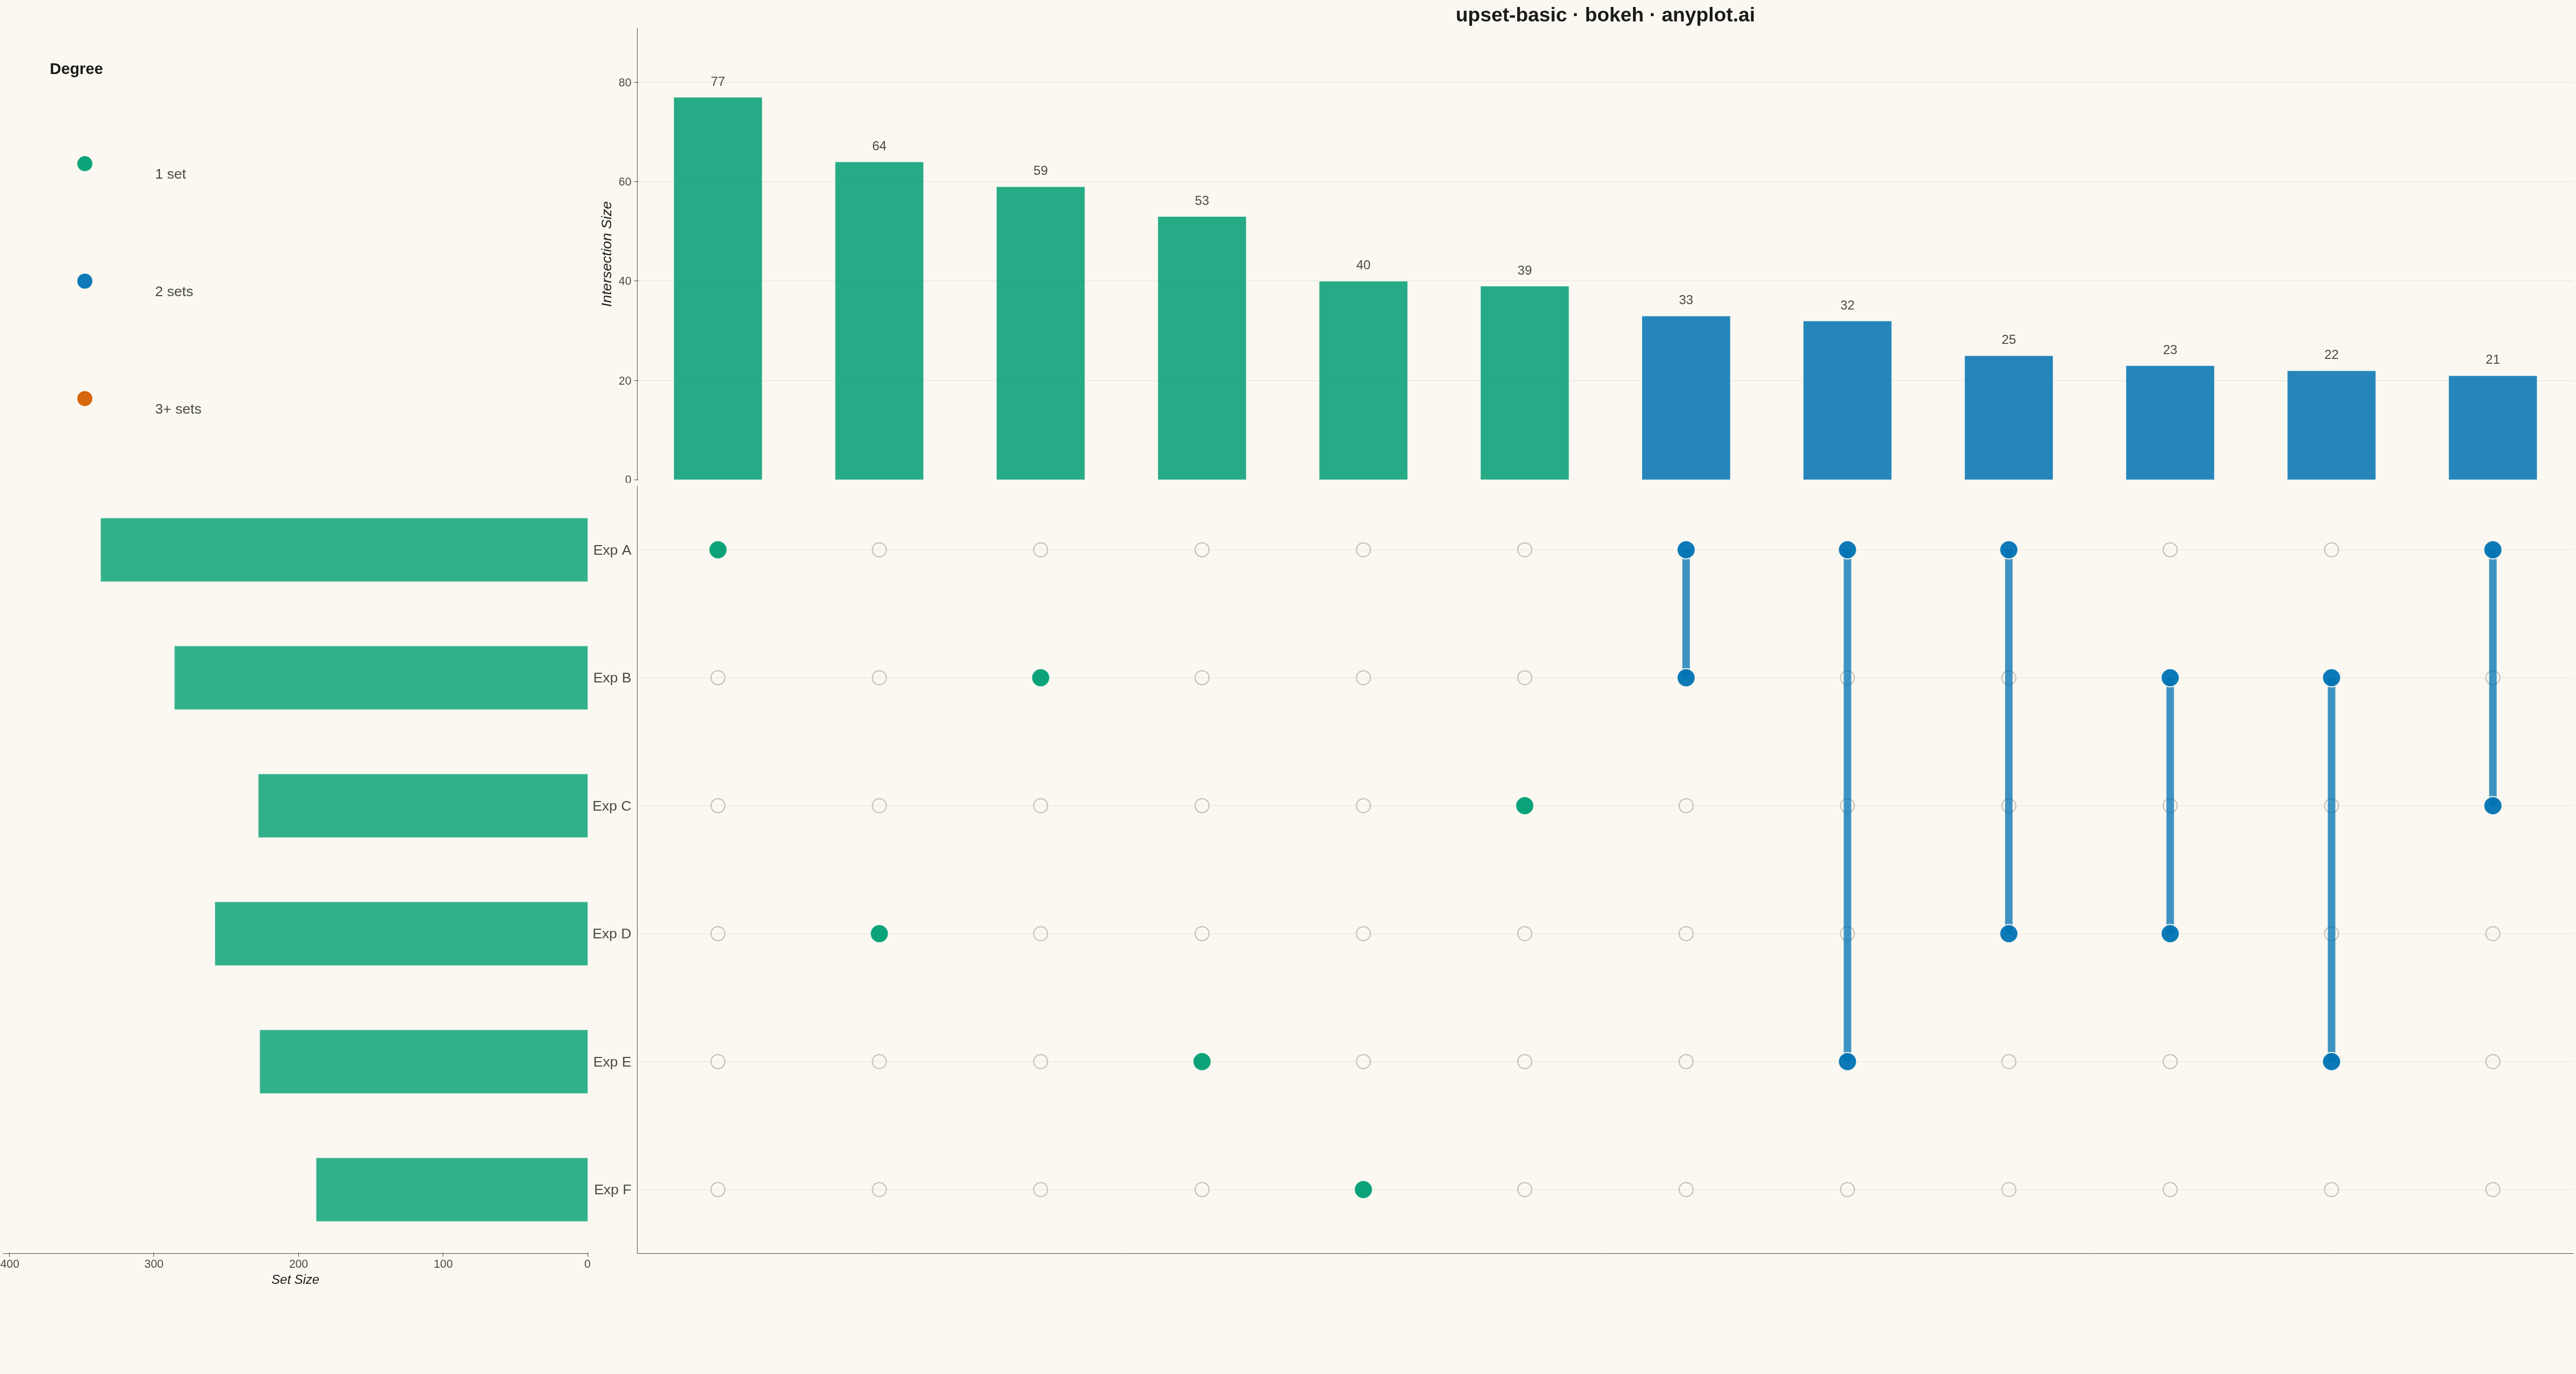
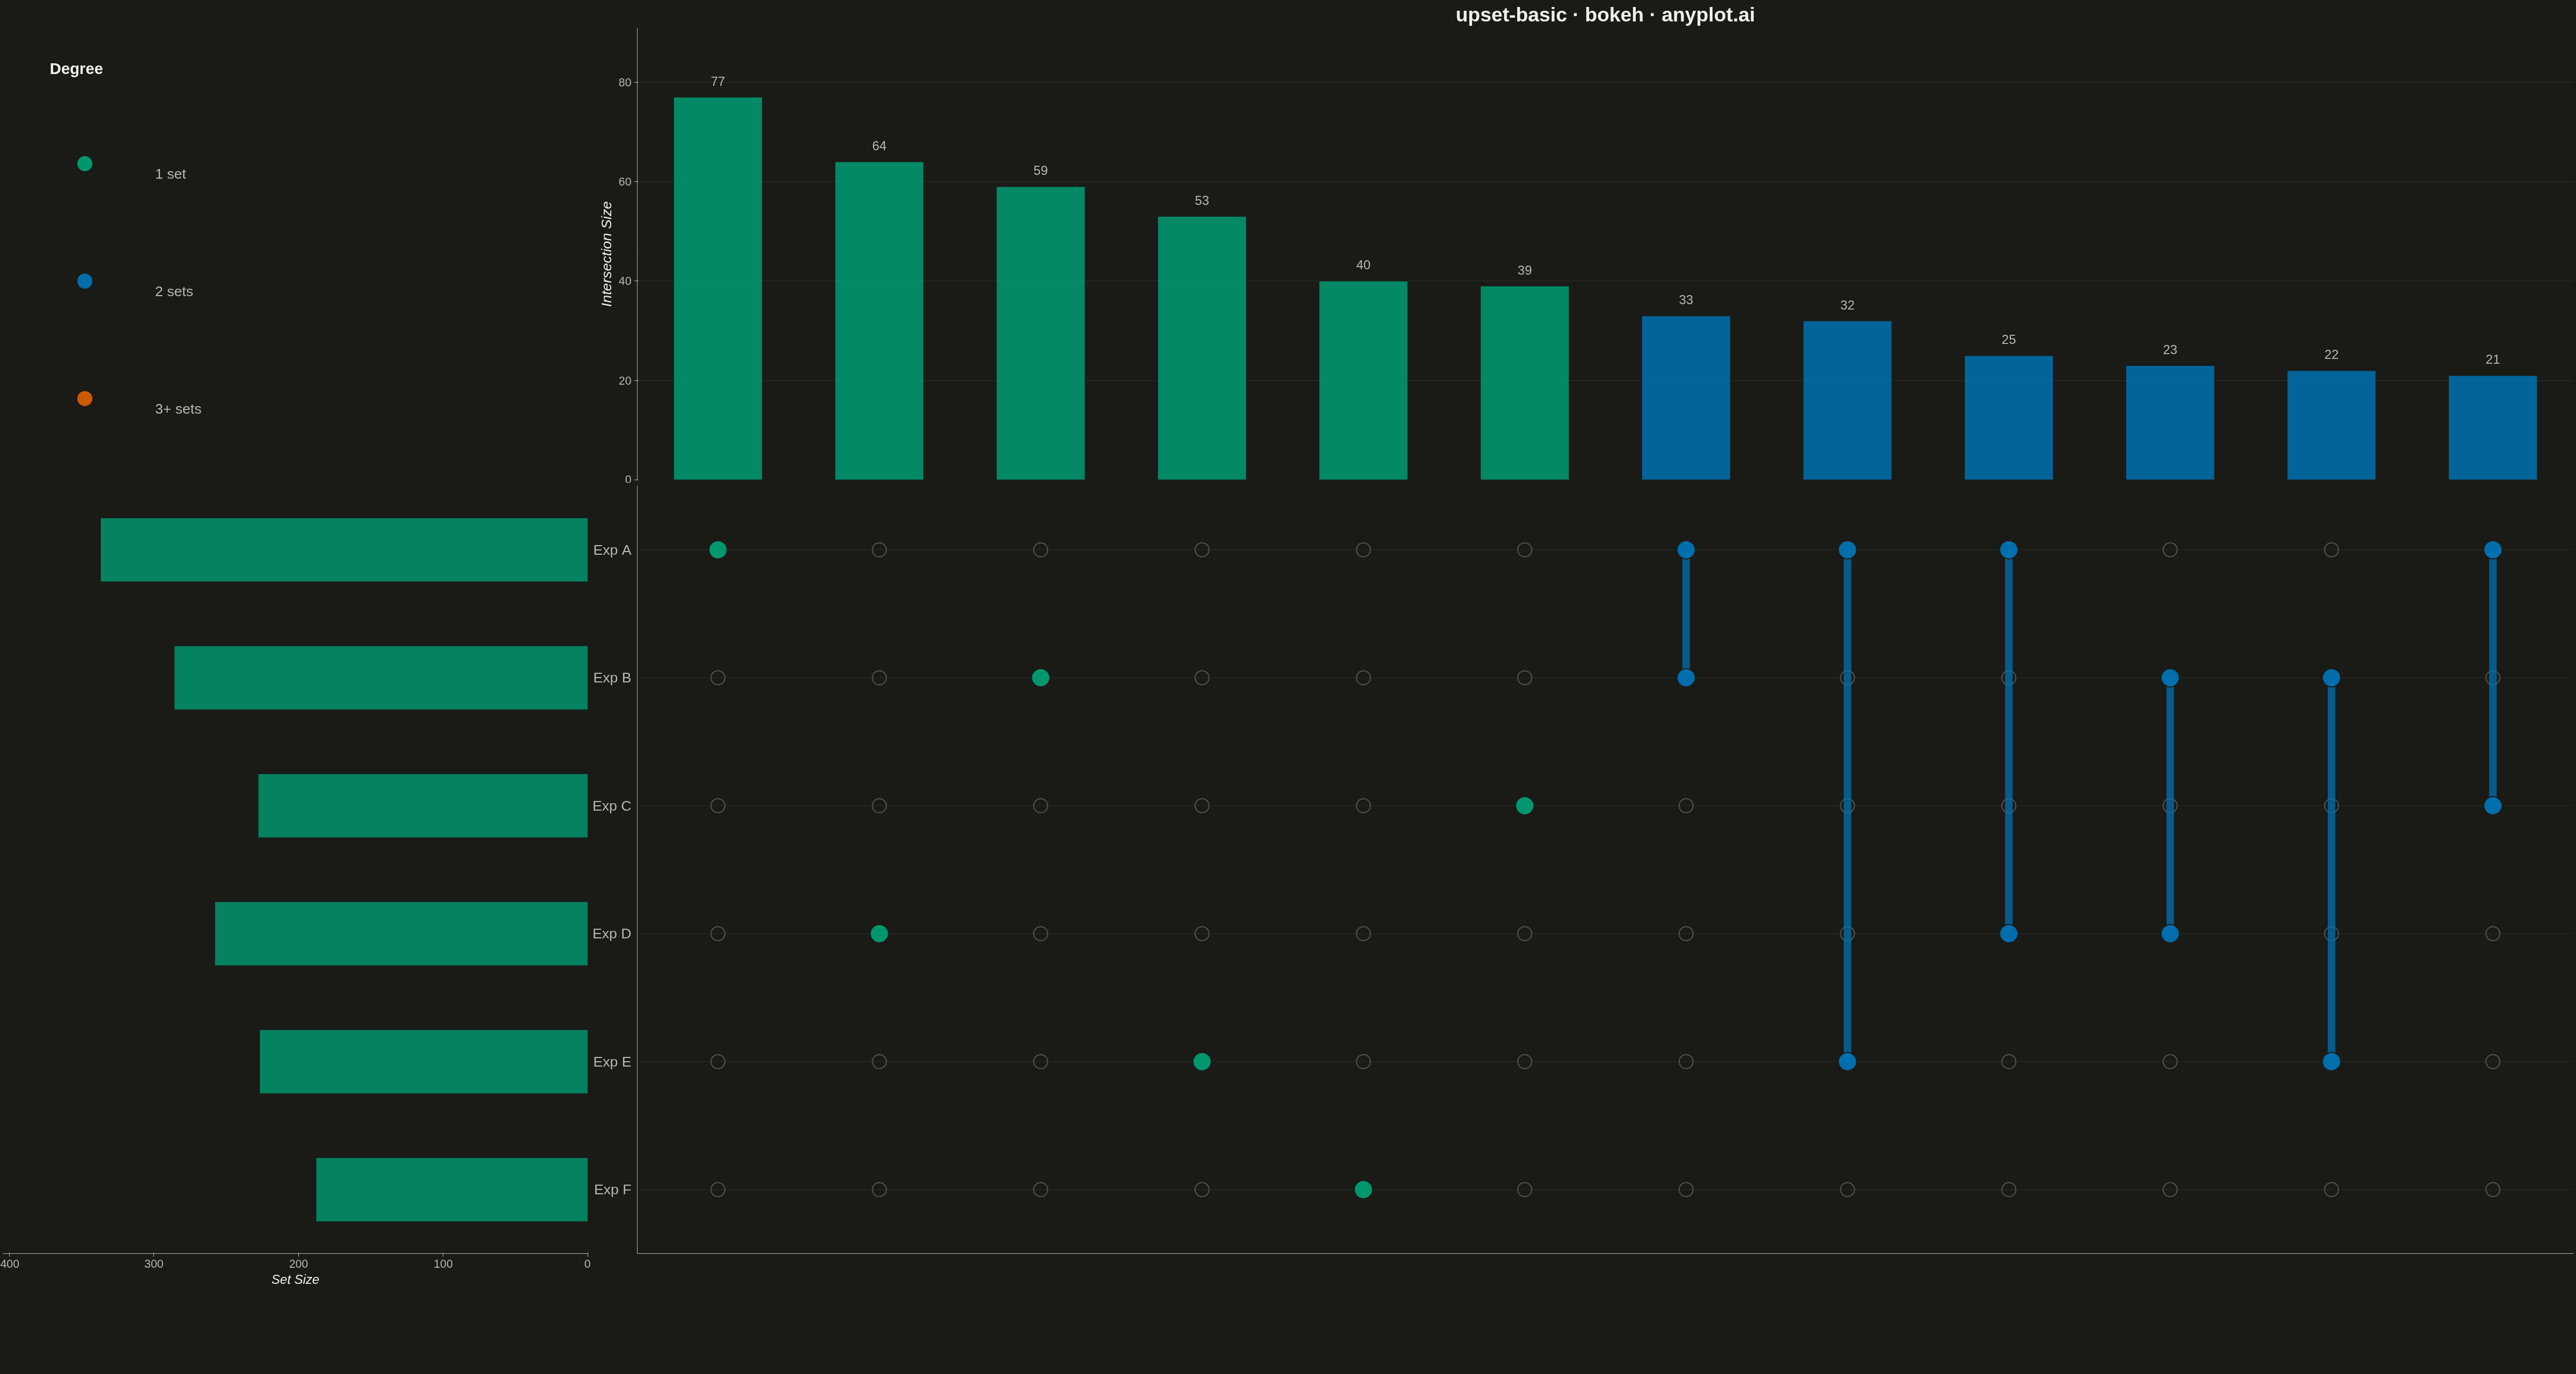
An UpSet plot visualizes intersections of multiple sets using a matrix-based layout that scales far better than Venn diagrams beyond 3 sets. A horizontal bar chart shows individual set sizes, a dot-matrix indicates which sets participate in each intersection, and a vertical bar chart above shows the intersection cardinality. This is the modern standard for set intersection analysis, making complex overlaps between many sets immediately readable.
""" anyplot.ai
upset-basic: UpSet Plot for Multi-Set Intersection Analysis
Library: bokeh 3.9.0 | Python 3.13.13
Quality: 86/100 | Created: 2026-05-13
"""

import os
import time
from pathlib import Path

import numpy as np
from bokeh.io import output_file, save
from bokeh.layouts import gridplot
from bokeh.models import FixedTicker, Range1d
from bokeh.plotting import figure
from selenium import webdriver
from selenium.webdriver.chrome.options import Options


# Theme tokens
THEME = os.getenv("ANYPLOT_THEME", "light")
PAGE_BG = "#FAF8F1" if THEME == "light" else "#1A1A17"
INK = "#1A1A17" if THEME == "light" else "#F0EFE8"
INK_SOFT = "#4A4A44" if THEME == "light" else "#B8B7B0"
INK_MUTED = "#6B6A63" if THEME == "light" else "#A8A79F"
BRAND = "#009E73"

# Data: genes from 6 genomic differential expression experiments
np.random.seed(42)
n_genes = 800
set_names = ["Exp A", "Exp B", "Exp C", "Exp D", "Exp E", "Exp F"]
n_sets = len(set_names)

membership_probs = [0.38, 0.33, 0.27, 0.30, 0.24, 0.21]
membership = np.zeros((n_genes, n_sets), dtype=bool)
for j, prob in enumerate(membership_probs):
    membership[:, j] = np.random.rand(n_genes) < prob
for i in range(n_genes):
    if not membership[i].any():
        membership[i, np.random.randint(n_sets)] = True

set_sizes = membership.sum(axis=0)

# Compute intersection signatures and counts
sig_counts = {}
for i in range(n_genes):
    sig = frozenset(int(j) for j in np.where(membership[i])[0])
    sig_counts[sig] = sig_counts.get(sig, 0) + 1

intersections = sorted(sig_counts.items(), key=lambda x: -x[1])[:12]
n_inter = len(intersections)
inter_counts = [count for _, count in intersections]
max_count = max(inter_counts)

# y positions: Exp A at top (y=n_sets-1), Exp F at bottom (y=0)
set_y = {name: n_sets - 1 - i for i, name in enumerate(set_names)}

# Shared axis ranges for panel alignment
x_range = Range1d(-0.5, n_inter - 0.5)
y_range = Range1d(-0.5, n_sets - 0.5)

W_SETS, W_MATRIX = 1100, 3700
H_BAR, H_MATRIX = 900, 1500

# === DOT MATRIX (bottom right) ===
p_matrix = figure(width=W_MATRIX, height=H_MATRIX, x_range=x_range, y_range=y_range, toolbar_location=None)
p_matrix.background_fill_color = PAGE_BG
p_matrix.border_fill_color = PAGE_BG
p_matrix.outline_line_color = None

# Inactive (hollow) dots
inactive_x, inactive_y = [], []
for col_idx, (sig, _) in enumerate(intersections):
    for set_idx in range(n_sets):
        if set_idx not in sig:
            inactive_x.append(col_idx)
            inactive_y.append(set_y[set_names[set_idx]])

p_matrix.scatter(
    x=inactive_x,
    y=inactive_y,
    size=26,
    marker="circle",
    fill_alpha=0,
    line_color=INK_MUTED,
    line_alpha=0.40,
    line_width=2,
)

# Connecting lines between active sets in each column
seg_x0, seg_x1, seg_y0, seg_y1 = [], [], [], []
for col_idx, (sig, _) in enumerate(intersections):
    if len(sig) > 1:
        ys = sorted(set_y[set_names[j]] for j in sig)
        seg_x0.append(col_idx)
        seg_x1.append(col_idx)
        seg_y0.append(ys[0])
        seg_y1.append(ys[-1])

p_matrix.segment(x0=seg_x0, x1=seg_x1, y0=seg_y0, y1=seg_y1, line_color=BRAND, line_width=14, alpha=0.75)

# Active (filled) dots on top
active_x, active_y = [], []
for col_idx, (sig, _) in enumerate(intersections):
    for set_idx in sig:
        active_x.append(col_idx)
        active_y.append(set_y[set_names[set_idx]])

p_matrix.scatter(
    x=active_x, y=active_y, size=34, marker="circle", fill_color=BRAND, line_color=PAGE_BG, line_width=2, alpha=0.95
)

y_ticks = list(range(n_sets))
p_matrix.yaxis.ticker = FixedTicker(ticks=y_ticks)
p_matrix.yaxis.major_label_overrides = {set_y[name]: name for name in set_names}
p_matrix.yaxis.major_label_text_font_size = "20pt"
p_matrix.yaxis.major_label_text_color = INK_SOFT
p_matrix.yaxis.axis_line_color = INK_SOFT
p_matrix.yaxis.major_tick_line_color = None
p_matrix.yaxis.minor_tick_line_color = None

p_matrix.xaxis.ticker = FixedTicker(ticks=list(range(n_inter)))
p_matrix.xaxis.major_label_text_font_size = "0pt"
p_matrix.xaxis.axis_line_color = INK_SOFT
p_matrix.xaxis.major_tick_line_color = None
p_matrix.xaxis.minor_tick_line_color = None

p_matrix.xgrid.grid_line_color = None
p_matrix.ygrid.ticker = FixedTicker(ticks=y_ticks)
p_matrix.ygrid.grid_line_color = INK
p_matrix.ygrid.grid_line_alpha = 0.08


# === INTERSECTION BAR CHART (top right) ===
p_bar = figure(
    width=W_MATRIX,
    height=H_BAR,
    x_range=x_range,
    y_range=Range1d(0, max_count * 1.18),
    toolbar_location=None,
    title="upset-basic · bokeh · anyplot.ai",
)
p_bar.background_fill_color = PAGE_BG
p_bar.border_fill_color = PAGE_BG
p_bar.outline_line_color = None

p_bar.vbar(
    x=list(range(n_inter)), top=inter_counts, width=0.55, color=BRAND, alpha=0.85, line_color=PAGE_BG, line_width=1.5
)

for xi, h in enumerate(inter_counts):
    p_bar.text(
        x=[xi],
        y=[h + max_count * 0.03],
        text=[str(h)],
        text_align="center",
        text_baseline="bottom",
        text_font_size="17pt",
        text_color=INK_SOFT,
    )

p_bar.title.text_font_size = "28pt"
p_bar.title.text_color = INK
p_bar.title.align = "center"

p_bar.yaxis.axis_label = "Intersection Size"
p_bar.yaxis.axis_label_text_font_size = "20pt"
p_bar.yaxis.axis_label_text_color = INK
p_bar.yaxis.major_label_text_font_size = "16pt"
p_bar.yaxis.major_label_text_color = INK_SOFT
p_bar.yaxis.axis_line_color = INK_SOFT
p_bar.yaxis.major_tick_line_color = INK_SOFT
p_bar.yaxis.minor_tick_line_color = None

p_bar.xaxis.ticker = FixedTicker(ticks=list(range(n_inter)))
p_bar.xaxis.major_label_text_font_size = "0pt"
p_bar.xaxis.axis_line_color = None
p_bar.xaxis.major_tick_line_color = None
p_bar.xaxis.minor_tick_line_color = None

p_bar.xgrid.grid_line_color = None
p_bar.ygrid.grid_line_color = INK
p_bar.ygrid.grid_line_alpha = 0.10


# === SET SIZE BAR CHART (bottom left) ===
max_set_size = int(set_sizes.max())
p_sets = figure(
    width=W_SETS, height=H_MATRIX, x_range=Range1d(max_set_size * 1.20, 0), y_range=y_range, toolbar_location=None
)
p_sets.background_fill_color = PAGE_BG
p_sets.border_fill_color = PAGE_BG
p_sets.outline_line_color = None

p_sets.hbar(
    y=[set_y[name] for name in set_names],
    right=list(set_sizes),
    height=0.5,
    color=BRAND,
    alpha=0.80,
    line_color=PAGE_BG,
    line_width=1.5,
)

p_sets.xaxis.axis_label = "Set Size"
p_sets.xaxis.axis_label_text_font_size = "18pt"
p_sets.xaxis.axis_label_text_color = INK
p_sets.xaxis.major_label_text_font_size = "16pt"
p_sets.xaxis.major_label_text_color = INK_SOFT
p_sets.xaxis.axis_line_color = INK_SOFT
p_sets.xaxis.major_tick_line_color = INK_SOFT
p_sets.xaxis.minor_tick_line_color = None

p_sets.yaxis.visible = False
p_sets.xgrid.grid_line_color = None
p_sets.ygrid.grid_line_color = None


# === CORNER SPACER (top left) ===
p_corner = figure(width=W_SETS, height=H_BAR, x_range=Range1d(0, 1), y_range=Range1d(0, 1), toolbar_location=None)
p_corner.background_fill_color = PAGE_BG
p_corner.border_fill_color = PAGE_BG
p_corner.outline_line_color = None
p_corner.xaxis.visible = False
p_corner.yaxis.visible = False
p_corner.xgrid.grid_line_color = None
p_corner.ygrid.grid_line_color = None
p_corner.rect(x=[0.5], y=[0.5], width=[0], height=[0], fill_alpha=0, line_alpha=0)


# === Grid Layout ===
grid = gridplot([[p_corner, p_bar], [p_sets, p_matrix]], merge_tools=False, toolbar_location=None)

output_file(f"plot-{THEME}.html")
save(grid)

# Screenshot with headless Chrome via Selenium
W, H = 4800, 2700
opts = Options()
for arg in (
    "--headless=new",
    "--no-sandbox",
    "--disable-dev-shm-usage",
    "--disable-gpu",
    f"--window-size={W},{H}",
    "--hide-scrollbars",
):
    opts.add_argument(arg)
driver = webdriver.Chrome(options=opts)
driver.set_window_size(W, H)
driver.get(f"file://{Path(f'plot-{THEME}.html').resolve()}")
time.sleep(3)
driver.save_screenshot(f"plot-{THEME}.png")
driver.quit()
Runnable source as JSON, for any HTTP client: https://api.anyplot.ai/specs/upset-basic/bokeh/code. Any spec id and library id listed in llms-full.txt fit the same URL shape; every URL below is complete and callable.
{
  "spec_id": "upset-basic",
  "language": "python",
  "library": "bokeh",
  "page": "https://anyplot.ai/upset-basic/python/bokeh",
  "hub": "https://anyplot.ai/upset-basic",
  "code_json": "https://api.anyplot.ai/specs/upset-basic/bokeh/code",
  "spec_json": "https://api.anyplot.ai/specs/upset-basic",
  "render_light_png": "https://storage.googleapis.com/anyplot-images/plots/upset-basic/python/bokeh/plot-light.png",
  "render_dark_png": "https://storage.googleapis.com/anyplot-images/plots/upset-basic/python/bokeh/plot-dark.png",
  "interactive_light_html": "https://storage.googleapis.com/anyplot-images/plots/upset-basic/python/bokeh/plot-light.html",
  "interactive_dark_html": "https://storage.googleapis.com/anyplot-images/plots/upset-basic/python/bokeh/plot-dark.html",
  "quality_score": 86.0,
  "license": "MIT",
  "guide": "https://anyplot.ai/llms.txt"
}
Part of UpSet Plot for Multi-Set Intersection Analysis on anyplot.ai.