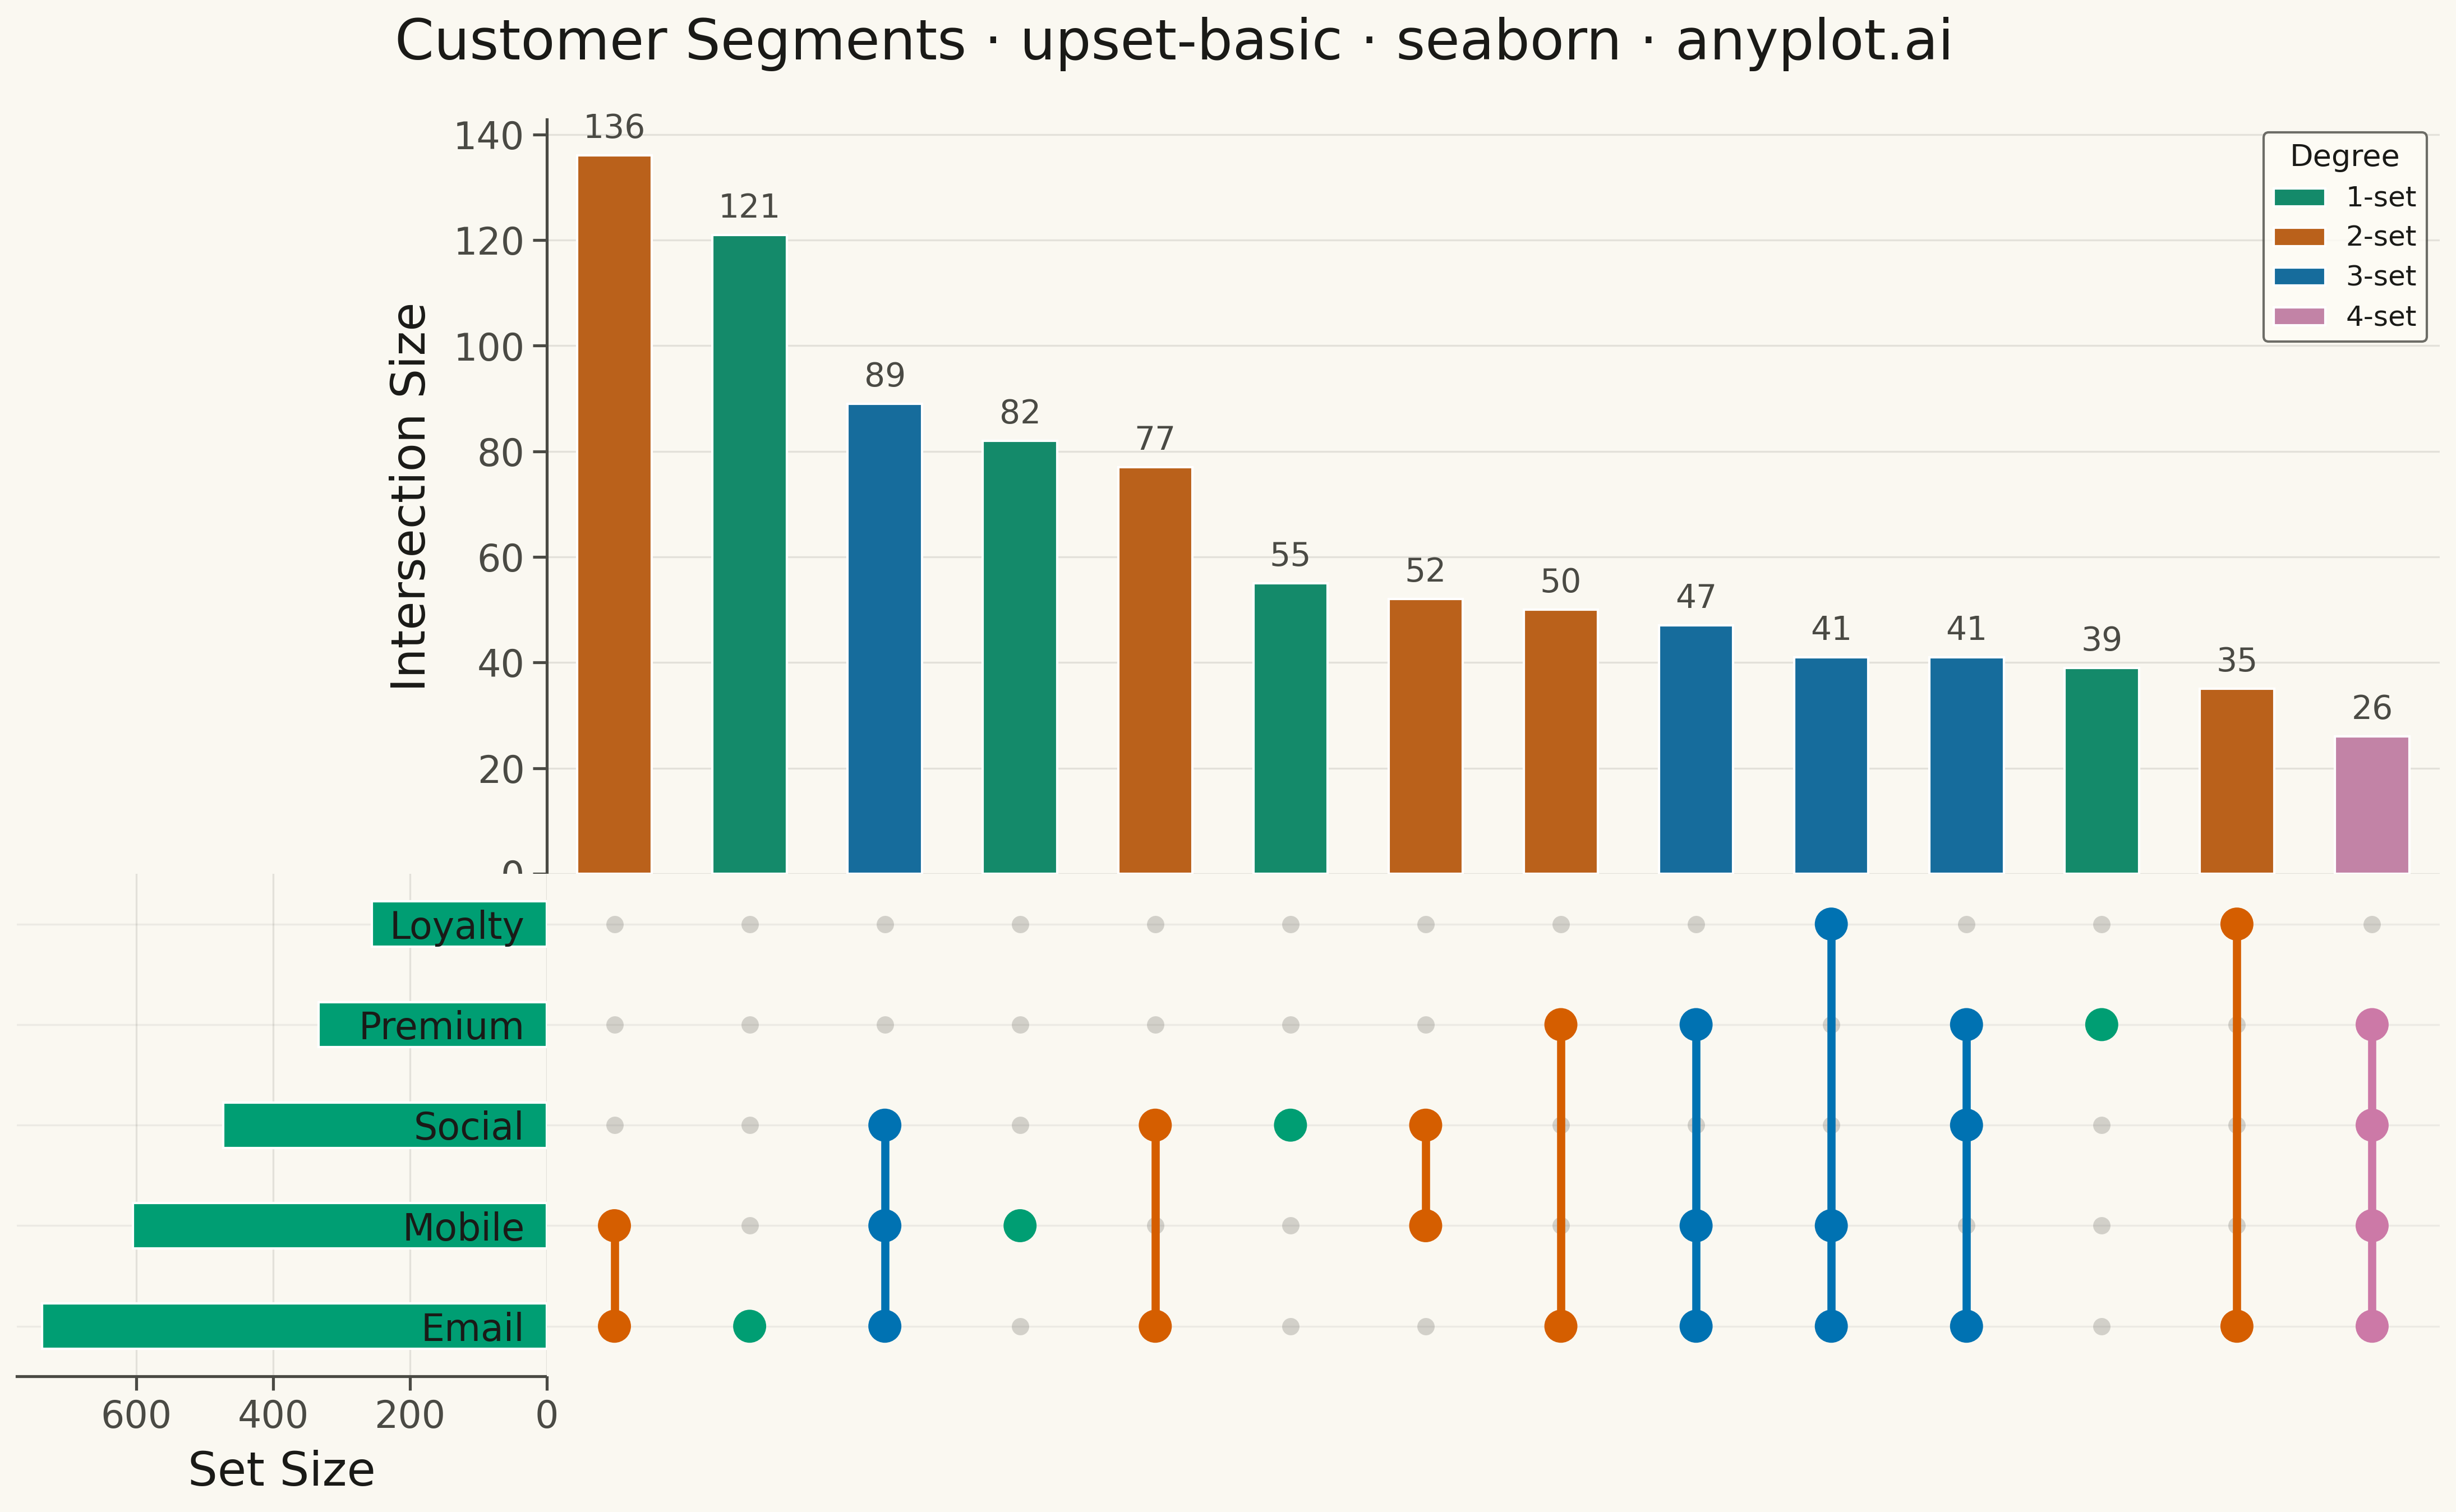
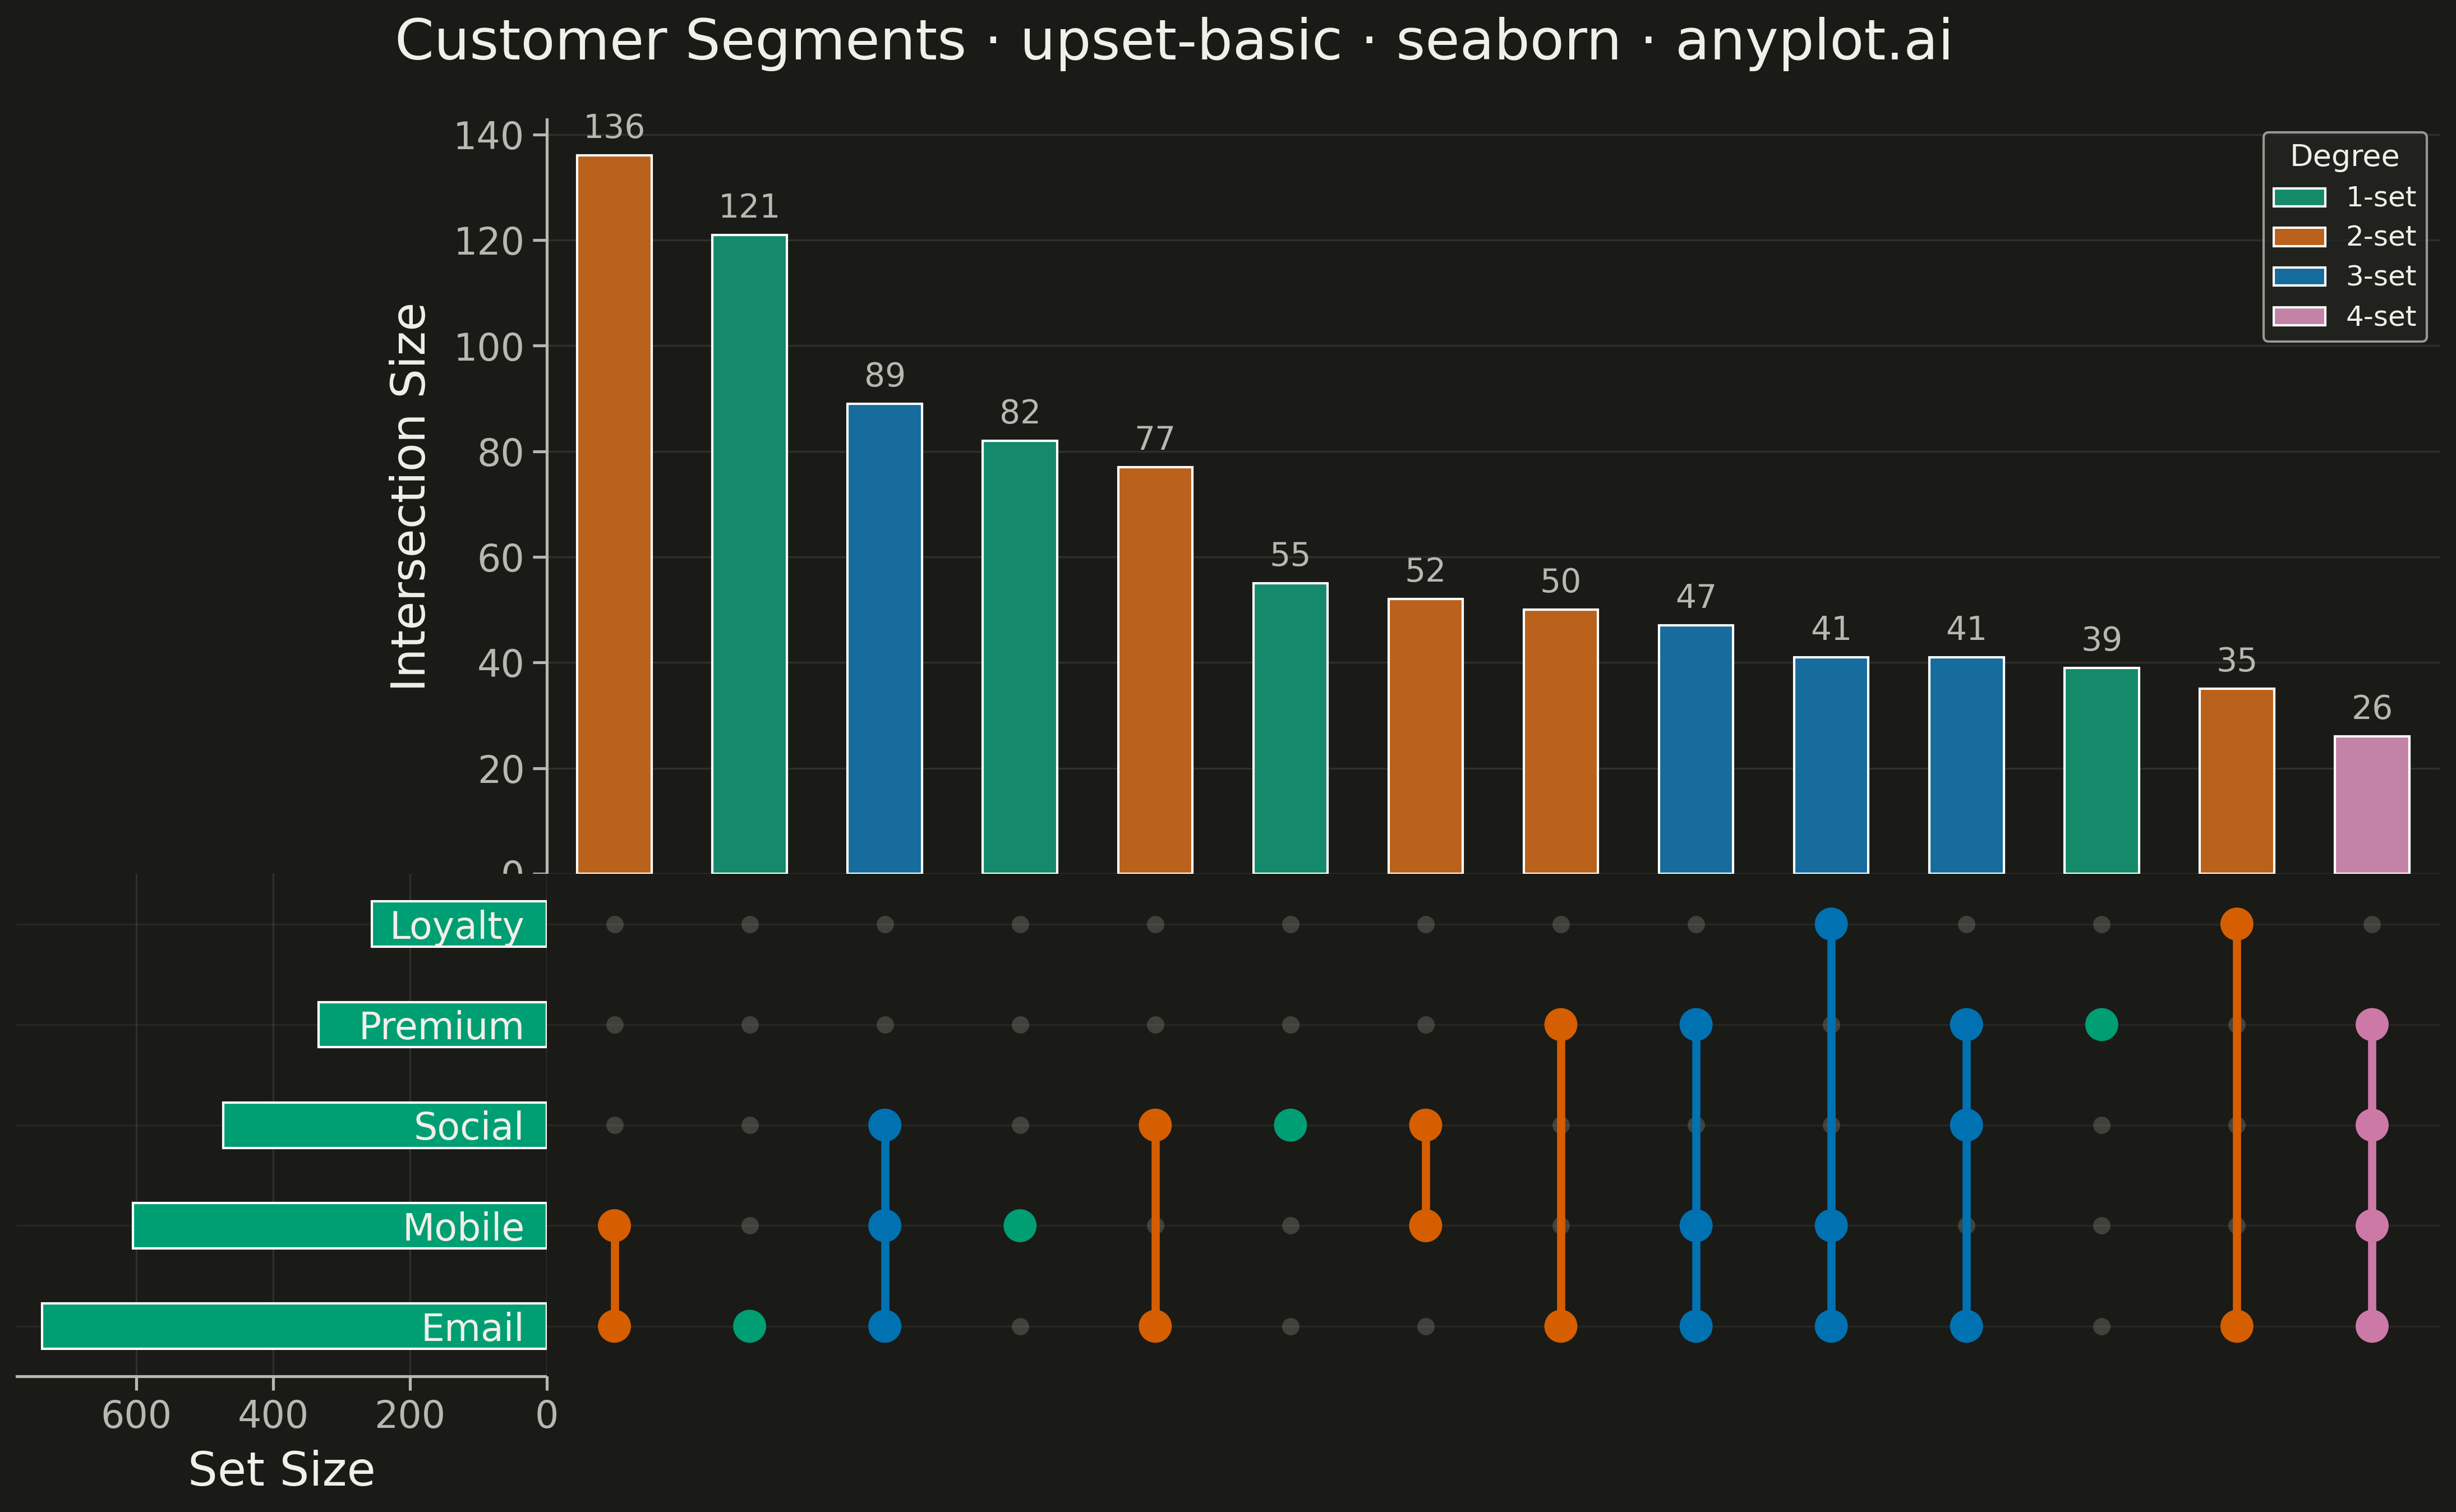
The same plot in 14 other libraries — Python: Altair, Bokeh, lets-plot, Matplotlib, Plotly, plotnine, Pygal; R: ggplot2; Julia: Makie.jl; JavaScript: Chart.js, D3.js, Apache ECharts, Highcharts, MUI X Charts. Compare all 15 side by side: UpSet Plot for Multi-Set Intersection Analysis in Python, R, Julia and JavaScript.
An UpSet plot visualizes intersections of multiple sets using a matrix-based layout that scales far better than Venn diagrams beyond 3 sets. A horizontal bar chart shows individual set sizes, a dot-matrix indicates which sets participate in each intersection, and a vertical bar chart above shows the intersection cardinality. This is the modern standard for set intersection analysis, making complex overlaps between many sets immediately readable.
""" anyplot.ai
upset-basic: UpSet Plot for Multi-Set Intersection Analysis
Library: seaborn 0.13.2 | Python 3.13.13
Quality: 82/100 | Created: 2026-05-13
"""

import os
from collections import Counter

import matplotlib.pyplot as plt
import numpy as np
import seaborn as sns


# Theme tokens
THEME = os.getenv("ANYPLOT_THEME", "light")
PAGE_BG = "#FAF8F1" if THEME == "light" else "#1A1A17"
ELEVATED_BG = "#FFFDF6" if THEME == "light" else "#242420"
INK = "#1A1A17" if THEME == "light" else "#F0EFE8"
INK_SOFT = "#4A4A44" if THEME == "light" else "#B8B7B0"
INK_MUTED = "#6B6A63" if THEME == "light" else "#A8A79F"
BRAND = "#009E73"

sns.set_theme(
    style="ticks",
    rc={
        "figure.facecolor": PAGE_BG,
        "axes.facecolor": PAGE_BG,
        "axes.edgecolor": INK_SOFT,
        "axes.labelcolor": INK,
        "text.color": INK,
        "xtick.color": INK_SOFT,
        "ytick.color": INK_SOFT,
        "grid.color": INK,
        "grid.alpha": 0.10,
        "legend.facecolor": ELEVATED_BG,
        "legend.edgecolor": INK_SOFT,
    },
)

# Data: customer segments across marketing channels
np.random.seed(42)
n_customers = 1200
channel_names = ["Email", "Mobile", "Social", "Premium", "Loyalty"]
channel_probs = [0.62, 0.51, 0.39, 0.27, 0.21]

membership = np.column_stack([np.random.random(n_customers) < p for p in channel_probs])
membership = membership[membership.any(axis=1)]
n_sets = len(channel_names)

intersection_counts = Counter(tuple(row) for row in membership)
sorted_ints = sorted(intersection_counts.items(), key=lambda x: -x[1])
top_n = min(14, len(sorted_ints))
top_keys = [k for k, _ in sorted_ints[:top_n]]
top_counts = [v for _, v in sorted_ints[:top_n]]
n_ints = len(top_keys)
set_sizes = membership.sum(axis=0)

# Figure layout
fig = plt.figure(figsize=(16, 9), facecolor=PAGE_BG)
gs = fig.add_gridspec(
    2,
    2,
    width_ratios=[1.4, 5],
    height_ratios=[3, 2],
    hspace=0.0,
    wspace=0.0,
    left=0.07,
    right=0.97,
    top=0.88,
    bottom=0.05,
)

ax_corner = fig.add_subplot(gs[0, 0])
ax_intbar = fig.add_subplot(gs[0, 1])
ax_setbar = fig.add_subplot(gs[1, 0])
ax_matrix = fig.add_subplot(gs[1, 1])

x_cols = np.arange(n_ints)
y_rows = np.arange(n_sets)

# Intersection bar chart (top right)
ax_intbar.set_facecolor(PAGE_BG)
ax_intbar.set_axisbelow(True)
ax_intbar.yaxis.grid(True, alpha=0.10, linewidth=0.8, color=INK)
ax_intbar.bar(x_cols, top_counts, color=BRAND, width=0.55, zorder=2)
for i, cnt in enumerate(top_counts):
    ax_intbar.text(i, cnt + max(top_counts) * 0.015, str(cnt), ha="center", va="bottom", fontsize=10, color=INK_SOFT)
ax_intbar.set_xlim(-0.5, n_ints - 0.5)
ax_intbar.set_ylabel("Intersection Size", fontsize=17, color=INK, labelpad=8)
ax_intbar.tick_params(axis="y", labelsize=13, colors=INK_SOFT)
ax_intbar.tick_params(axis="x", bottom=False, labelbottom=False)
ax_intbar.spines["top"].set_visible(False)
ax_intbar.spines["right"].set_visible(False)
ax_intbar.spines["bottom"].set_visible(False)
ax_intbar.spines["left"].set_color(INK_SOFT)

# Dot matrix (bottom right)
ax_matrix.set_facecolor(PAGE_BG)
for row_idx in range(n_sets):
    ax_matrix.axhline(row_idx, color=INK, alpha=0.06, linewidth=0.8, zorder=1)
for col_idx, key in enumerate(top_keys):
    active_rows = [r for r, active in enumerate(key) if active]
    for row_idx, is_active in enumerate(key):
        if is_active:
            ax_matrix.scatter(col_idx, row_idx, s=200, color=BRAND, zorder=4, linewidths=0)
        else:
            ax_matrix.scatter(col_idx, row_idx, s=55, color=INK_MUTED, alpha=0.28, zorder=3, linewidths=0)
    if len(active_rows) > 1:
        ax_matrix.plot(
            [col_idx, col_idx],
            [min(active_rows), max(active_rows)],
            color=BRAND,
            linewidth=3.5,
            zorder=3,
            solid_capstyle="round",
        )
ax_matrix.set_xlim(-0.5, n_ints - 0.5)
ax_matrix.set_ylim(-0.5, n_sets - 0.5)
ax_matrix.set_yticks(y_rows)
ax_matrix.set_yticklabels(channel_names, fontsize=14, color=INK)
ax_matrix.tick_params(axis="x", bottom=False, labelbottom=False)
ax_matrix.tick_params(axis="y", left=False)
for spine in ax_matrix.spines.values():
    spine.set_visible(False)

# Set size bars (bottom left, bars extend left toward margin)
ax_setbar.set_facecolor(PAGE_BG)
ax_setbar.set_axisbelow(True)
ax_setbar.xaxis.grid(True, alpha=0.10, linewidth=0.8, color=INK)
for row_idx in range(n_sets):
    ax_setbar.axhline(row_idx, color=INK, alpha=0.06, linewidth=0.8, zorder=1)
ax_setbar.barh(y_rows, set_sizes, color=BRAND, height=0.45, zorder=2)
ax_setbar.set_ylim(-0.5, n_sets - 0.5)
ax_setbar.invert_xaxis()
ax_setbar.set_xlabel("Set Size", fontsize=15, color=INK, labelpad=6)
ax_setbar.tick_params(axis="x", labelsize=12, colors=INK_SOFT)
ax_setbar.tick_params(axis="y", left=False, labelleft=False)
ax_setbar.spines["top"].set_visible(False)
ax_setbar.spines["left"].set_visible(False)
ax_setbar.spines["right"].set_visible(False)
ax_setbar.spines["bottom"].set_color(INK_SOFT)

# Empty corner
ax_corner.set_facecolor(PAGE_BG)
ax_corner.tick_params(left=False, bottom=False, labelleft=False, labelbottom=False)
for spine in ax_corner.spines.values():
    spine.set_visible(False)

# Title
fig.text(
    0.5,
    0.93,
    "Customer Segments · upset-basic · seaborn · anyplot.ai",
    ha="center",
    va="center",
    fontsize=21,
    fontweight="medium",
    color=INK,
)

# Save
plt.savefig(f"plot-{THEME}.png", dpi=300, bbox_inches="tight", facecolor=PAGE_BG)
Runnable source as JSON, for any HTTP client: https://api.anyplot.ai/specs/upset-basic/seaborn/code. Any spec id and library id listed in llms-full.txt fit the same URL shape; every URL below is complete and callable.
{
  "spec_id": "upset-basic",
  "language": "python",
  "library": "seaborn",
  "page": "https://anyplot.ai/upset-basic/python/seaborn",
  "hub": "https://anyplot.ai/upset-basic",
  "code_json": "https://api.anyplot.ai/specs/upset-basic/seaborn/code",
  "spec_json": "https://api.anyplot.ai/specs/upset-basic",
  "render_light_png": "https://storage.googleapis.com/anyplot-images/plots/upset-basic/python/seaborn/plot-light.png",
  "render_dark_png": "https://storage.googleapis.com/anyplot-images/plots/upset-basic/python/seaborn/plot-dark.png",
  "quality_score": 82.0,
  "license": "MIT",
  "guide": "https://anyplot.ai/llms.txt"
}
Part of UpSet Plot for Multi-Set Intersection Analysis on anyplot.ai.