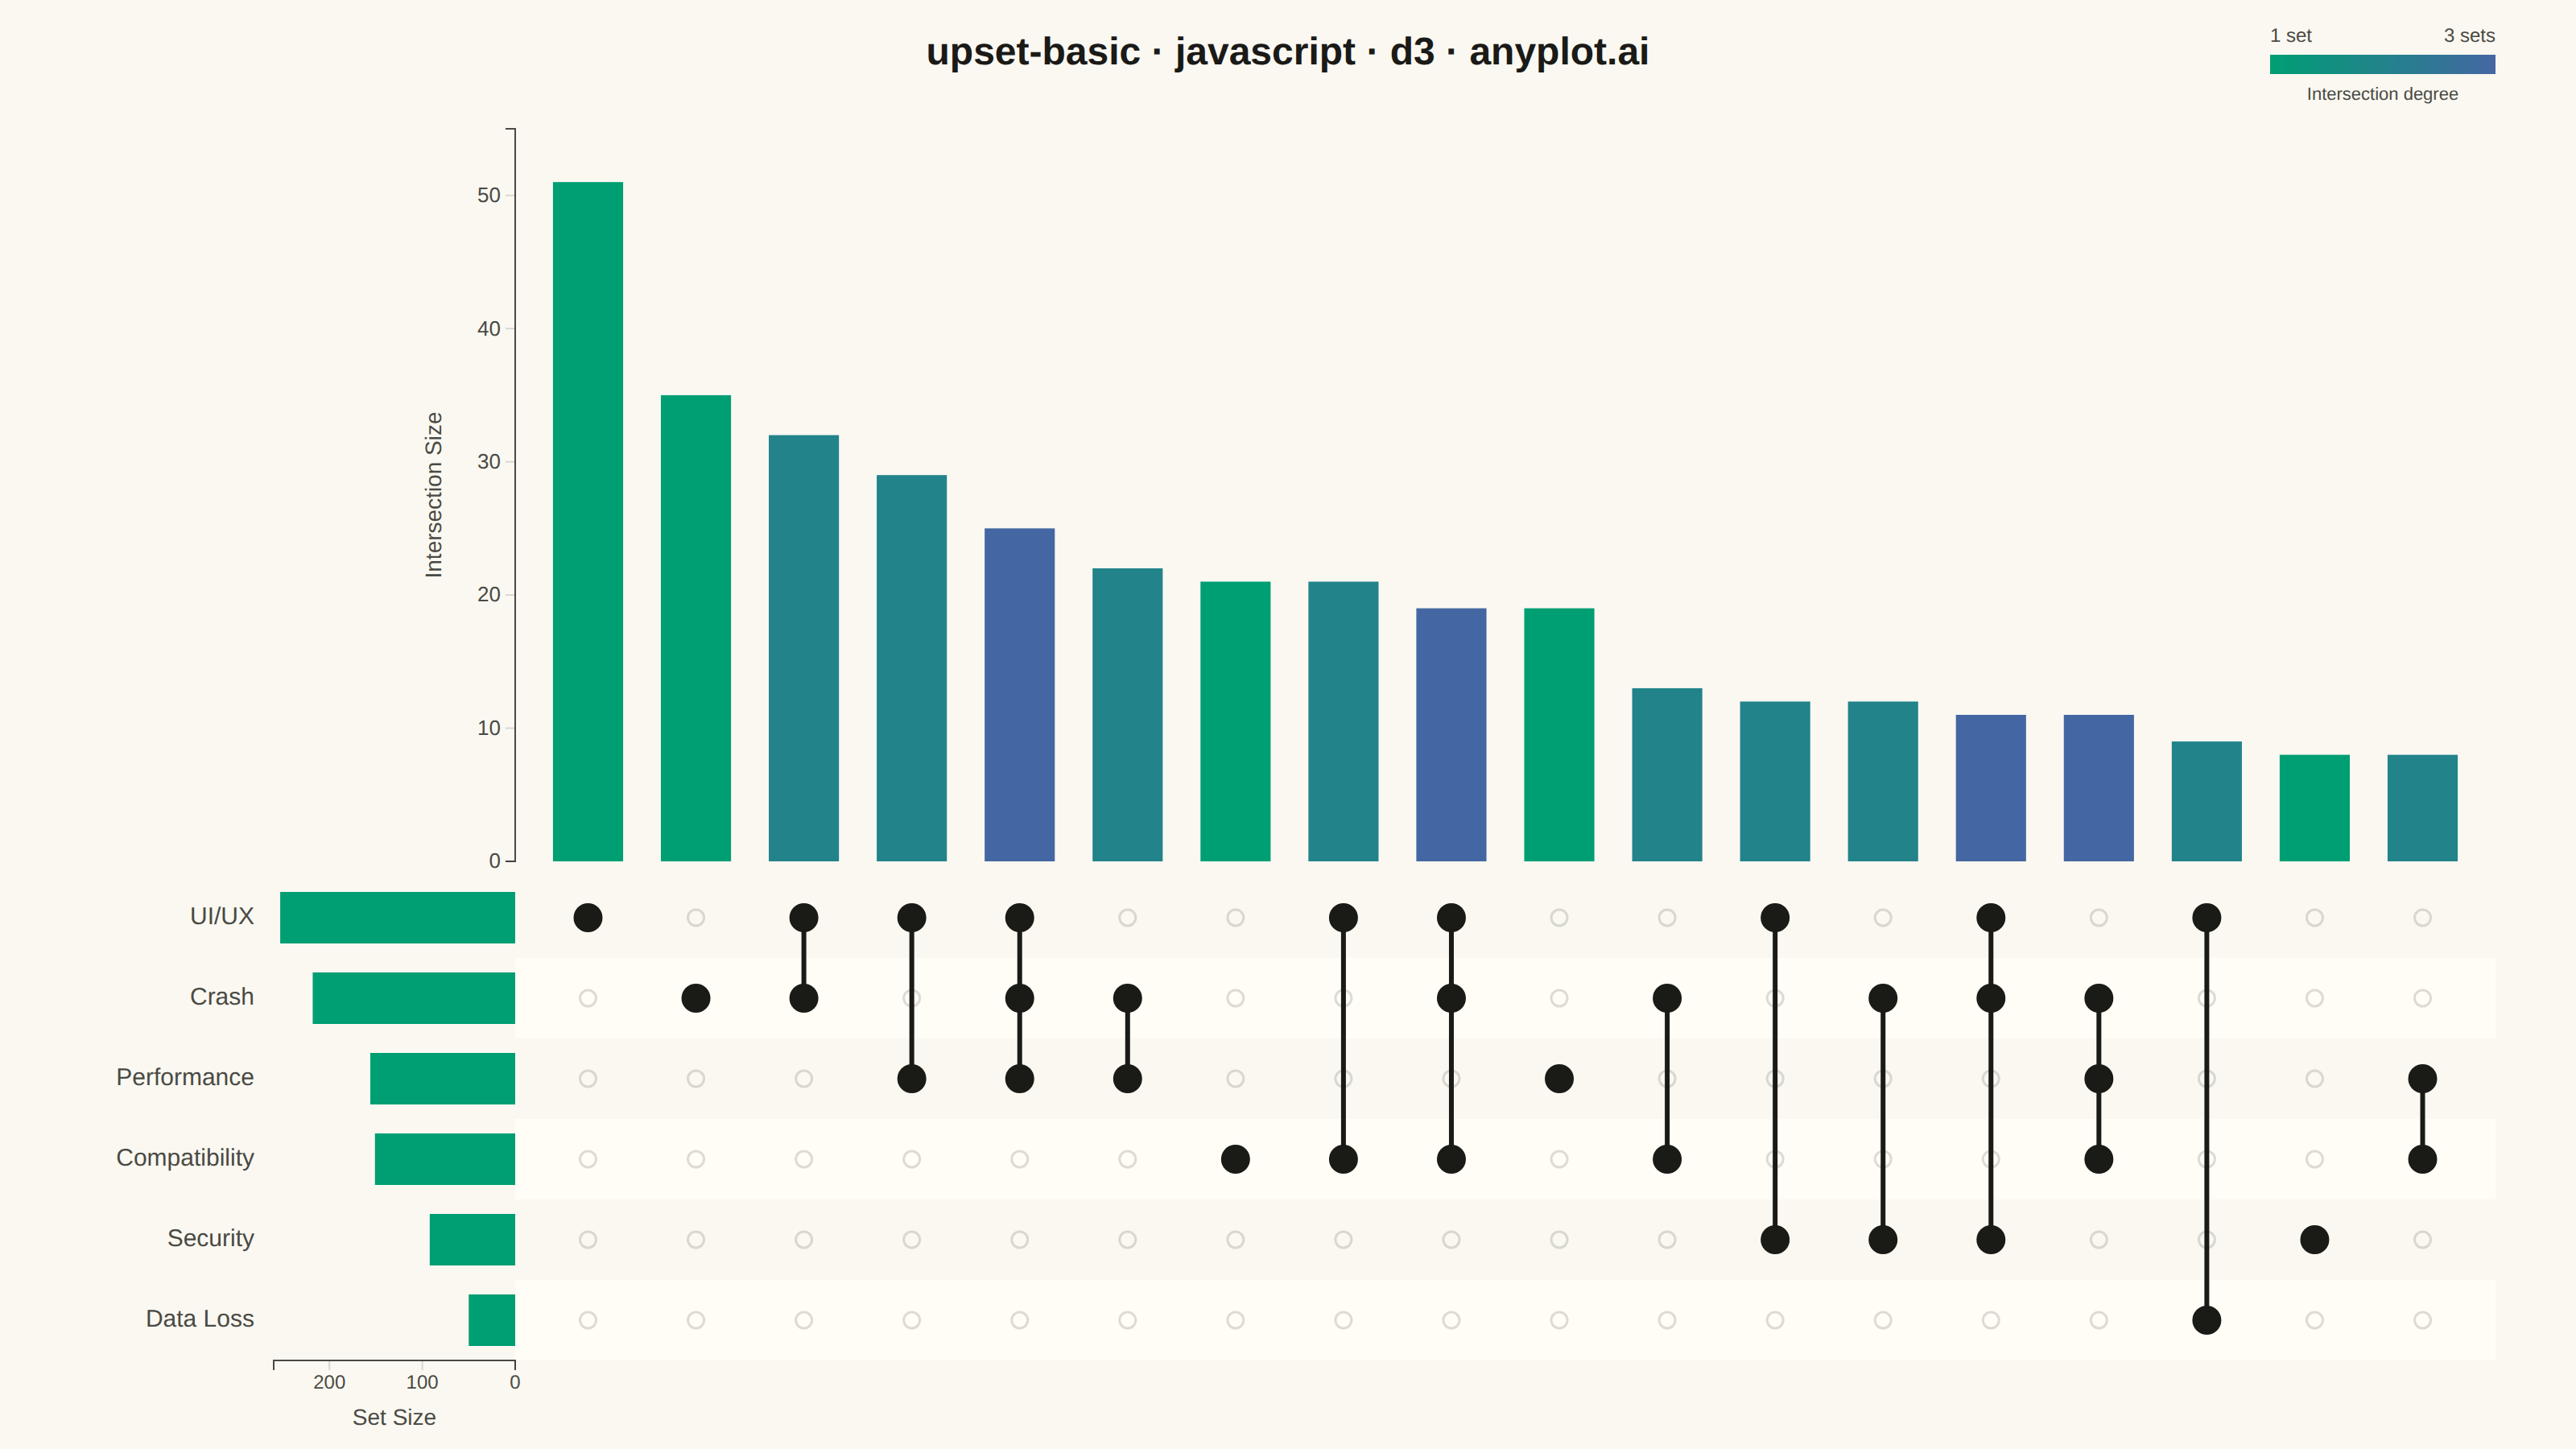
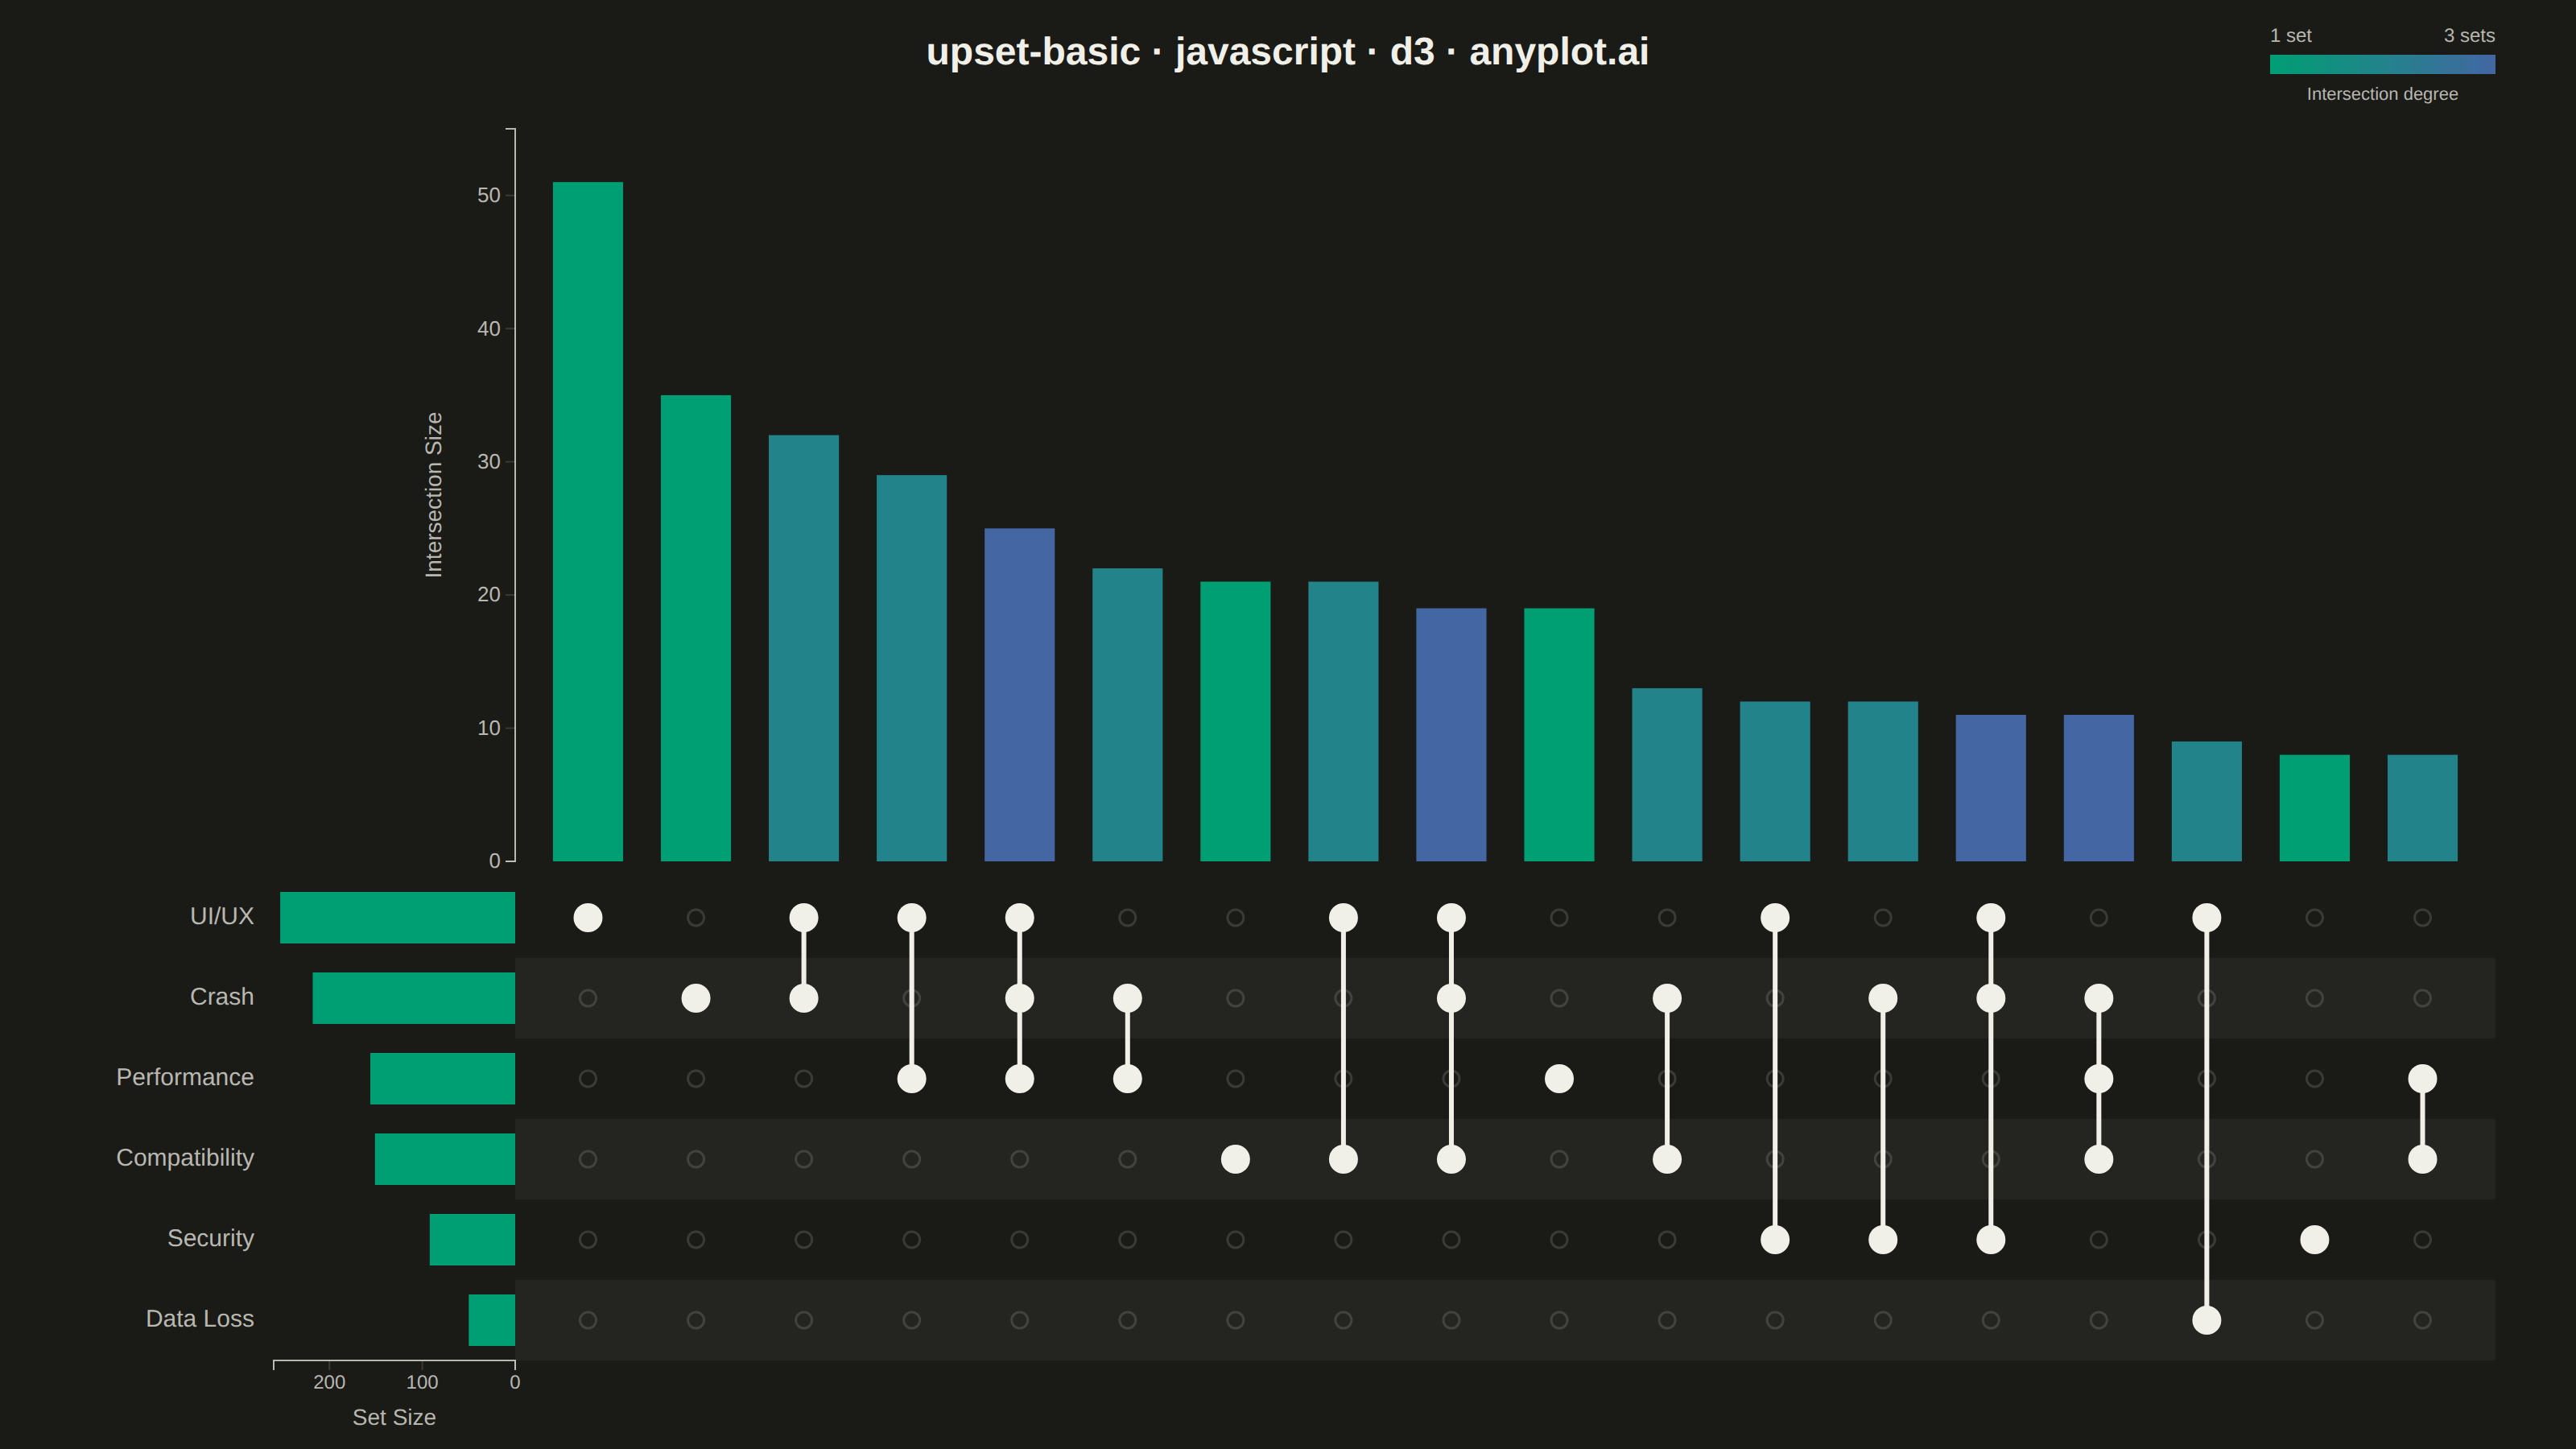
The same plot in 14 other libraries — JavaScript: Chart.js, Apache ECharts, Highcharts, MUI X Charts; Python: Altair, Bokeh, lets-plot, Matplotlib, Plotly, plotnine, Pygal, Seaborn; R: ggplot2; Julia: Makie.jl. Compare all 15 side by side: UpSet Plot for Multi-Set Intersection Analysis in Python, R, Julia and JavaScript.
An UpSet plot visualizes intersections of multiple sets using a matrix-based layout that scales far better than Venn diagrams beyond 3 sets. A horizontal bar chart shows individual set sizes, a dot-matrix indicates which sets participate in each intersection, and a vertical bar chart above shows the intersection cardinality. This is the modern standard for set intersection analysis, making complex overlaps between many sets immediately readable.
// anyplot.ai
// upset-basic: UpSet Plot for Multi-Set Intersection Analysis
// Library: d3 7.9.0 | JavaScript 22.23.2
// Quality: 91/100 | Created: 2026-09-09

const t = window.ANYPLOT_TOKENS;
const { width, height } = window.ANYPLOT_SIZE;

// --- Data (in-memory, deterministic LCG) ------------------------------------
function makeLcg(seed) {
  let state = seed >>> 0;
  return function () {
    state = (Math.imul(state, 1664525) + 1013904223) >>> 0;
    return state / 4294967296;
  };
}
const rand = makeLcg(42);

// Bug reports (elements) tagged by the module categories they touch (sets).
const SET_DEFS = [
  { name: "Crash", prob: 0.42 },
  { name: "UI/UX", prob: 0.5 },
  { name: "Performance", prob: 0.33 },
  { name: "Security", prob: 0.18 },
  { name: "Data Loss", prob: 0.12 },
  { name: "Compatibility", prob: 0.28 },
];

const nElements = 450;
const elements = [];
for (let i = 0; i < nElements; i++) {
  let membership;
  do {
    membership = SET_DEFS.filter((s) => rand() < s.prob).map((s) => s.name);
  } while (membership.length === 0);
  elements.push(membership);
}

// Rows ordered by set size, largest first (UpSet convention).
const setSizes = SET_DEFS.map((s) => ({
  name: s.name,
  size: elements.filter((m) => m.includes(s.name)).length,
})).sort((a, b) => b.size - a.size);
const rowNames = setSizes.map((s) => s.name);

// Aggregate elements into unique intersections, keep the largest MAX_COLUMNS.
const MAX_COLUMNS = 18;
const comboCounts = new Map();
elements.forEach((m) => {
  const key = rowNames.filter((name) => m.includes(name)).join("|");
  comboCounts.set(key, (comboCounts.get(key) || 0) + 1);
});
const intersections = Array.from(comboCounts, ([key, count]) => ({
  members: key.split("|"),
  count,
}))
  .sort((a, b) => b.count - a.count)
  .slice(0, MAX_COLUMNS);

// --- Layout -------------------------------------------------------------
const margin = { top: 80, right: 50, bottom: 55, left: 40 };
const labelWidth = 130;
const setBarWidth = 150;
const rowHeight = 50;
const gapTopMatrix = 10;

const matrixLeft = margin.left + labelWidth + setBarWidth;
const matrixWidth = width - margin.right - matrixLeft;
const matrixHeight = rowNames.length * rowHeight;
const topChartTop = margin.top;
const topChartHeight = height - margin.top - margin.bottom - matrixHeight - gapTopMatrix;
const topChartBottom = topChartTop + topChartHeight;
const matrixTop = topChartBottom + gapTopMatrix;
const matrixBottom = matrixTop + matrixHeight;

const rowIndex = new Map(rowNames.map((name, i) => [name, i]));
const rowCenter = (name) => matrixTop + rowIndex.get(name) * rowHeight + rowHeight / 2;

const xCol = d3
  .scaleBand()
  .domain(d3.range(intersections.length))
  .range([matrixLeft, matrixLeft + matrixWidth])
  .padding(0.35);

const maxCount = d3.max(intersections, (d) => d.count);
const yCount = d3.scaleLinear().domain([0, maxCount]).nice().range([topChartBottom, topChartTop]);

const maxSetSize = d3.max(setSizes, (d) => d.size);
const xSetBar = d3.scaleLinear().domain([0, maxSetSize]).nice().range([0, setBarWidth]);

const maxDegree = d3.max(intersections, (d) => d.members.length);
const degreeColor = d3.scaleSequential(d3.interpolateRgbBasis(t.seq)).domain([1, maxDegree]);

// --- SVG mount ----------------------------------------------------------
const svg = d3.select("#container").append("svg").attr("width", width).attr("height", height);

// Title
svg
  .append("text")
  .attr("x", width / 2)
  .attr("y", 40)
  .attr("text-anchor", "middle")
  .attr("fill", t.ink)
  .style("font-size", "24px")
  .style("font-weight", "600")
  .text("upset-basic · javascript · d3 · anyplot.ai");

// Degree color legend (top right)
const legendWidth = 140;
const legendHeight = 12;
const legendX = width - margin.right - legendWidth;
const legendY = 34;
const gradient = svg
  .append("defs")
  .append("linearGradient")
  .attr("id", "upset-degree-gradient")
  .attr("x1", "0%")
  .attr("x2", "100%")
  .attr("y1", "0%")
  .attr("y2", "0%");
d3.range(7).forEach((k) => {
  const deg = 1 + (k / 6) * (maxDegree - 1);
  gradient
    .append("stop")
    .attr("offset", `${(k / 6) * 100}%`)
    .attr("stop-color", degreeColor(deg));
});
svg
  .append("rect")
  .attr("x", legendX)
  .attr("y", legendY)
  .attr("width", legendWidth)
  .attr("height", legendHeight)
  .attr("fill", "url(#upset-degree-gradient)");
svg
  .append("text")
  .attr("x", legendX)
  .attr("y", legendY - 8)
  .attr("text-anchor", "start")
  .attr("fill", t.inkSoft)
  .style("font-size", "12px")
  .text("1 set");
svg
  .append("text")
  .attr("x", legendX + legendWidth)
  .attr("y", legendY - 8)
  .attr("text-anchor", "end")
  .attr("fill", t.inkSoft)
  .style("font-size", "12px")
  .text(`${maxDegree} sets`);
svg
  .append("text")
  .attr("x", legendX + legendWidth / 2)
  .attr("y", legendY + legendHeight + 16)
  .attr("text-anchor", "middle")
  .attr("fill", t.inkSoft)
  .style("font-size", "11px")
  .text("Intersection degree");

// Alternating row stripes for matrix readability
rowNames.forEach((name, i) => {
  if (i % 2 === 1) {
    svg
      .append("rect")
      .attr("x", matrixLeft)
      .attr("y", matrixTop + i * rowHeight)
      .attr("width", matrixWidth)
      .attr("height", rowHeight)
      .attr("fill", t.elevatedBg);
  }
});

// Row labels (set names)
rowNames.forEach((name) => {
  svg
    .append("text")
    .attr("x", margin.left + labelWidth - 12)
    .attr("y", rowCenter(name))
    .attr("text-anchor", "end")
    .attr("dominant-baseline", "middle")
    .attr("fill", t.inkSoft)
    .style("font-size", "15px")
    .text(name);
});

// Horizontal bars — total members per set, flush against the matrix
setSizes.forEach((s) => {
  const w = xSetBar(s.size);
  svg
    .append("rect")
    .attr("x", matrixLeft - w)
    .attr("y", rowCenter(s.name) - rowHeight * 0.32)
    .attr("width", w)
    .attr("height", rowHeight * 0.64)
    .attr("fill", t.palette[0]);
});

const setBarScale = d3.scaleLinear().domain([0, maxSetSize]).nice().range([matrixLeft, matrixLeft - setBarWidth]);
const setBarAxis = svg.append("g").attr("transform", `translate(0,${matrixBottom})`).call(d3.axisBottom(setBarScale).ticks(3));
setBarAxis.selectAll("text").attr("fill", t.inkSoft).style("font-size", "12px");
setBarAxis.selectAll("line").attr("stroke", t.grid);
setBarAxis.select(".domain").attr("stroke", t.inkSoft);
svg
  .append("text")
  .attr("x", matrixLeft - setBarWidth / 2)
  .attr("y", matrixBottom + 40)
  .attr("text-anchor", "middle")
  .attr("fill", t.inkSoft)
  .style("font-size", "14px")
  .text("Set Size");

// Vertical bars — intersection cardinality, colored by degree
intersections.forEach((d, i) => {
  const x = xCol(i);
  const y = yCount(d.count);
  svg
    .append("rect")
    .attr("x", x)
    .attr("y", y)
    .attr("width", xCol.bandwidth())
    .attr("height", topChartBottom - y)
    .attr("fill", degreeColor(d.members.length));
});

const countAxis = svg.append("g").attr("transform", `translate(${matrixLeft},0)`).call(d3.axisLeft(yCount).ticks(5));
countAxis.selectAll("text").attr("fill", t.inkSoft).style("font-size", "13px");
countAxis.selectAll("line").attr("stroke", t.grid);
countAxis.select(".domain").attr("stroke", t.inkSoft);
svg
  .append("text")
  .attr("transform", "rotate(-90)")
  .attr("x", -((topChartTop + topChartBottom) / 2))
  .attr("y", matrixLeft - 46)
  .attr("text-anchor", "middle")
  .attr("fill", t.inkSoft)
  .style("font-size", "14px")
  .text("Intersection Size");

// Dot matrix — filled dot + connecting line marks which sets form each intersection
const dotG = svg.append("g");
intersections.forEach((d, i) => {
  const cx = xCol(i) + xCol.bandwidth() / 2;
  const includedYs = rowNames.filter((name) => d.members.includes(name)).map(rowCenter);

  if (includedYs.length > 1) {
    dotG
      .append("line")
      .attr("x1", cx)
      .attr("x2", cx)
      .attr("y1", d3.min(includedYs))
      .attr("y2", d3.max(includedYs))
      .attr("stroke", t.ink)
      .attr("stroke-width", 3);
  }

  rowNames.forEach((name) => {
    const included = d.members.includes(name);
    dotG
      .append("circle")
      .attr("cx", cx)
      .attr("cy", rowCenter(name))
      .attr("r", included ? 9 : 5)
      .attr("fill", included ? t.ink : "none")
      .attr("stroke", included ? "none" : t.grid)
      .attr("stroke-width", included ? 0 : 1.5);
  });
});
Runnable source as JSON, for any HTTP client: https://api.anyplot.ai/specs/upset-basic/d3/code. Any spec id and library id listed in llms-full.txt fit the same URL shape; every URL below is complete and callable.
{
  "spec_id": "upset-basic",
  "language": "javascript",
  "library": "d3",
  "page": "https://anyplot.ai/upset-basic/javascript/d3",
  "hub": "https://anyplot.ai/upset-basic",
  "code_json": "https://api.anyplot.ai/specs/upset-basic/d3/code",
  "spec_json": "https://api.anyplot.ai/specs/upset-basic",
  "render_light_png": "https://storage.googleapis.com/anyplot-images/plots/upset-basic/javascript/d3/plot-light.png",
  "render_dark_png": "https://storage.googleapis.com/anyplot-images/plots/upset-basic/javascript/d3/plot-dark.png",
  "interactive_light_html": "https://storage.googleapis.com/anyplot-images/plots/upset-basic/javascript/d3/plot-light.html",
  "interactive_dark_html": "https://storage.googleapis.com/anyplot-images/plots/upset-basic/javascript/d3/plot-dark.html",
  "quality_score": 91.0,
  "license": "MIT",
  "guide": "https://anyplot.ai/llms.txt"
}
Part of UpSet Plot for Multi-Set Intersection Analysis on anyplot.ai.