The same plot in 14 other libraries — Python: Altair, Bokeh, lets-plot, Matplotlib, Plotly, plotnine, Seaborn; R: ggplot2; Julia: Makie.jl; JavaScript: Chart.js, D3.js, Apache ECharts, Highcharts, MUI X Charts. Compare all 15 side by side: UpSet Plot for Multi-Set Intersection Analysis in Python, R, Julia and JavaScript.
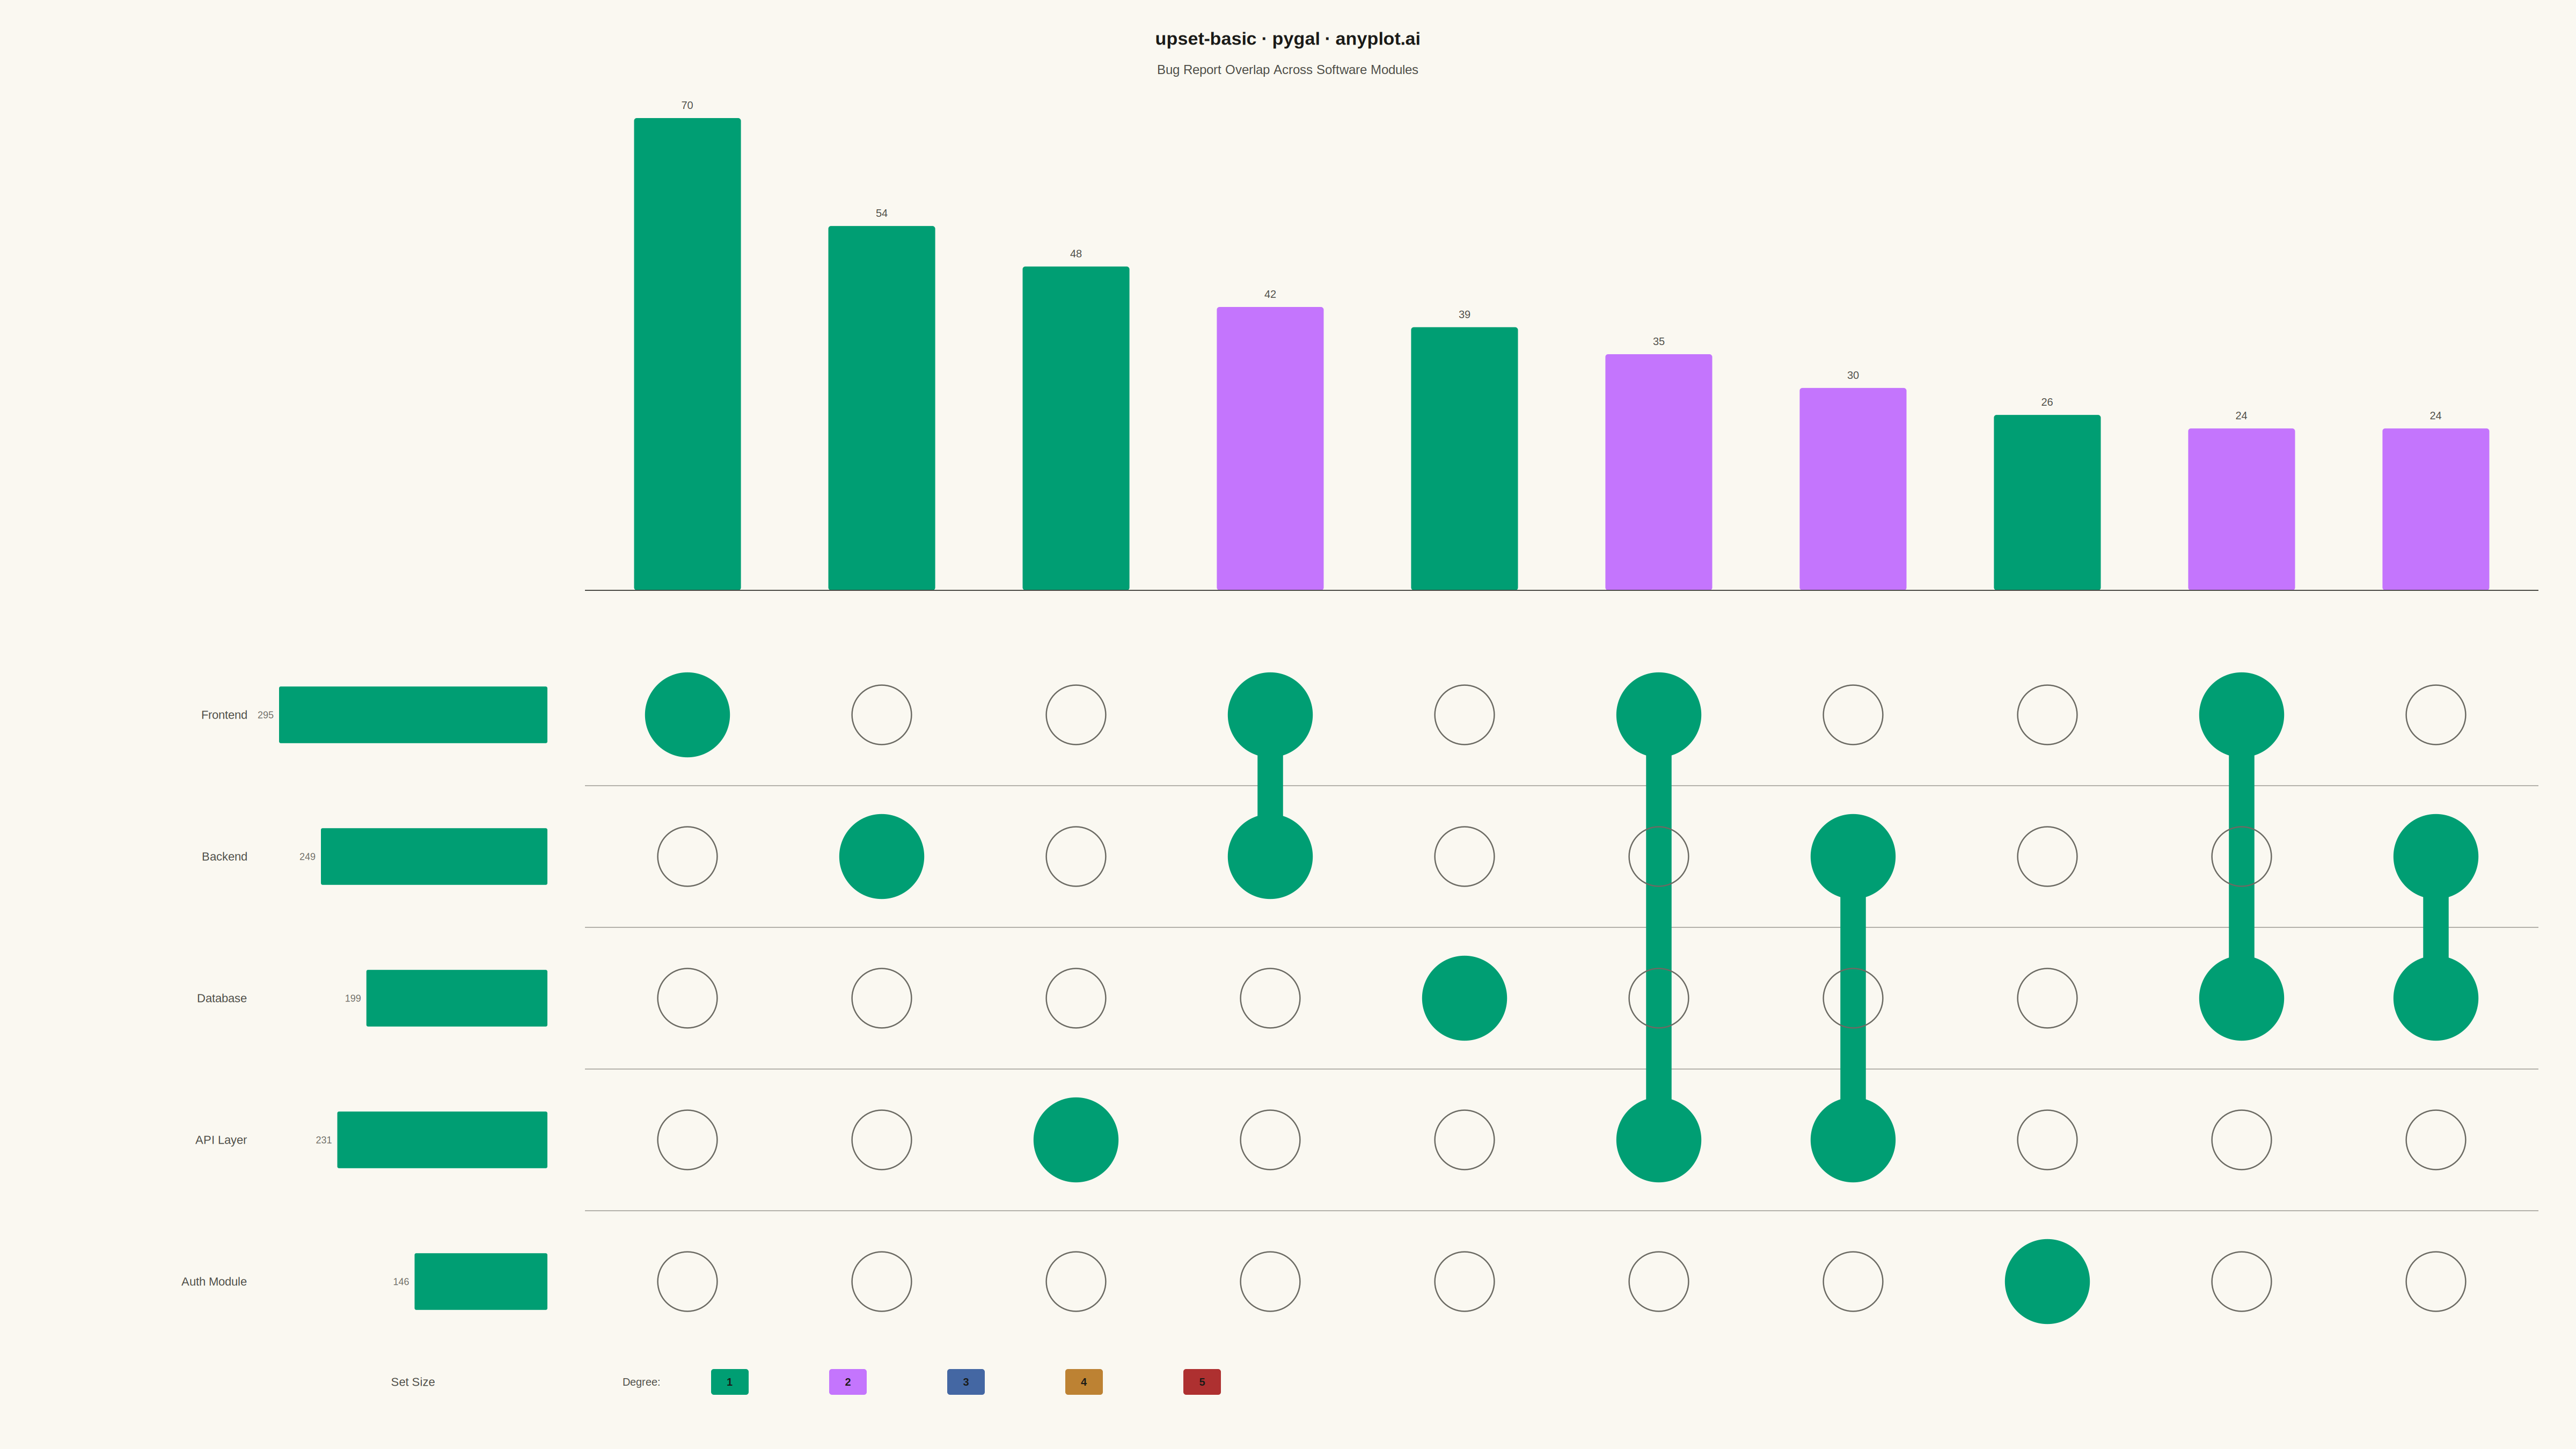
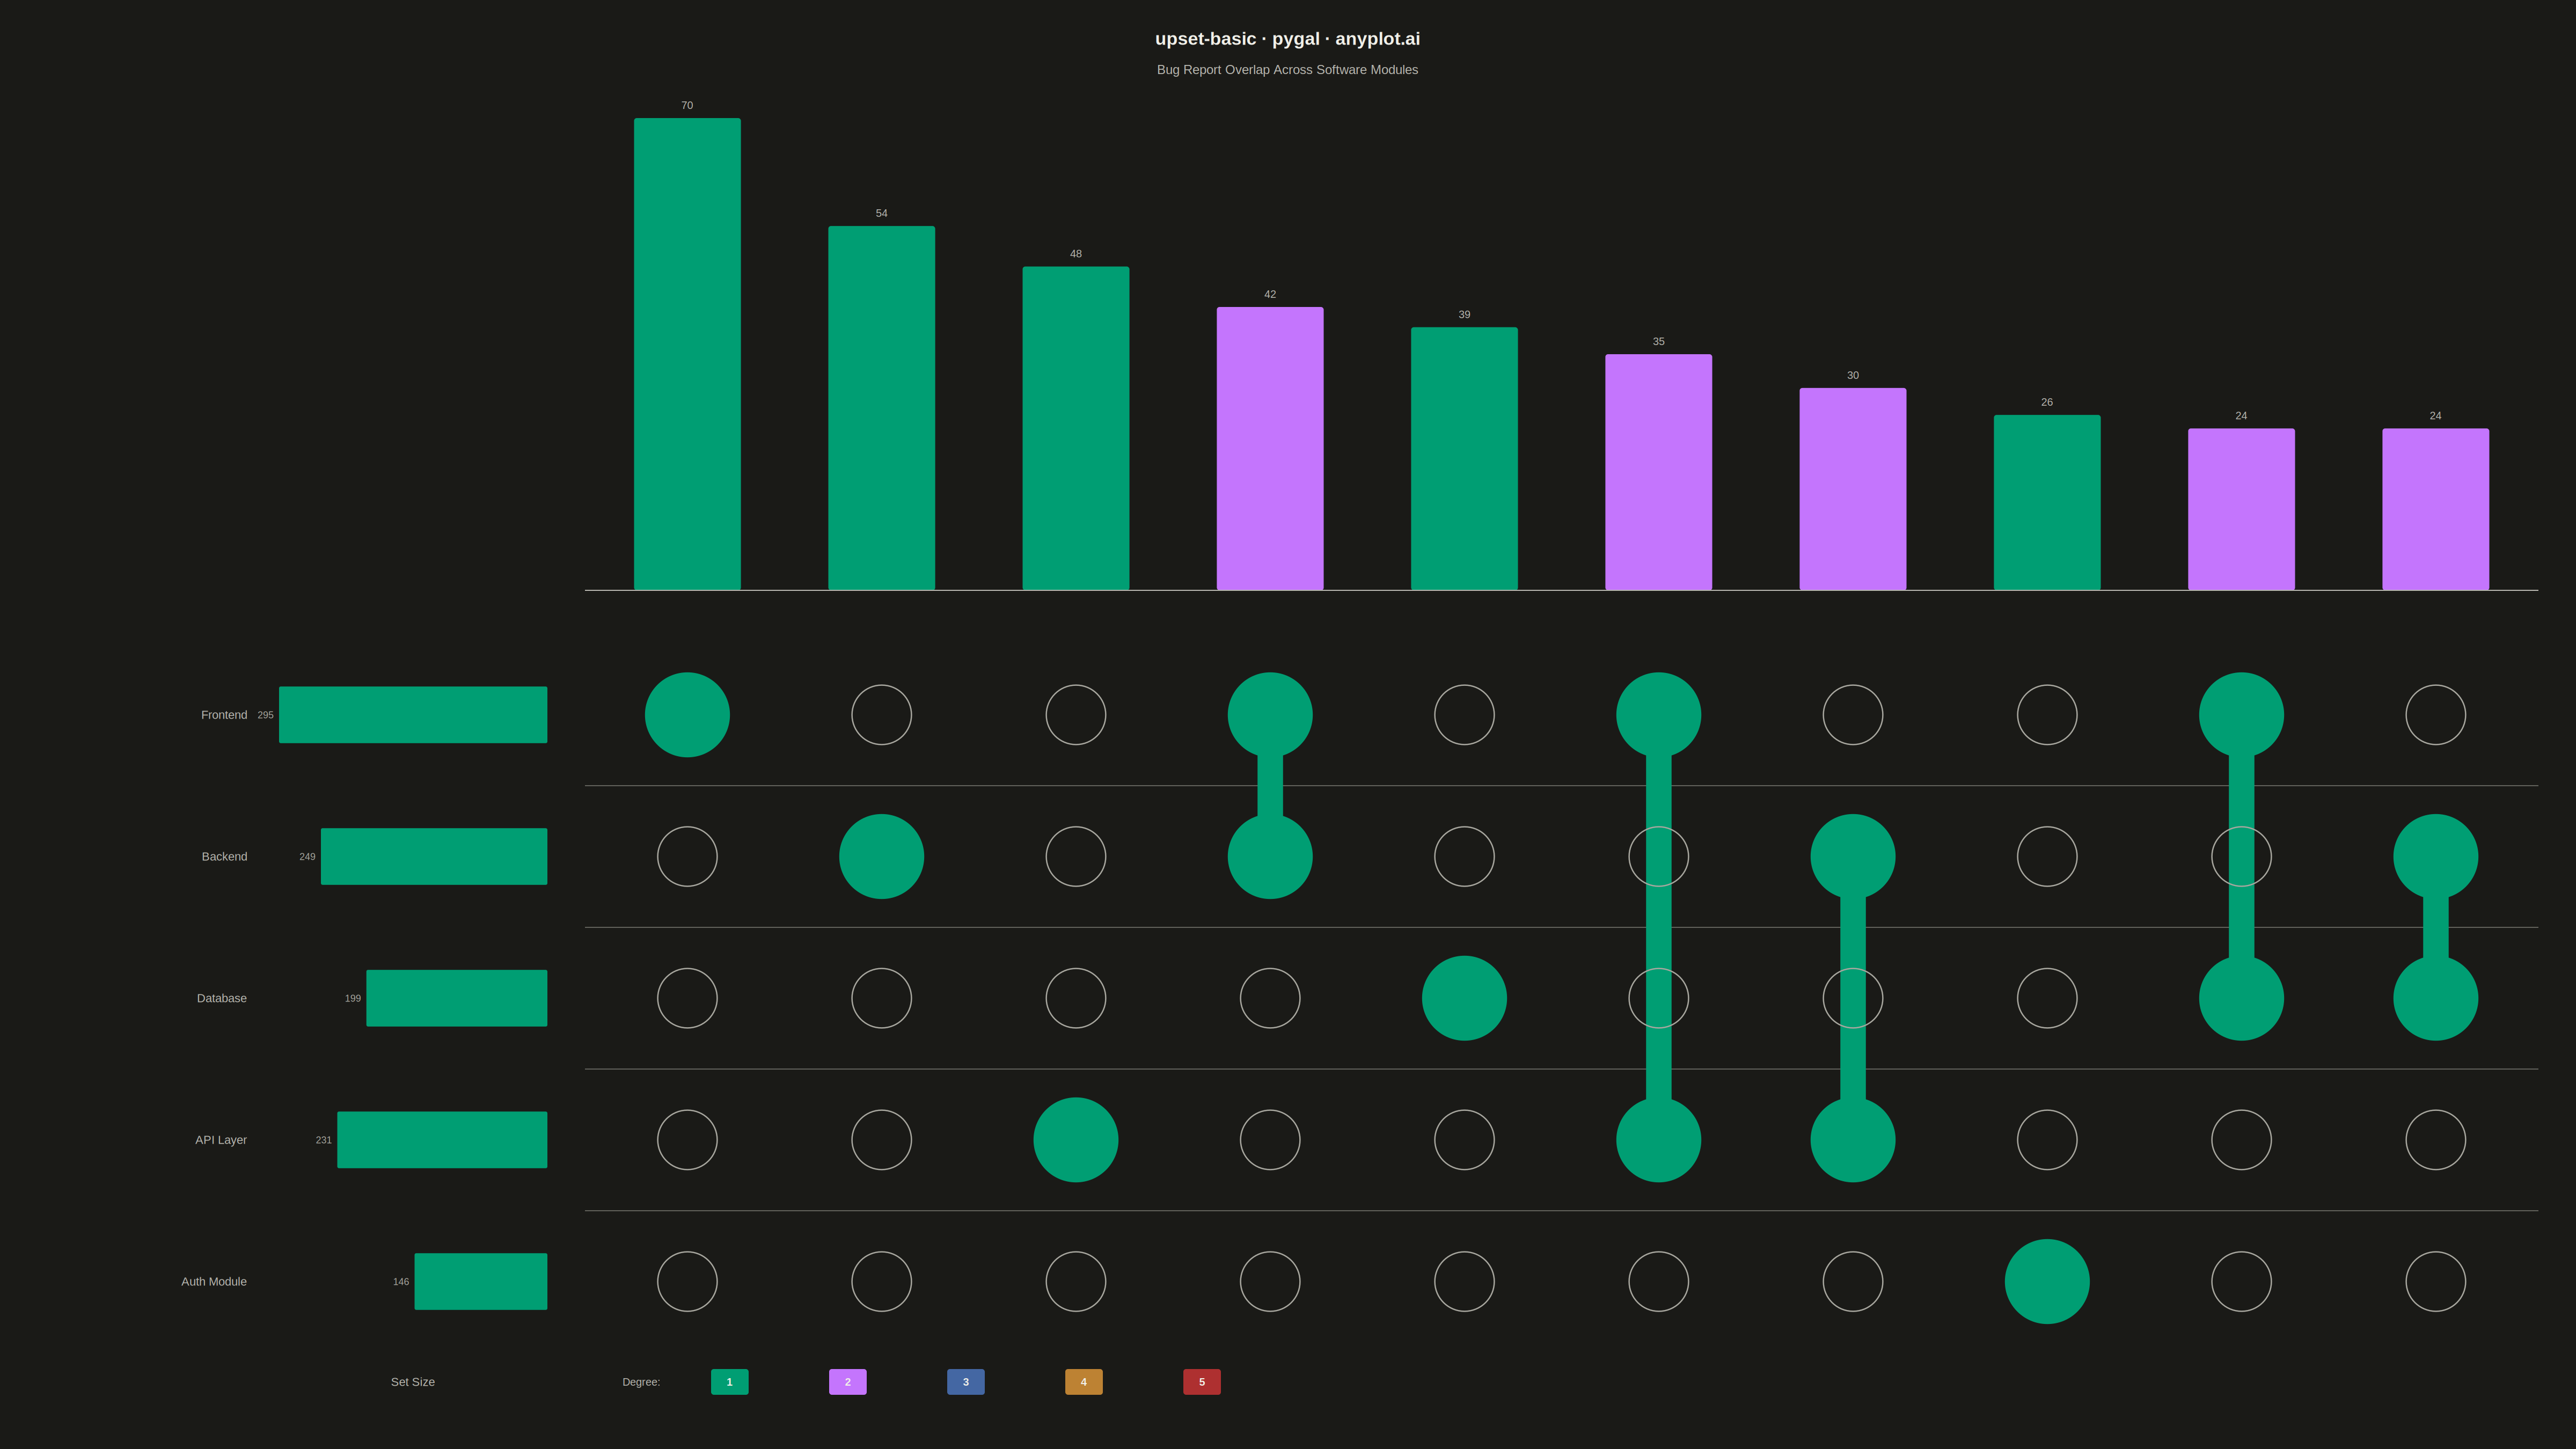
An UpSet plot visualizes intersections of multiple sets using a matrix-based layout that scales far better than Venn diagrams beyond 3 sets. A horizontal bar chart shows individual set sizes, a dot-matrix indicates which sets participate in each intersection, and a vertical bar chart above shows the intersection cardinality. This is the modern standard for set intersection analysis, making complex overlaps between many sets immediately readable.
""" anyplot.ai
upset-basic: UpSet Plot for Multi-Set Intersection Analysis
Library: pygal 3.1.0 | Python 3.13.13
Quality: 74/100 | Created: 2026-05-13
"""

import os
from collections import Counter

import cairosvg
import numpy as np


THEME = os.getenv("ANYPLOT_THEME", "light")
PAGE_BG = "#FAF8F1" if THEME == "light" else "#1A1A17"
INK = "#1A1A17" if THEME == "light" else "#F0EFE8"
INK_SOFT = "#4A4A44" if THEME == "light" else "#B8B7B0"
INK_MUTED = "#6B6A63" if THEME == "light" else "#A8A79F"
BRAND = "#009E73"
PALETTE = ("#009E73", "#C475FD", "#4467A3", "#BD8233", "#AE3030", "#2ABCCD", "#954477")

# Data: Bug report overlap across software modules
np.random.seed(42)
set_names = ["Frontend", "Backend", "Database", "API Layer", "Auth Module"]
N_SETS = len(set_names)
N_BUGS = 700
probs = [0.40, 0.35, 0.28, 0.33, 0.22]

memberships = np.column_stack([np.random.rand(N_BUGS) < p for p in probs])
memberships = memberships[memberships.any(axis=1)]

intersection_counts = Counter(frozenset(np.where(row)[0]) for row in memberships)
top_n = 10
top_intersections = sorted(intersection_counts.items(), key=lambda x: -x[1])[:top_n]
N_INTS = len(top_intersections)
set_sizes = memberships.sum(axis=0).astype(int)
max_int = top_intersections[0][1]
max_set = int(max(set_sizes))

# Canvas and layout
W, H = 4800, 2700
ML = 60
LW = 400
G1 = 60
SBW = 500
G2 = 80
MX0 = ML + LW + G1 + SBW + G2  # matrix x start = 1100
CW = (W - MX0 - 80) / N_INTS  # column width ≈ 362

AY = 1100  # bar chart baseline y
BMH = 880  # bar max height
MT = AY + 100  # matrix top = 1200
RH = (H - MT - 180) / N_SETS  # row height ≈ 264
MB = MT + N_SETS * RH  # matrix bottom ≈ 2520
DR = min(CW * 0.28, RH * 0.30)  # dot radius ≈ 79
CLW = DR * 0.60  # connecting line width ≈ 47


def _r(x, y, w, h, fill, rx=0):
    return (
        f'<rect x="{x:.1f}" y="{y:.1f}" '
        f'width="{max(w, 0.1):.1f}" height="{max(h, 0.1):.1f}" '
        f'fill="{fill}" rx="{rx:.1f}"/>'
    )


def _c(cx, cy, rad, fill=None, stroke=None, sw=2.5):
    if fill:
        return f'<circle cx="{cx:.1f}" cy="{cy:.1f}" r="{rad:.1f}" fill="{fill}"/>'
    return f'<circle cx="{cx:.1f}" cy="{cy:.1f}" r="{rad:.1f}" fill="none" stroke="{stroke}" stroke-width="{sw:.1f}"/>'


def _t(x, y, txt, sz, fill, anchor="middle", weight="normal"):
    return (
        f'<text x="{x:.1f}" y="{y:.1f}" text-anchor="{anchor}" '
        f'dominant-baseline="middle" font-size="{sz}" fill="{fill}" '
        f'font-weight="{weight}" font-family="Arial,Helvetica,sans-serif">'
        f"{txt}</text>"
    )


def _hl(x1, x2, y, stroke, w=1.5):
    return f'<line x1="{x1:.1f}" y1="{y:.1f}" x2="{x2:.1f}" y2="{y:.1f}" stroke="{stroke}" stroke-width="{w:.1f}"/>'


def _vl(x, y1, y2, stroke, w):
    return f'<line x1="{x:.1f}" y1="{y1:.1f}" x2="{x:.1f}" y2="{y2:.1f}" stroke="{stroke}" stroke-width="{w:.1f}"/>'


el = []

# Background
el.append(_r(0, 0, W, H, PAGE_BG))

# Title and subtitle
el.append(_t(W / 2, 72, "upset-basic · pygal · anyplot.ai", 34, INK, weight="bold"))
el.append(_t(W / 2, 130, "Bug Report Overlap Across Software Modules", 24, INK_SOFT))

# Intersection bars (top panel, sorted descending by count)
for i, (combo, count) in enumerate(top_intersections):
    cx = MX0 + (i + 0.5) * CW
    bh = count / max_int * BMH
    bw = CW * 0.55
    bx = cx - bw / 2
    by = AY - bh
    deg = len(combo)
    color = PALETTE[min(deg - 1, len(PALETTE) - 1)]
    el.append(_r(bx, by, bw, bh, color, rx=5))
    el.append(_t(cx, by - 24, str(count), 20, INK_SOFT))

# Axis line under intersection bars
el.append(_hl(MX0 - 10, W - 70, AY, INK_SOFT, 2))

# Matrix row separators and set labels
for row_i in range(N_SETS):
    ry = MT + (row_i + 0.5) * RH
    if row_i > 0:
        el.append(_hl(MX0 - 10, W - 70, MT + row_i * RH, INK_MUTED, 1))
    el.append(_t(ML + LW, ry, set_names[row_i], 22, INK_SOFT, "end"))

# Connecting lines (drawn before dots for correct z-order)
for col_i, (combo, _) in enumerate(top_intersections):
    members = sorted(combo)
    if len(members) > 1:
        cx = MX0 + (col_i + 0.5) * CW
        y1 = MT + (members[0] + 0.5) * RH
        y2 = MT + (members[-1] + 0.5) * RH
        el.append(_vl(cx, y1, y2, BRAND, CLW))

# Dots (filled = member of set, empty circle = non-member)
for row_i in range(N_SETS):
    ry = MT + (row_i + 0.5) * RH
    for col_i, (combo, _) in enumerate(top_intersections):
        cx = MX0 + (col_i + 0.5) * CW
        if row_i in combo:
            el.append(_c(cx, ry, DR, fill=BRAND))
        else:
            el.append(_c(cx, ry, DR * 0.70, stroke=INK_MUTED))

# Set size horizontal bars (left panel)
for row_i, size in enumerate(set_sizes):
    ry = MT + (row_i + 0.5) * RH
    bh = RH * 0.40
    bw = size / max_set * SBW
    bx = ML + LW + G1 + SBW - bw
    by = ry - bh / 2
    el.append(_r(bx, by, bw, bh, BRAND, rx=3))
    el.append(_t(bx - 10, ry, str(size), 18, INK_MUTED, "end"))

# "Set Size" axis label below the set bars
el.append(_t(ML + LW + G1 + SBW / 2, MB + 55, "Set Size", 22, INK_SOFT))

# Degree color legend
ly = MB + 55
lx0 = MX0 + 60
el.append(_t(lx0, ly, "Degree:", 20, INK_SOFT, "start"))
for d in range(1, 6):
    col = PALETTE[d - 1]
    lx = lx0 + 200 + (d - 1) * 220
    el.append(_r(lx - 35, ly - 24, 70, 48, col, rx=5))
    el.append(_t(lx, ly, str(d), 20, INK, weight="bold"))

# Compose SVG
svg = (
    f'<?xml version="1.0" encoding="utf-8"?>'
    f'<svg xmlns="http://www.w3.org/2000/svg" '
    f'width="{W}" height="{H}" viewBox="0 0 {W} {H}">' + "".join(el) + "</svg>"
)

# Save HTML (pygal produces interactive SVG-in-HTML)
html = (
    f"<!DOCTYPE html><html><head><style>body{{margin:0;background:{PAGE_BG}}}</style></head><body>{svg}</body></html>"
)
with open(f"plot-{THEME}.html", "w", encoding="utf-8") as f:
    f.write(html)

# Save PNG via cairosvg (pygal's rendering backend)
cairosvg.svg2png(bytestring=svg.encode(), write_to=f"plot-{THEME}.png")
Runnable source as JSON, for any HTTP client: https://api.anyplot.ai/specs/upset-basic/pygal/code. Any spec id and library id listed in llms-full.txt fit the same URL shape; every URL below is complete and callable.
{
  "spec_id": "upset-basic",
  "language": "python",
  "library": "pygal",
  "page": "https://anyplot.ai/upset-basic/python/pygal",
  "hub": "https://anyplot.ai/upset-basic",
  "code_json": "https://api.anyplot.ai/specs/upset-basic/pygal/code",
  "spec_json": "https://api.anyplot.ai/specs/upset-basic",
  "render_light_png": "https://storage.googleapis.com/anyplot-images/plots/upset-basic/python/pygal/plot-light.png",
  "render_dark_png": "https://storage.googleapis.com/anyplot-images/plots/upset-basic/python/pygal/plot-dark.png",
  "interactive_light_html": "https://storage.googleapis.com/anyplot-images/plots/upset-basic/python/pygal/plot-light.html",
  "interactive_dark_html": "https://storage.googleapis.com/anyplot-images/plots/upset-basic/python/pygal/plot-dark.html",
  "quality_score": 74.0,
  "license": "MIT",
  "guide": "https://anyplot.ai/llms.txt"
}
Part of UpSet Plot for Multi-Set Intersection Analysis on anyplot.ai.