The same plot in 14 other libraries — Python: Altair, Bokeh, lets-plot, Plotly, plotnine, Pygal, Seaborn; R: ggplot2; Julia: Makie.jl; JavaScript: Chart.js, D3.js, Apache ECharts, Highcharts, MUI X Charts. Compare all 15 side by side: UpSet Plot for Multi-Set Intersection Analysis in Python, R, Julia and JavaScript.
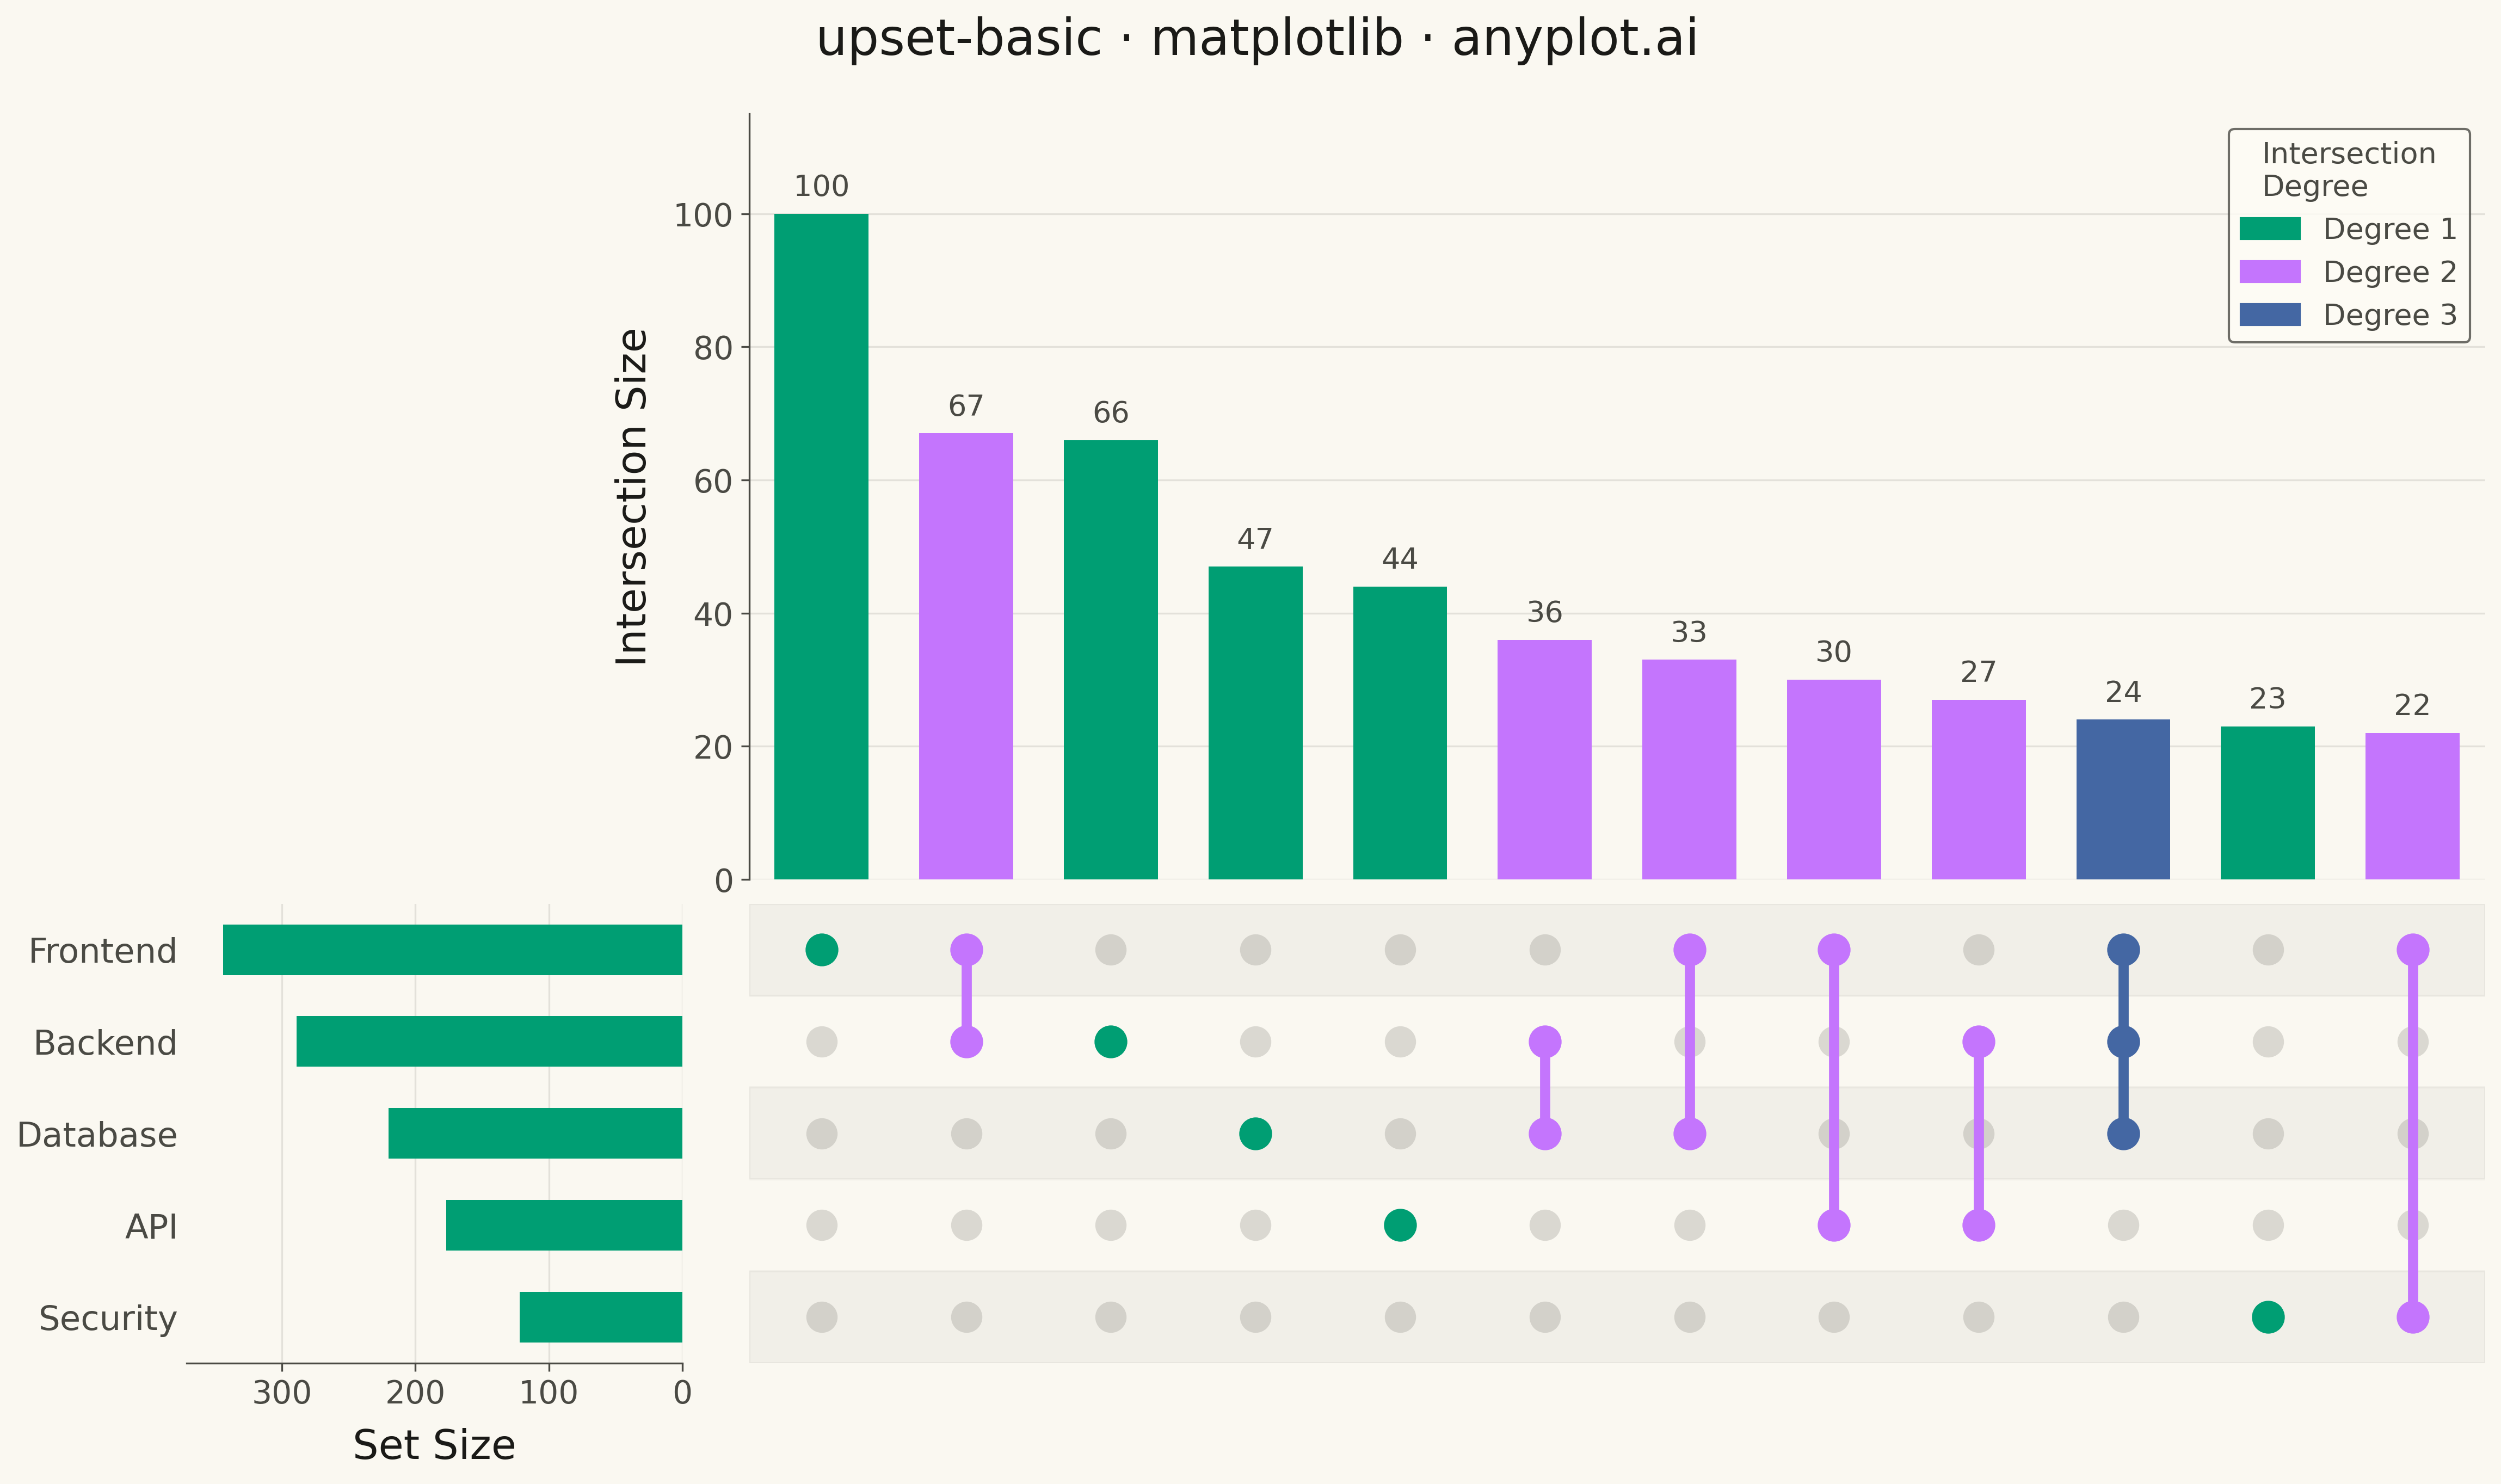
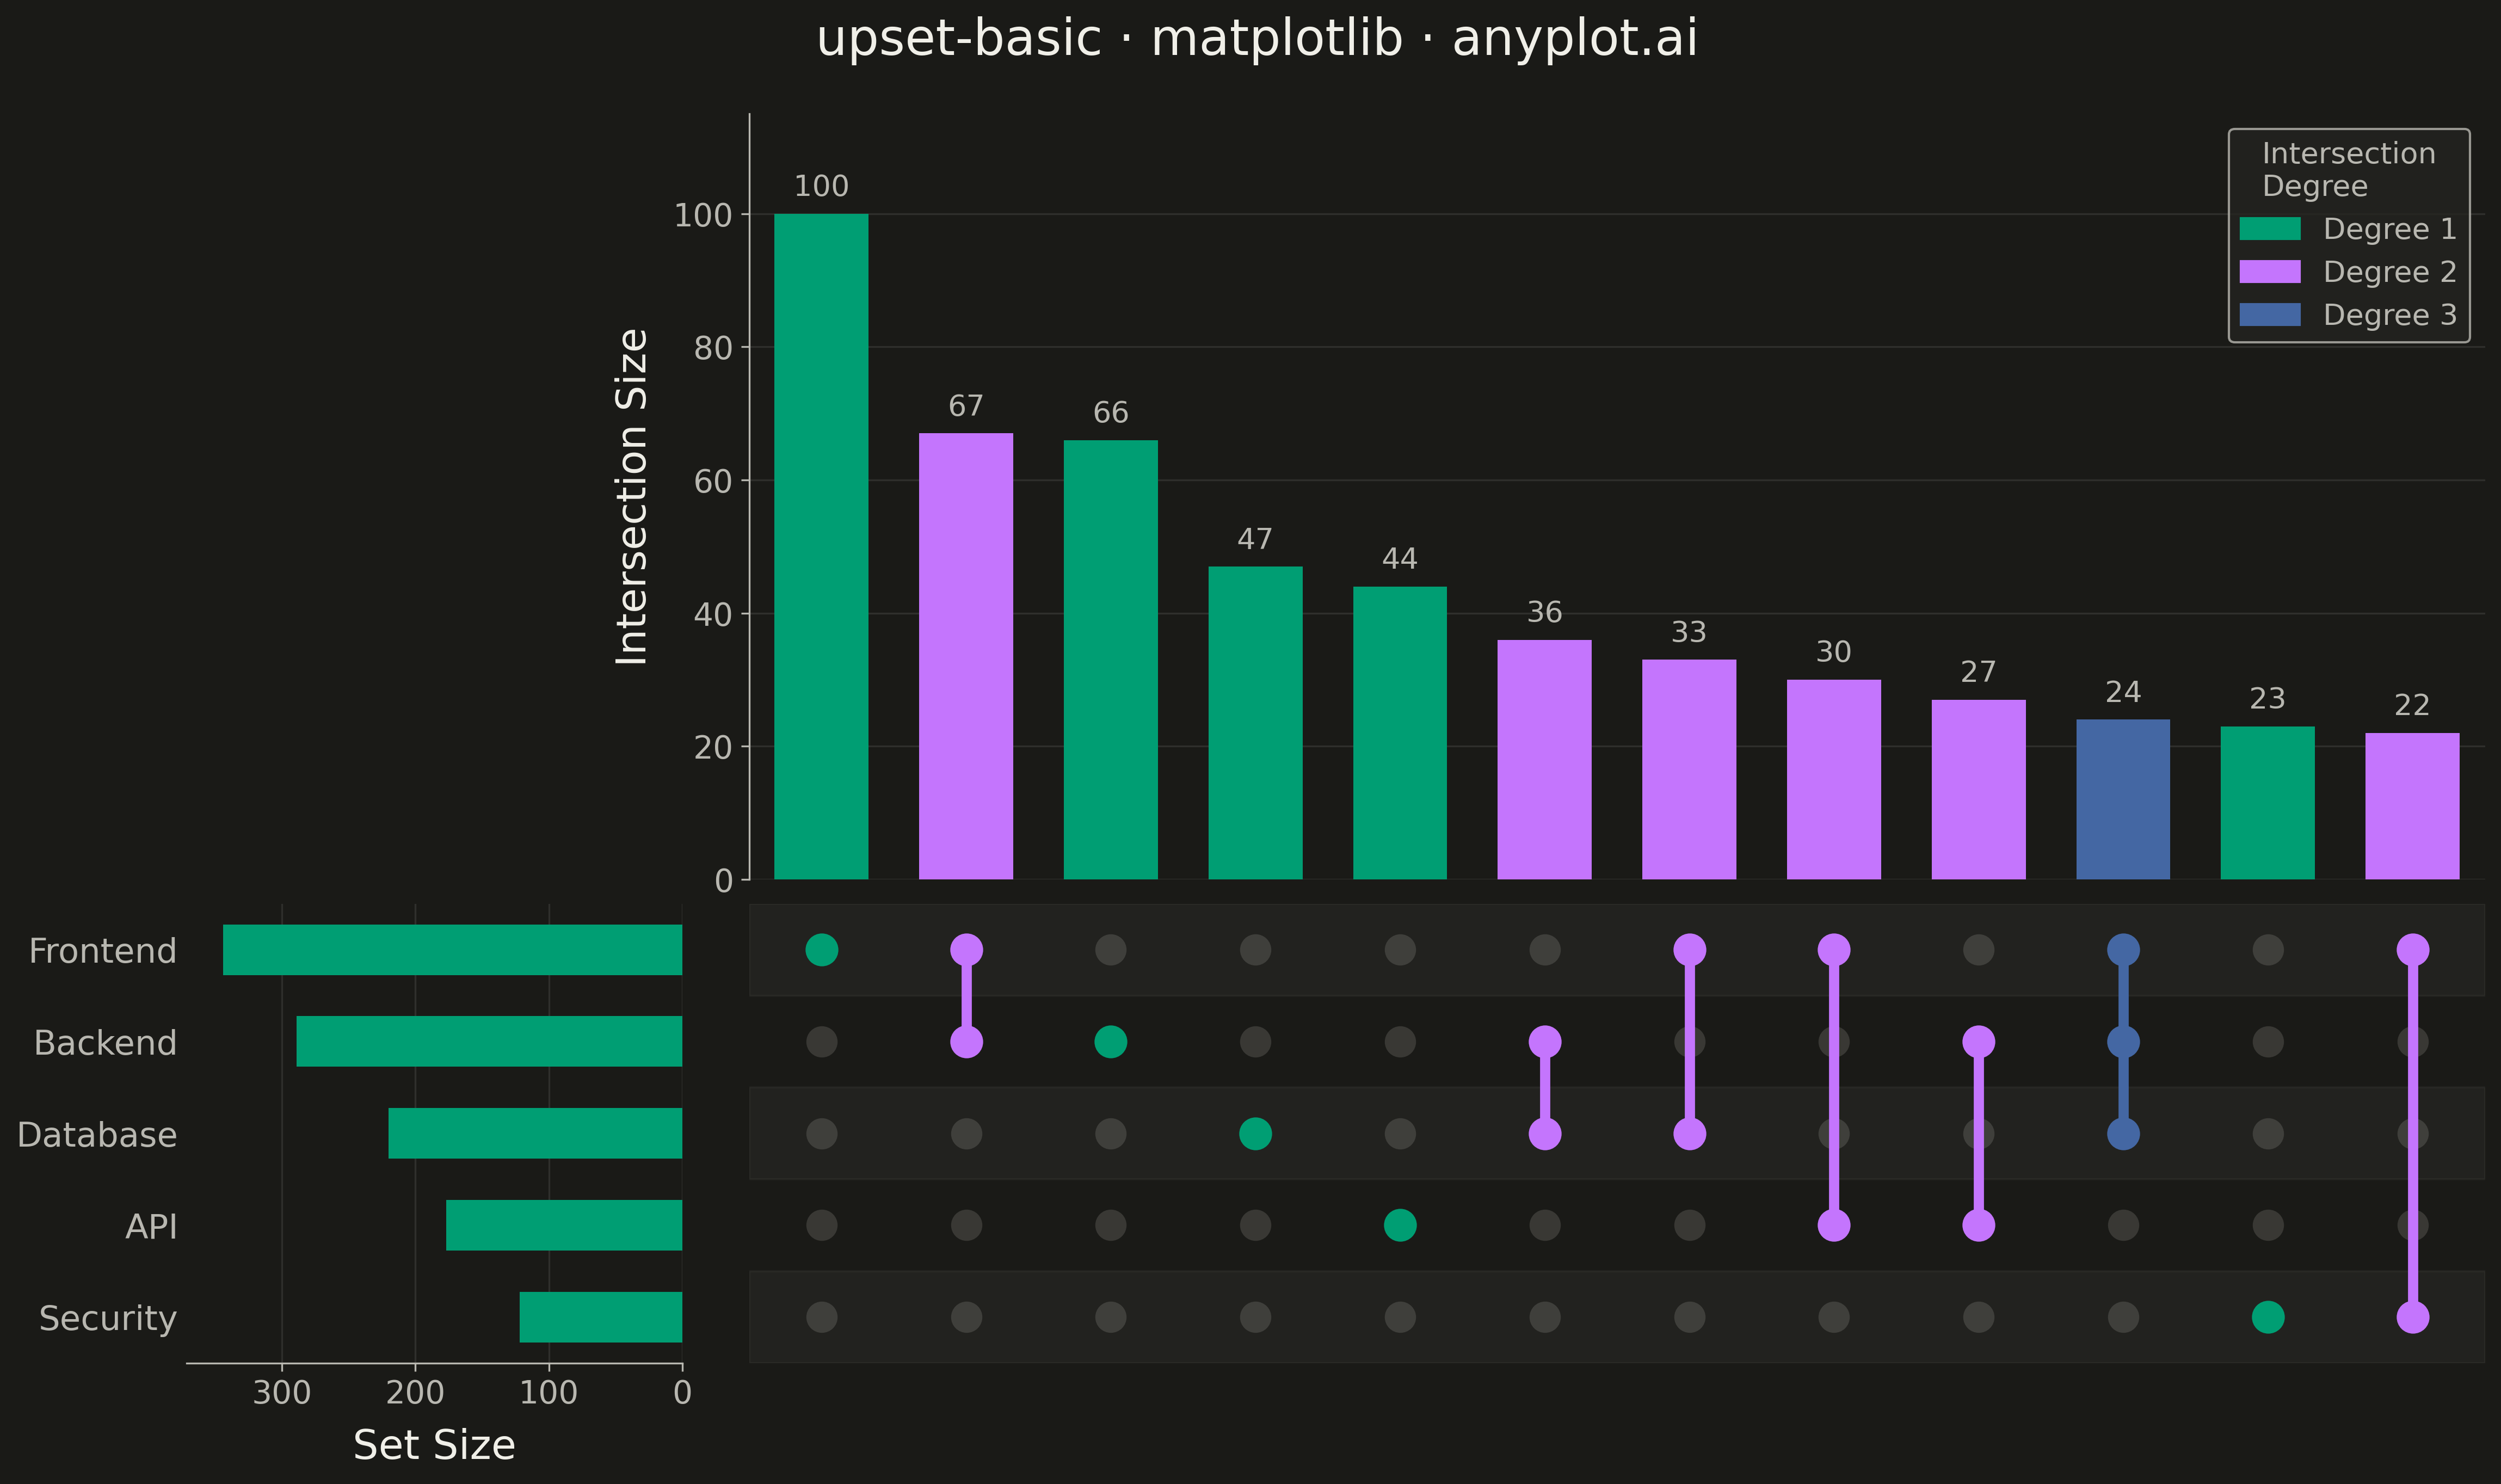
An UpSet plot visualizes intersections of multiple sets using a matrix-based layout that scales far better than Venn diagrams beyond 3 sets. A horizontal bar chart shows individual set sizes, a dot-matrix indicates which sets participate in each intersection, and a vertical bar chart above shows the intersection cardinality. This is the modern standard for set intersection analysis, making complex overlaps between many sets immediately readable.
""" anyplot.ai
upset-basic: UpSet Plot for Multi-Set Intersection Analysis
Library: matplotlib 3.10.9 | Python 3.13.13
Quality: 89/100 | Created: 2026-05-13
"""

import os
import sys
from collections import defaultdict


sys.path.pop(0)  # prevent shadowing the matplotlib library with this file

import matplotlib.gridspec as gridspec
import matplotlib.patches as mpatches
import matplotlib.pyplot as plt
import numpy as np


# Theme tokens
THEME = os.getenv("ANYPLOT_THEME", "light")
PAGE_BG = "#FAF8F1" if THEME == "light" else "#1A1A17"
ELEVATED_BG = "#FFFDF6" if THEME == "light" else "#242420"
INK = "#1A1A17" if THEME == "light" else "#F0EFE8"
INK_SOFT = "#4A4A44" if THEME == "light" else "#B8B7B0"
INK_MUTED = "#6B6A63" if THEME == "light" else "#A8A79F"
BRAND = "#009E73"
IMPRINT = ["#009E73", "#C475FD", "#4467A3", "#BD8233", "#AE3030", "#2ABCCD"]

# Data: bug reports spanning software system modules
np.random.seed(42)
set_names = ["Frontend", "Backend", "Database", "API", "Security"]
n_sets = len(set_names)
n_bugs = 800

# Probability of each bug affecting each module
probs = [0.42, 0.36, 0.28, 0.24, 0.16]
membership = np.column_stack([np.random.rand(n_bugs) < p for p in probs])
membership = membership[membership.any(axis=1)]

# Intersection signatures and counts
intersection_counts = defaultdict(int)
for row in membership:
    intersection_counts[tuple(bool(v) for v in row)] += 1

set_sizes = [int(membership[:, i].sum()) for i in range(n_sets)]

# Sort intersections by count (descending), take top 12
sorted_ints = sorted(intersection_counts.items(), key=lambda x: -x[1])[:12]
int_sigs = [s for s, _ in sorted_ints]
int_counts = [c for _, c in sorted_ints]
n_ints = len(int_sigs)
degrees = [sum(sig) for sig in int_sigs]

# Figure layout: 2×2 grid (top-left empty, top-right = bars, bottom-left = set sizes, bottom-right = matrix)
fig = plt.figure(figsize=(16, 9), facecolor=PAGE_BG)
gs = gridspec.GridSpec(
    2,
    2,
    width_ratios=[1, 3.5],
    height_ratios=[2.5, 1.5],
    hspace=0.04,
    wspace=0.06,
    left=0.09,
    right=0.97,
    top=0.90,
    bottom=0.05,
)
ax_bars = fig.add_subplot(gs[0, 1])
ax_matrix = fig.add_subplot(gs[1, 1])
ax_sets = fig.add_subplot(gs[1, 0])

# ── Intersection bars (top right) ──────────────────────────────────────────────
bar_colors = [IMPRINT[min(d - 1, len(IMPRINT) - 1)] for d in degrees]
ax_bars.bar(range(n_ints), int_counts, color=bar_colors, width=0.65, zorder=2)
for i, (cnt, _col) in enumerate(zip(int_counts, bar_colors, strict=False)):
    ax_bars.text(
        i,
        cnt + max(int_counts) * 0.018,
        str(cnt),
        ha="center",
        va="bottom",
        fontsize=13,
        color=INK_SOFT,
        fontweight="medium",
    )

ax_bars.set_xlim(-0.5, n_ints - 0.5)
ax_bars.set_ylim(0, max(int_counts) * 1.15)
ax_bars.set_ylabel("Intersection Size", fontsize=18, color=INK, labelpad=8)
ax_bars.set_facecolor(PAGE_BG)
ax_bars.tick_params(axis="y", labelsize=14, labelcolor=INK_SOFT, colors=INK_SOFT)
ax_bars.tick_params(axis="x", bottom=False, labelbottom=False)
ax_bars.yaxis.grid(True, alpha=0.10, linewidth=0.8, color=INK)
ax_bars.set_axisbelow(True)
ax_bars.spines["top"].set_visible(False)
ax_bars.spines["right"].set_visible(False)
ax_bars.spines["bottom"].set_visible(False)
ax_bars.spines["left"].set_color(INK_SOFT)

# Degree legend inside intersection bars area
patches = [mpatches.Patch(color=IMPRINT[min(d - 1, 5)], label=f"Degree {d}") for d in sorted(set(degrees))]
leg = ax_bars.legend(
    handles=patches,
    fontsize=13,
    loc="upper right",
    title="Intersection\nDegree",
    title_fontsize=13,
    frameon=True,
    facecolor=ELEVATED_BG,
    edgecolor=INK_SOFT,
)
plt.setp(leg.get_texts(), color=INK_SOFT)
plt.setp(leg.get_title(), color=INK_SOFT)

# ── Dot matrix (bottom right) ──────────────────────────────────────────────────
ax_matrix.set_facecolor(PAGE_BG)
ax_matrix.set_xlim(-0.5, n_ints - 0.5)
ax_matrix.set_ylim(-0.5, n_sets - 0.5)
ax_matrix.invert_yaxis()
ax_matrix.set_yticks(range(n_sets))
ax_matrix.set_yticklabels([])
ax_matrix.tick_params(axis="x", bottom=False, labelbottom=False)
ax_matrix.tick_params(axis="y", left=False, length=0)

# Alternating row shading
for i in range(n_sets):
    if i % 2 == 0:
        ax_matrix.axhspan(i - 0.5, i + 0.5, color=INK, alpha=0.04, zorder=0)

# Inactive dots
for col_j, sig in enumerate(int_sigs):
    for row_i, active in enumerate(sig):
        if not active:
            ax_matrix.scatter(col_j, row_i, s=190, color=INK_MUTED, alpha=0.22, zorder=1, linewidths=0)

# Active dots + connecting lines
for col_j, (sig, deg) in enumerate(zip(int_sigs, degrees, strict=False)):
    color = IMPRINT[min(deg - 1, len(IMPRINT) - 1)]
    active_rows = [i for i, v in enumerate(sig) if v]
    if len(active_rows) > 1:
        ax_matrix.plot(
            [col_j, col_j],
            [min(active_rows), max(active_rows)],
            color=color,
            linewidth=4.5,
            solid_capstyle="round",
            zorder=2,
        )
    for row_i in active_rows:
        ax_matrix.scatter(col_j, row_i, s=210, color=color, zorder=3, linewidths=0)

for spine in ax_matrix.spines.values():
    spine.set_visible(False)

# ── Set size bars (bottom left) ────────────────────────────────────────────────
ax_sets.set_facecolor(PAGE_BG)
ax_sets.barh(range(n_sets), set_sizes, color=BRAND, height=0.55)
ax_sets.set_xlim(0, max(set_sizes) * 1.08)
ax_sets.invert_xaxis()
ax_sets.set_ylim(-0.5, n_sets - 0.5)
ax_sets.invert_yaxis()
ax_sets.set_yticks(range(n_sets))
ax_sets.set_yticklabels(set_names, fontsize=15, color=INK_SOFT)
ax_sets.set_xlabel("Set Size", fontsize=18, color=INK, labelpad=8)
ax_sets.tick_params(axis="x", labelsize=14, labelcolor=INK_SOFT, colors=INK_SOFT)
ax_sets.tick_params(axis="y", left=False, length=0, labelright=False, labelleft=True)
ax_sets.spines["top"].set_visible(False)
ax_sets.spines["right"].set_visible(False)
ax_sets.spines["left"].set_visible(False)
ax_sets.spines["bottom"].set_color(INK_SOFT)
ax_sets.xaxis.grid(True, alpha=0.10, linewidth=0.8, color=INK)
ax_sets.set_axisbelow(True)

# ── Title ──────────────────────────────────────────────────────────────────────
fig.text(
    0.5,
    0.95,
    "upset-basic · matplotlib · anyplot.ai",
    ha="center",
    va="center",
    fontsize=22,
    fontweight="medium",
    color=INK,
)

plt.savefig(f"plot-{THEME}.png", dpi=300, bbox_inches="tight", facecolor=PAGE_BG)
Runnable source as JSON, for any HTTP client: https://api.anyplot.ai/specs/upset-basic/matplotlib/code. Any spec id and library id listed in llms-full.txt fit the same URL shape; every URL below is complete and callable.
{
  "spec_id": "upset-basic",
  "language": "python",
  "library": "matplotlib",
  "page": "https://anyplot.ai/upset-basic/python/matplotlib",
  "hub": "https://anyplot.ai/upset-basic",
  "code_json": "https://api.anyplot.ai/specs/upset-basic/matplotlib/code",
  "spec_json": "https://api.anyplot.ai/specs/upset-basic",
  "render_light_png": "https://storage.googleapis.com/anyplot-images/plots/upset-basic/python/matplotlib/plot-light.png",
  "render_dark_png": "https://storage.googleapis.com/anyplot-images/plots/upset-basic/python/matplotlib/plot-dark.png",
  "quality_score": 89.0,
  "license": "MIT",
  "guide": "https://anyplot.ai/llms.txt"
}
Part of UpSet Plot for Multi-Set Intersection Analysis on anyplot.ai.