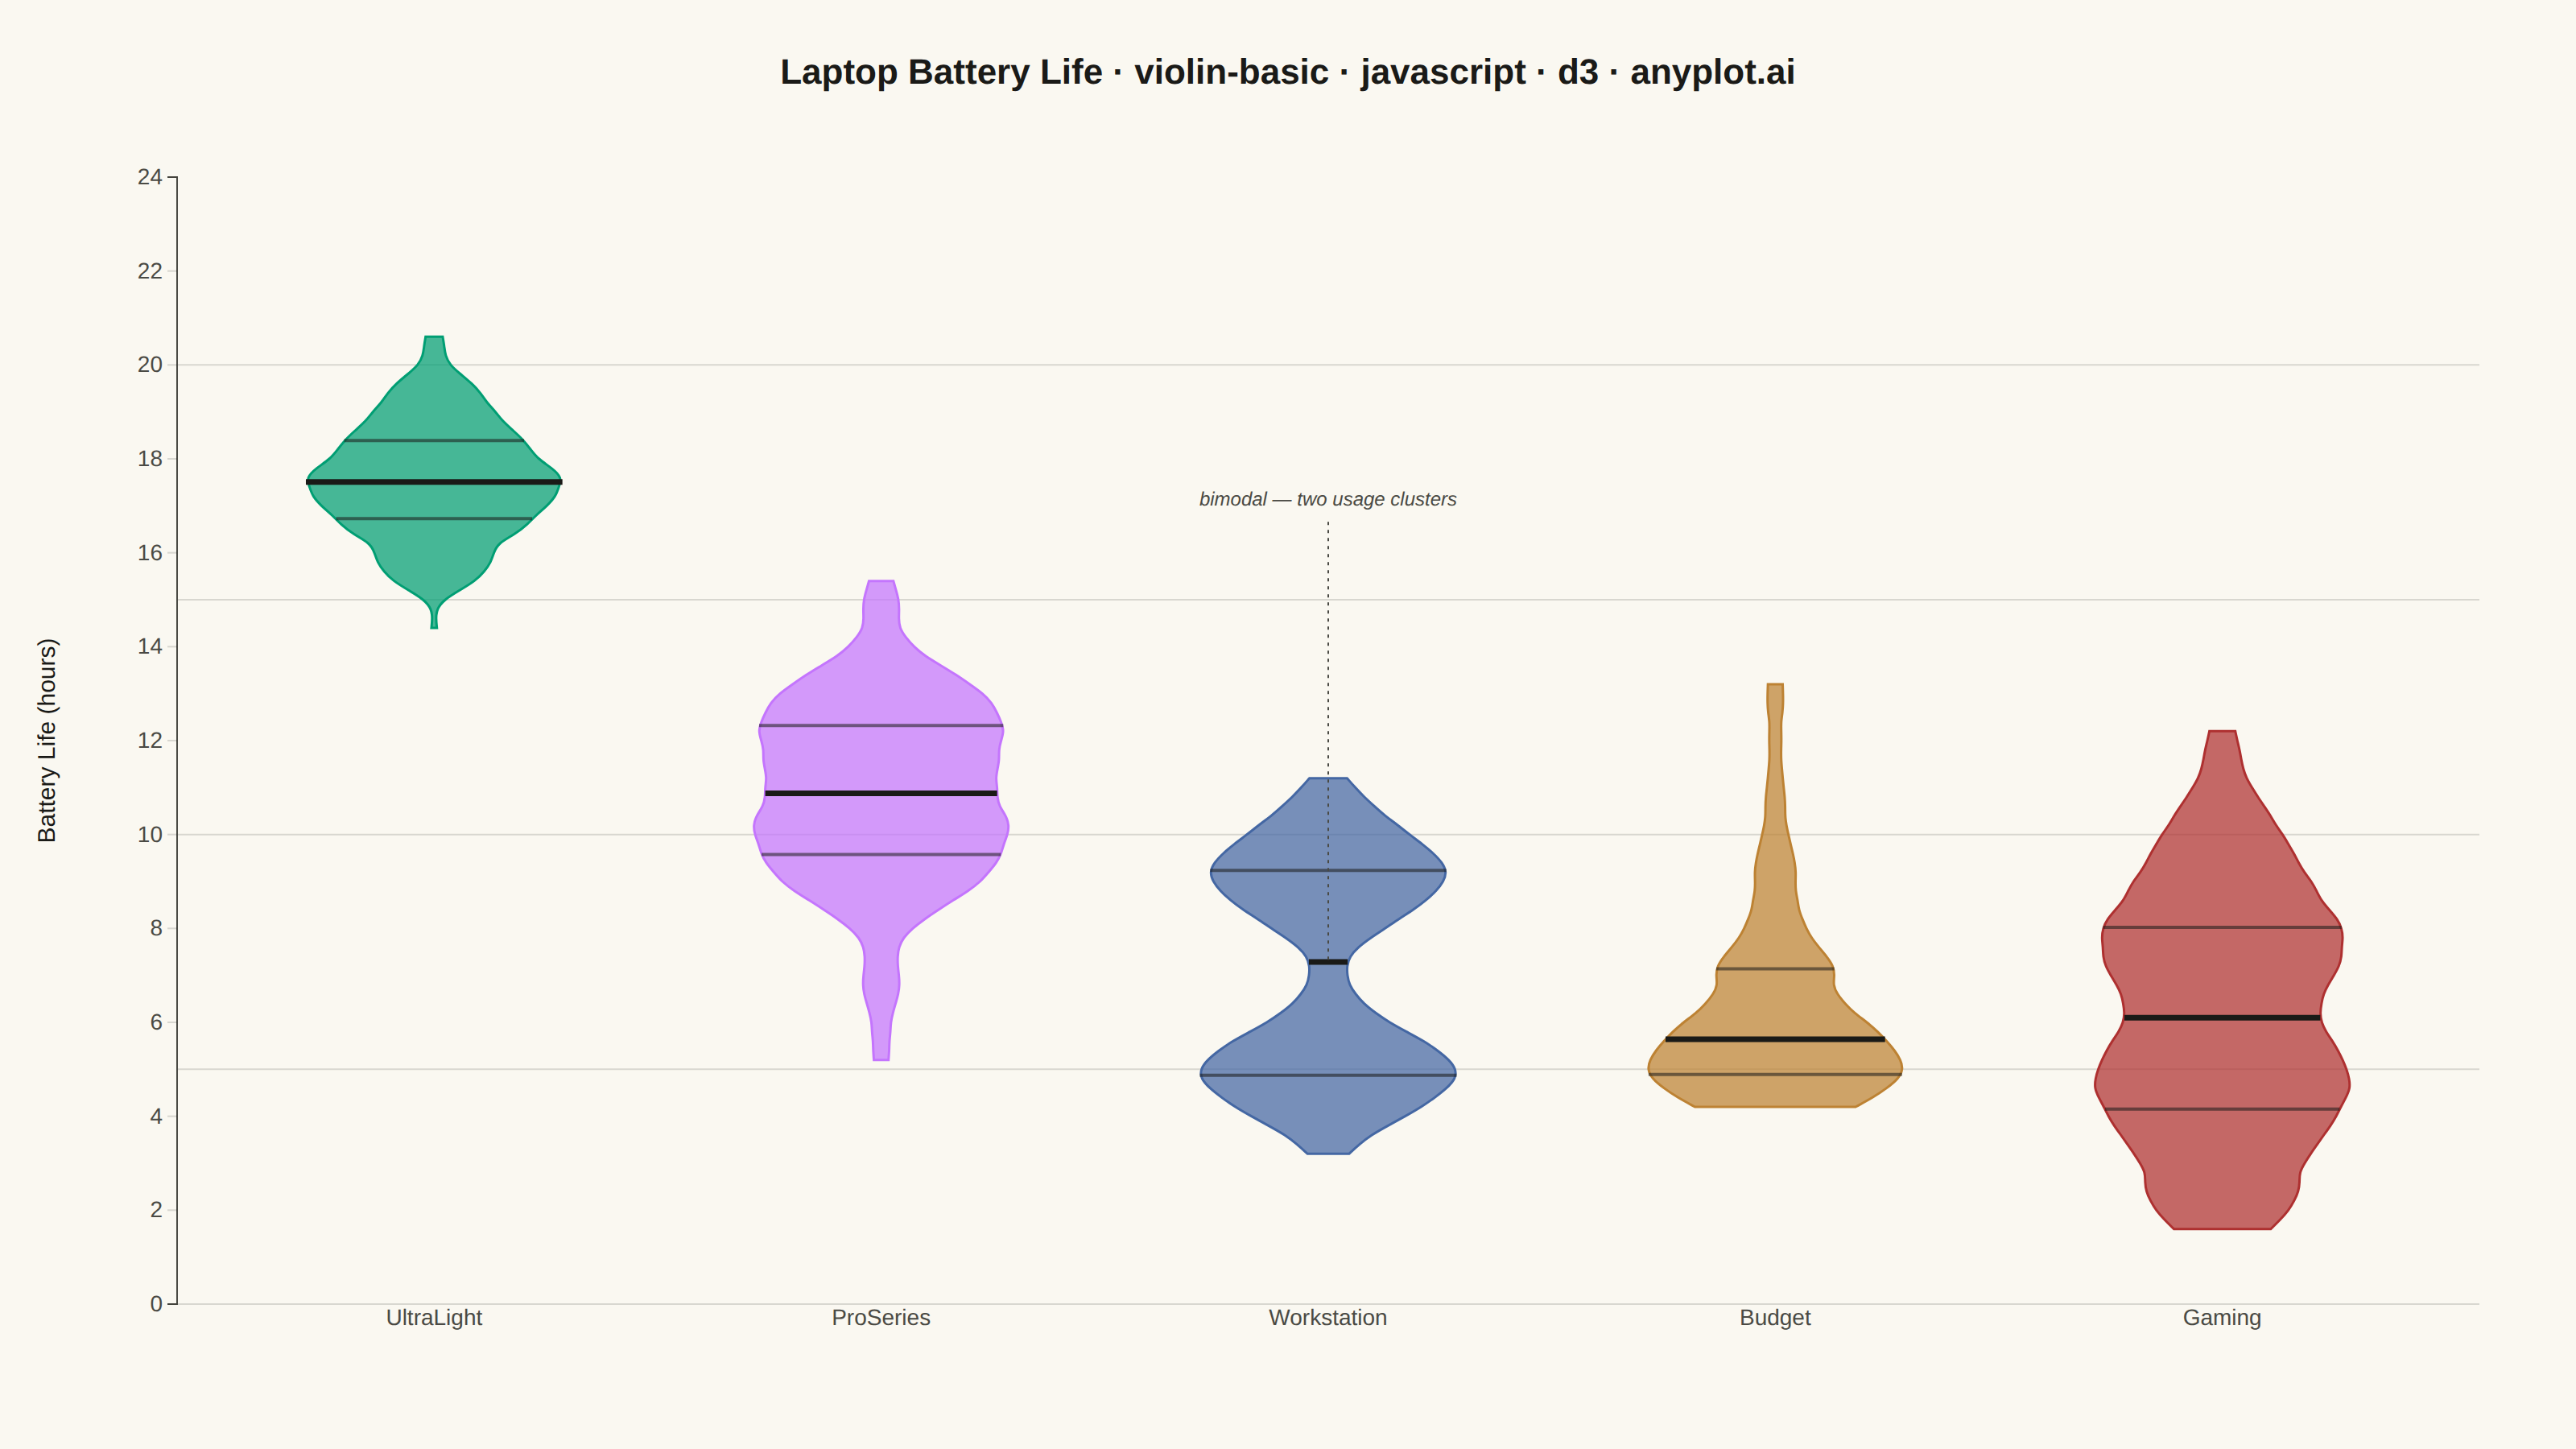
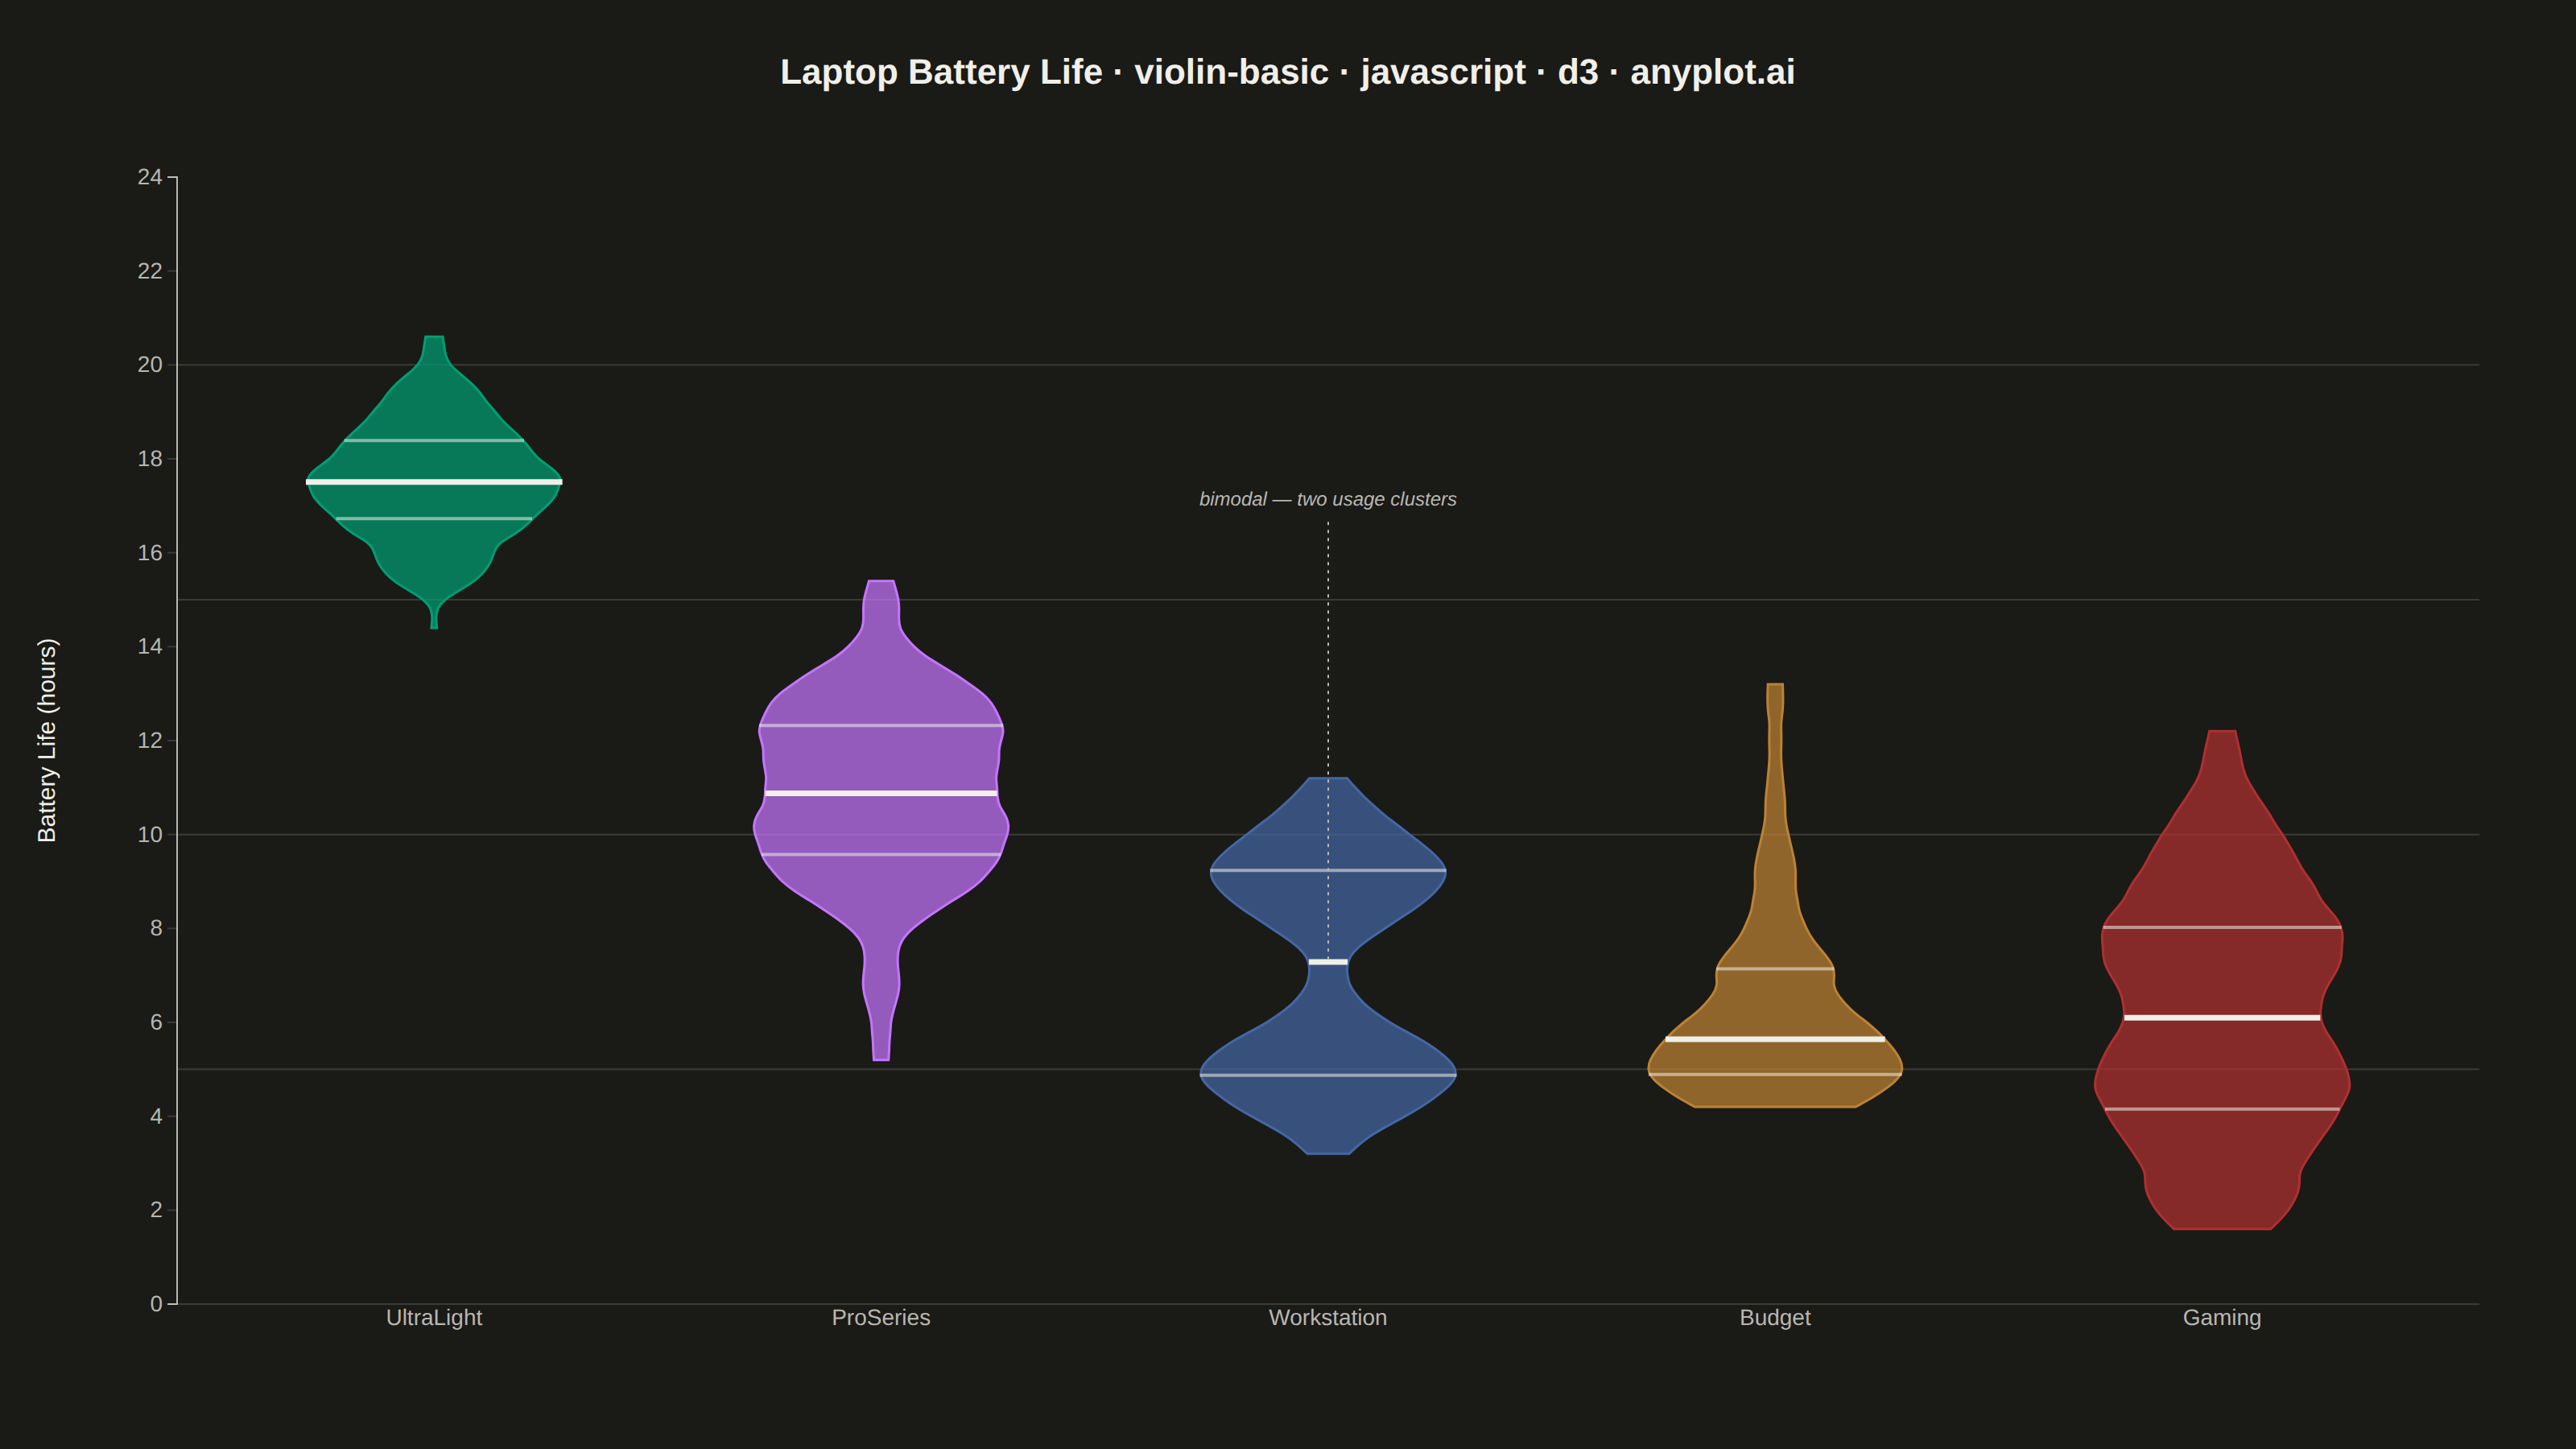
A violin plot combining a box plot with a kernel density estimation on each side, showing the distribution shape of numerical data. The width of the violin at each point represents the frequency of data values at that level. Excellent for comparing distributions across categories while revealing their underlying shape, providing more detail than a traditional box plot.
Preview render from the D3.js implementation.