The same plot in 14 other libraries — JavaScript: D3.js, Apache ECharts, Highcharts, MUI X Charts; Python: Altair, Bokeh, lets-plot, Matplotlib, Plotly, plotnine, Pygal, Seaborn; R: ggplot2; Julia: Makie.jl. Compare all 15 side by side: Basic Violin Plot in Python, R, Julia and JavaScript.
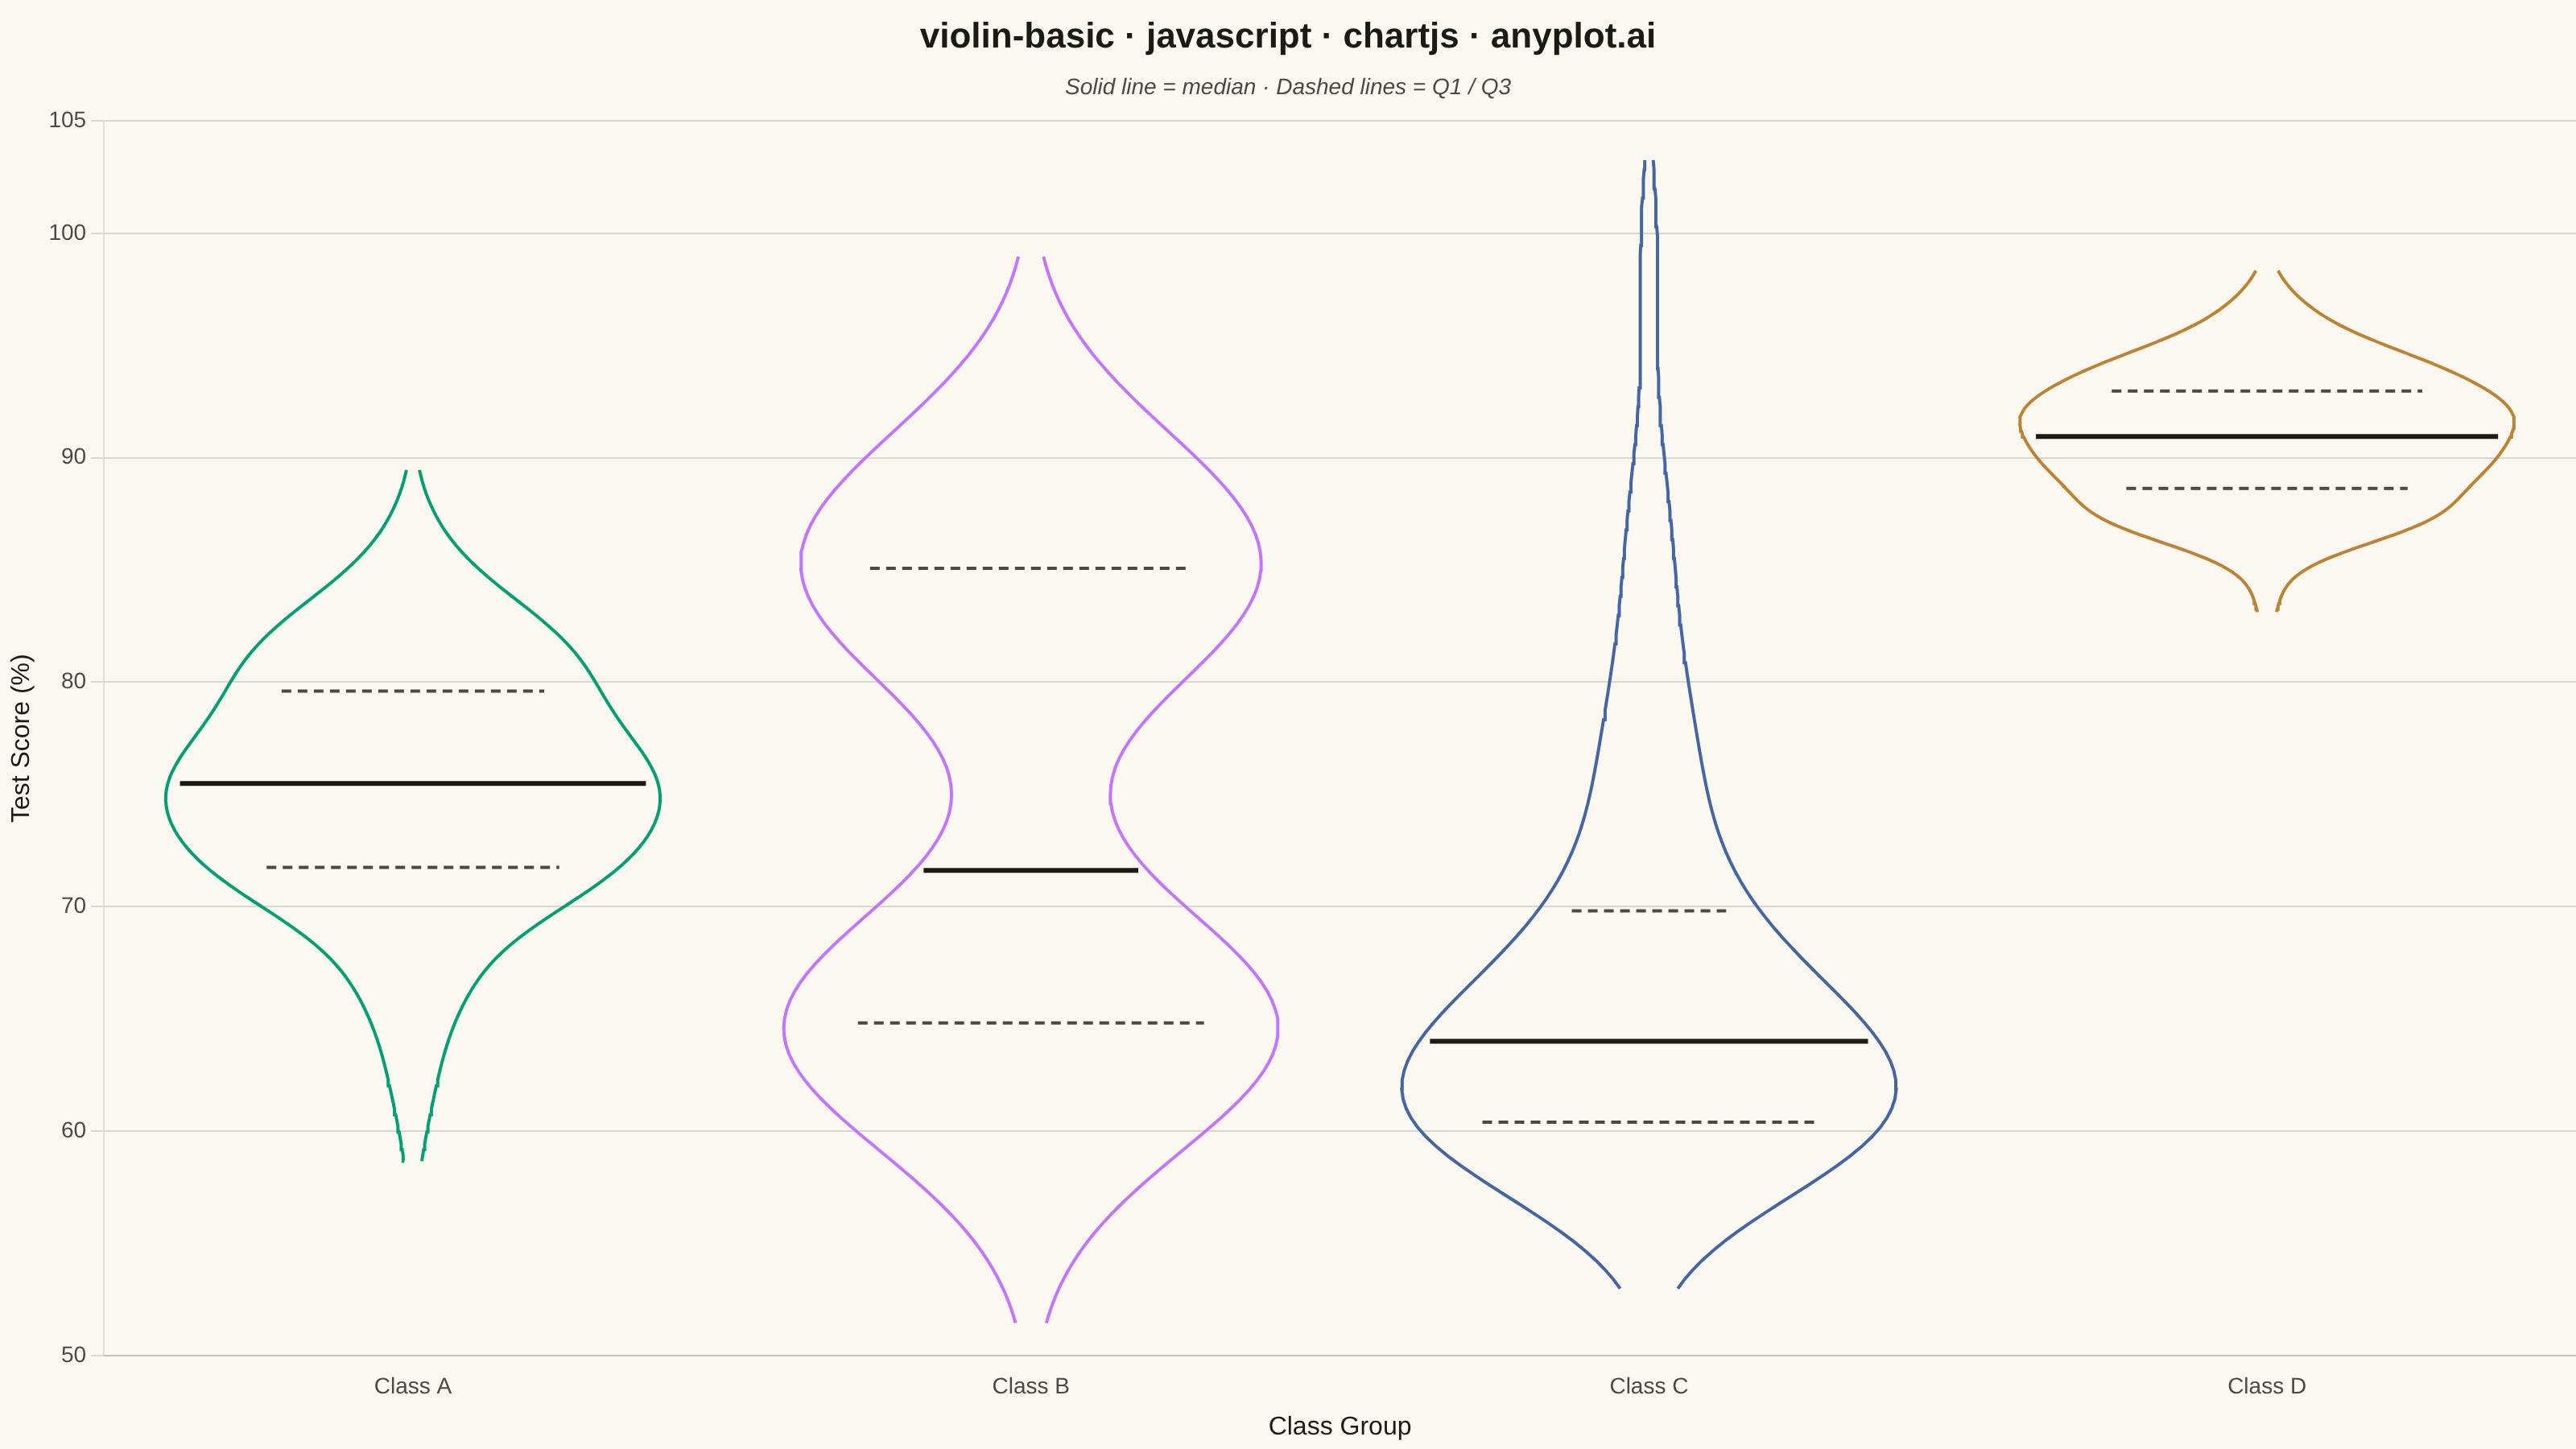
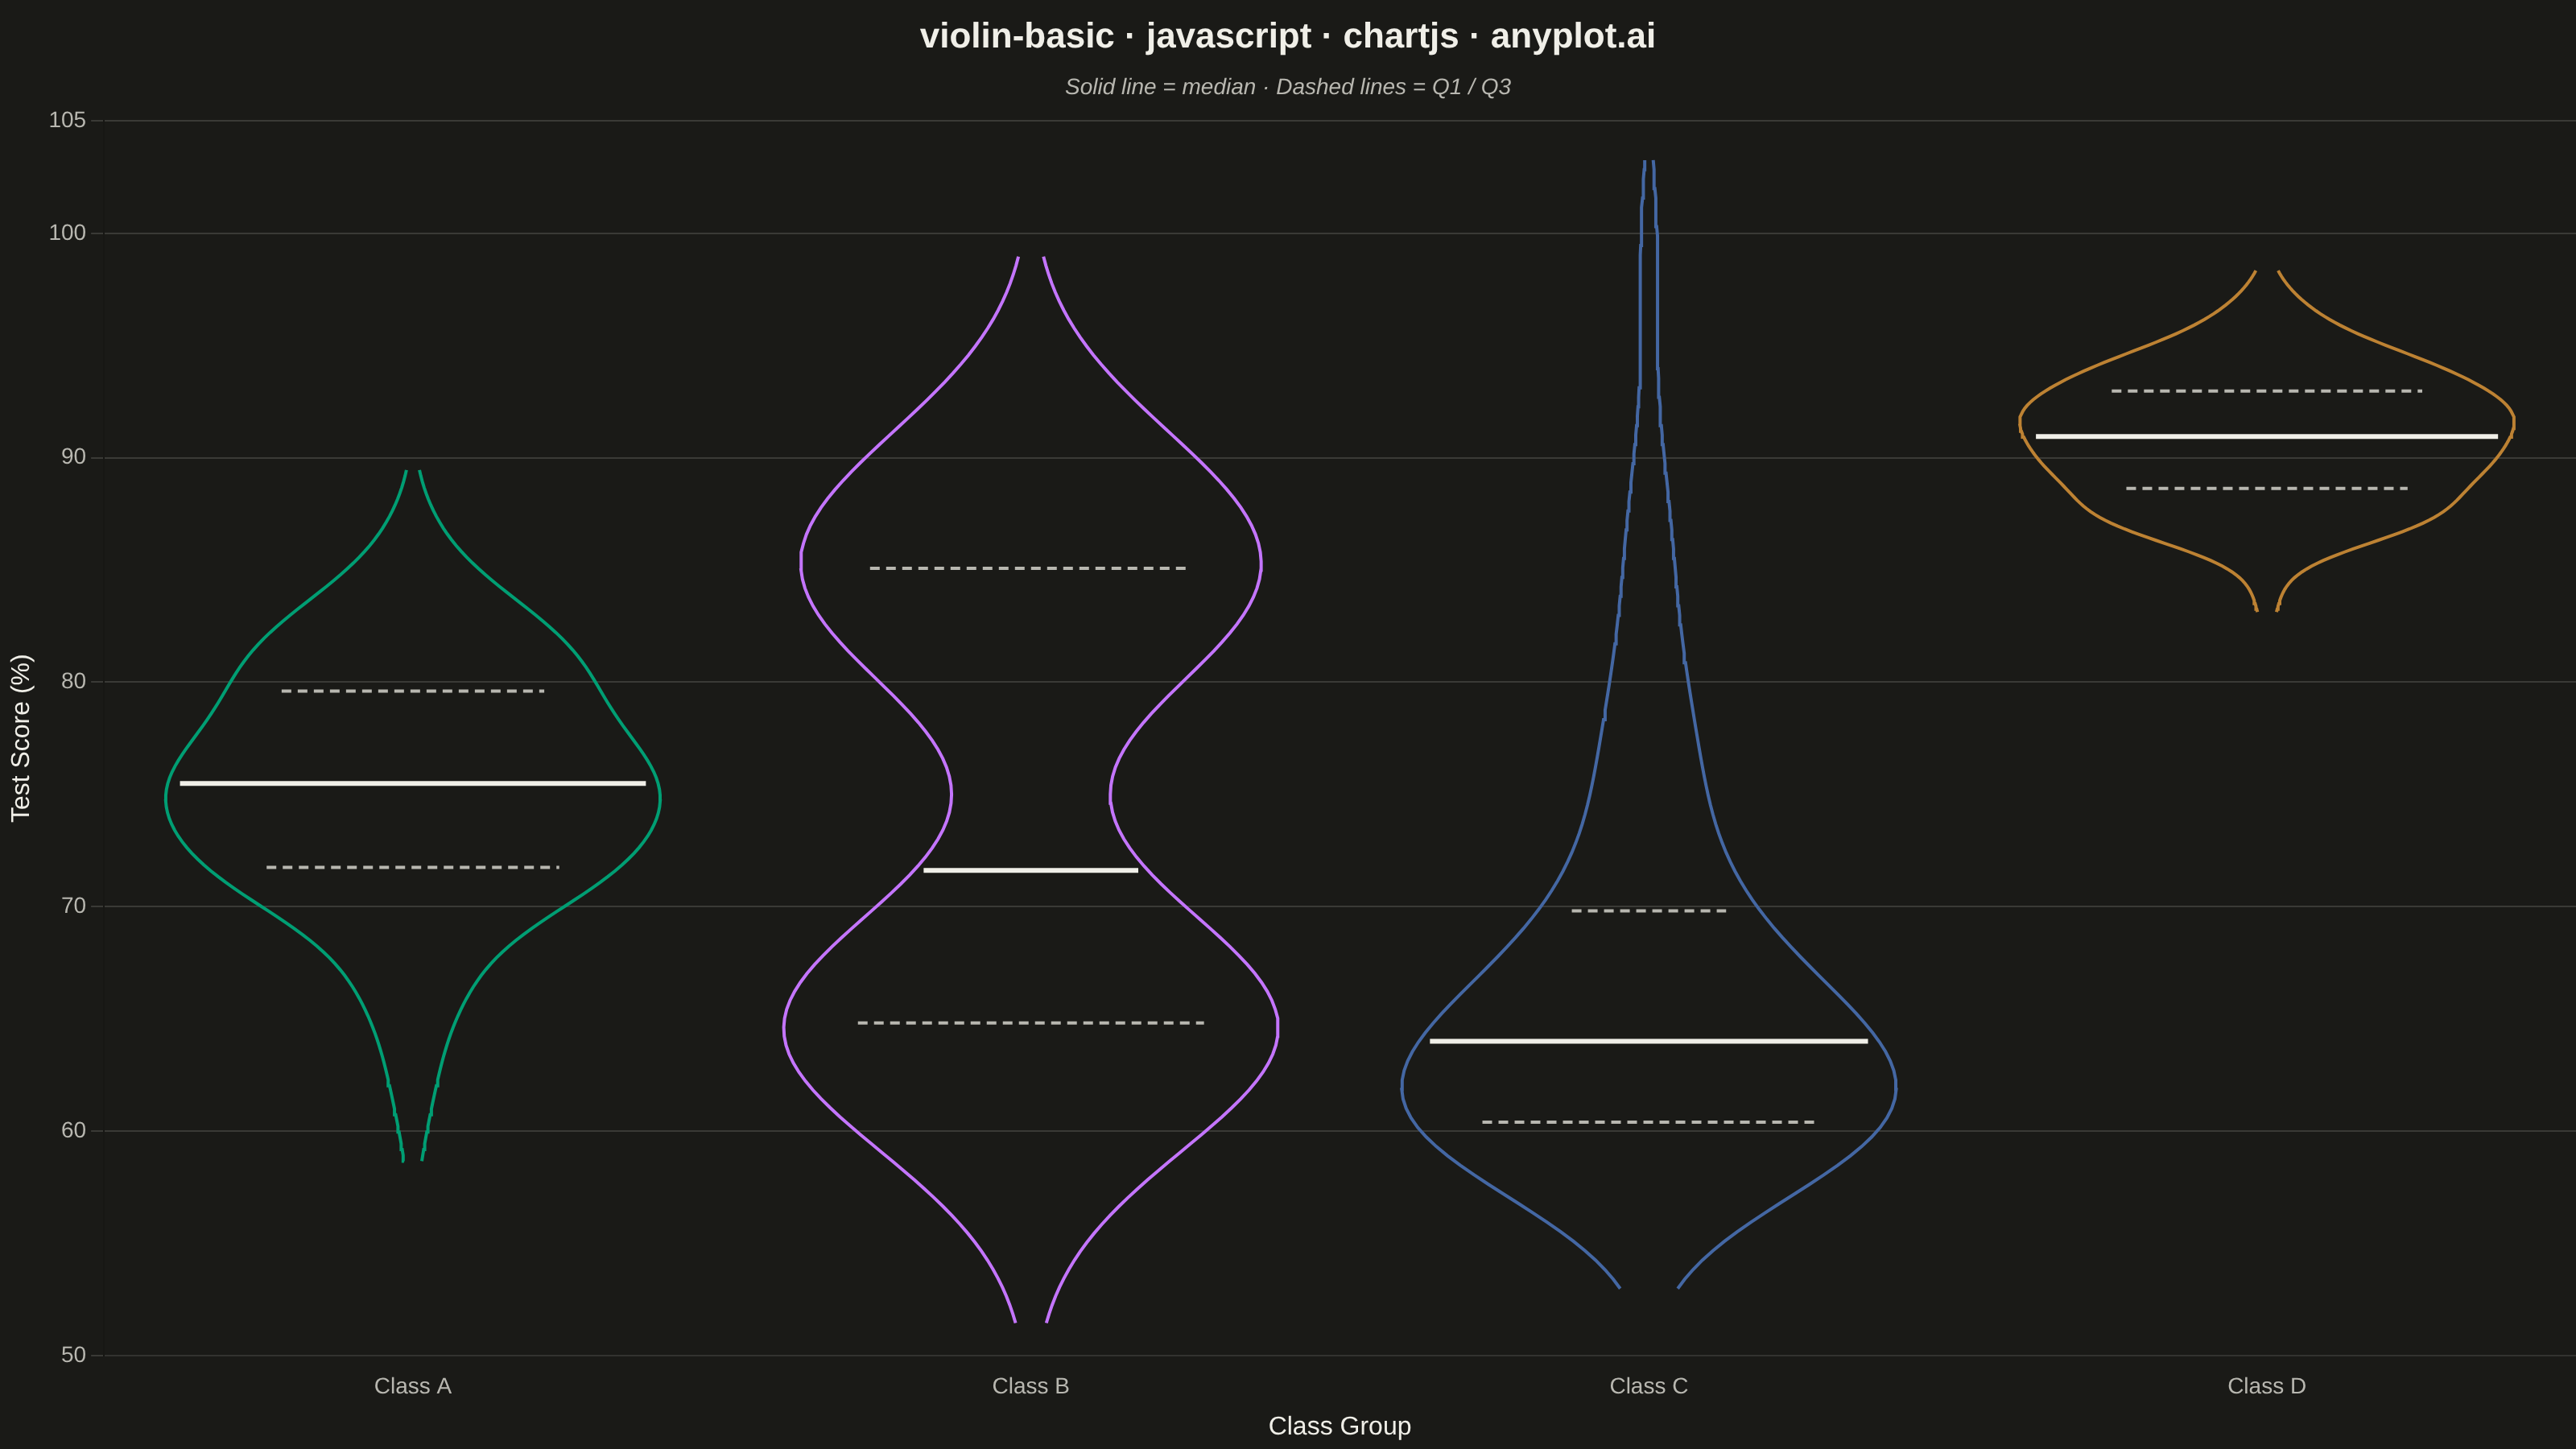
A violin plot combining a box plot with a kernel density estimation on each side, showing the distribution shape of numerical data. The width of the violin at each point represents the frequency of data values at that level. Excellent for comparing distributions across categories while revealing their underlying shape, providing more detail than a traditional box plot.
// anyplot.ai
// violin-basic: Basic Violin Plot
// Library: chartjs 4.4.7 | JavaScript 22.23.2
// Quality: 86/100 | Created: 2026-08-26

const t = window.ANYPLOT_TOKENS;

// --- Deterministic PRNG (LCG) + samplers ------------------------------------
function makeLcg(seed) {
  let state = seed >>> 0;
  return function next() {
    state = (Math.imul(1664525, state) + 1013904223) >>> 0;
    return state / 4294967296;
  };
}

function randNormal(rng, mean, std) {
  const u1 = Math.max(rng(), 1e-9);
  const u2 = rng();
  const z = Math.sqrt(-2 * Math.log(u1)) * Math.cos(2 * Math.PI * u2);
  return mean + z * std;
}

function randExponential(rng, rate) {
  return -Math.log(1 - rng()) / rate;
}

function clamp(value, min, max) {
  return Math.min(max, Math.max(min, value));
}

// --- Data: test scores across 4 class groups, each a distinct shape --------
const rng = makeLcg(42);
const sampleSize = 150;

function sampleClass(generator) {
  return Array.from({ length: sampleSize }, generator).map((v) => clamp(v, 50, 100));
}

const classGroups = [
  { name: "Class A", values: sampleClass(() => randNormal(rng, 75, 6)) },
  {
    name: "Class B",
    values: sampleClass(() => (rng() < 0.5 ? randNormal(rng, 64, 4) : randNormal(rng, 86, 4))),
  },
  { name: "Class C", values: sampleClass(() => 58 + randExponential(rng, 1 / 9)) },
  { name: "Class D", values: sampleClass(() => randNormal(rng, 91, 3)) },
];

// --- Kernel density estimation (Silverman bandwidth, Gaussian kernel) -------
function mean(values) {
  return values.reduce((sum, v) => sum + v, 0) / values.length;
}

function std(values) {
  const m = mean(values);
  const variance = values.reduce((sum, v) => sum + (v - m) ** 2, 0) / (values.length - 1);
  return Math.sqrt(variance);
}

function silvermanBandwidth(values) {
  return 1.06 * std(values) * values.length ** (-1 / 5);
}

function gaussianKde(values, evalPoints, bandwidth) {
  const norm = 1 / (values.length * bandwidth * Math.sqrt(2 * Math.PI));
  return evalPoints.map((point) => {
    let sum = 0;
    for (const v of values) {
      const u = (point - v) / bandwidth;
      sum += Math.exp(-0.5 * u * u);
    }
    return sum * norm;
  });
}

function quantile(sortedValues, q) {
  const idx = q * (sortedValues.length - 1);
  const lower = Math.floor(idx);
  const upper = Math.ceil(idx);
  if (lower === upper) return sortedValues[lower];
  return sortedValues[lower] + (sortedValues[upper] - sortedValues[lower]) * (idx - lower);
}

// --- Build a mirrored density silhouette (the "violin") per category -------
const gridSize = 120;
const maxHalfWidth = 0.4; // categories are spaced 1 unit apart on the x-axis

const violins = classGroups.map((group, i) => {
  const catX = i + 1;
  const sorted = [...group.values].sort((a, b) => a - b);
  const bandwidth = silvermanBandwidth(sorted);
  // Pad around the 1st/99th percentile (not the raw min/max) so a single
  // far-outlier tail (e.g. Class C's right-skew) can't stretch the shared
  // y-axis; the KDE still tapers smoothly toward the trimmed edges.
  const pad = bandwidth * 1.5;
  const yMin = quantile(sorted, 0.01) - pad;
  const yMax = quantile(sorted, 0.99) + pad;
  const step = (yMax - yMin) / (gridSize - 1);
  const evalPoints = Array.from({ length: gridSize }, (_, j) => yMin + j * step);
  const density = gaussianKde(sorted, evalPoints, bandwidth);
  const scale = maxHalfWidth / Math.max(...density);

  const widthAt = (y) => density[clamp(Math.round((y - yMin) / step), 0, gridSize - 1)] * scale;

  return {
    catX,
    yMin,
    yMax,
    left: evalPoints.map((y, j) => ({ x: catX - density[j] * scale, y })),
    right: evalPoints.map((y, j) => ({ x: catX + density[j] * scale, y })),
    q1: quantile(sorted, 0.25),
    median: quantile(sorted, 0.5),
    q3: quantile(sorted, 0.75),
    widthAt,
  };
});

// --- Mount -------------------------------------------------------------------
const canvas = document.createElement("canvas");
document.getElementById("container").appendChild(canvas);

function hexToRgba(hex, alpha) {
  const r = parseInt(hex.slice(1, 3), 16);
  const g = parseInt(hex.slice(3, 5), 16);
  const b = parseInt(hex.slice(5, 7), 16);
  return `rgba(${r}, ${g}, ${b}, ${alpha})`;
}

// --- Datasets: mirrored fill areas first, quartile/median markers on top ---
const datasets = [];

violins.forEach((violin, i) => {
  const color = t.palette[i % t.palette.length];
  const leftIdx = datasets.length;
  datasets.push({
    data: violin.left,
    borderColor: color,
    borderWidth: 2,
    pointRadius: 0,
    fill: false,
    tension: 0,
  });
  datasets.push({
    data: violin.right,
    borderColor: color,
    backgroundColor: hexToRgba(color, 0.35),
    borderWidth: 2,
    pointRadius: 0,
    fill: leftIdx,
    tension: 0,
  });
});

violins.forEach((violin) => {
  const q1Span = violin.widthAt(violin.q1) * 0.7;
  const q3Span = violin.widthAt(violin.q3) * 0.7;
  const medianSpan = violin.widthAt(violin.median) * 0.95;

  [
    { y: violin.q1, span: q1Span, color: t.inkSoft, width: 2, dash: [6, 4] },
    { y: violin.q3, span: q3Span, color: t.inkSoft, width: 2, dash: [6, 4] },
    { y: violin.median, span: medianSpan, color: t.ink, width: 3, dash: [] },
  ].forEach((marker) => {
    datasets.push({
      data: [
        { x: violin.catX - marker.span, y: marker.y },
        { x: violin.catX + marker.span, y: marker.y },
      ],
      borderColor: marker.color,
      borderWidth: marker.width,
      borderDash: marker.dash,
      pointRadius: 0,
      fill: false,
      tension: 0,
    });
  });
});

// Round to clean tick bounds based on the actual (clamped) data range, not
// the padded KDE eval range — keeps a single skewed group's tail from
// dictating the shared axis extent (see per-group padding above).
const rawValues = classGroups.flatMap((group) => group.values);
const rawMin = Math.min(...rawValues);
const rawMax = Math.max(...rawValues);
const axisPad = (rawMax - rawMin) * 0.08;
const yAxisMin = Math.floor((rawMin - axisPad) / 5) * 5;
const yAxisMax = Math.ceil((rawMax + axisPad) / 5) * 5;

// --- Chart -------------------------------------------------------------------
new Chart(canvas, {
  type: "line",
  data: { datasets },
  options: {
    responsive: true,
    maintainAspectRatio: false,
    animation: false,
    plugins: {
      title: {
        display: true,
        text: "violin-basic · javascript · chartjs · anyplot.ai",
        color: t.ink,
        font: { size: 22 },
      },
      subtitle: {
        display: true,
        text: "Solid line = median · Dashed lines = Q1 / Q3",
        color: t.inkSoft,
        font: { size: 14, style: "italic" },
        padding: { bottom: 12 },
      },
      legend: { display: false },
    },
    scales: {
      x: {
        type: "linear",
        min: 0.5,
        max: classGroups.length + 0.5,
        afterBuildTicks: (axis) => {
          axis.ticks = classGroups.map((_, i) => ({ value: i + 1 }));
        },
        ticks: {
          color: t.inkSoft,
          font: { size: 14 },
          callback: (value) => classGroups[Math.round(value) - 1]?.name ?? "",
        },
        grid: { display: false },
        title: { display: true, text: "Class Group", color: t.ink, font: { size: 16 } },
      },
      y: {
        min: yAxisMin,
        max: yAxisMax,
        ticks: { color: t.inkSoft, font: { size: 14 } },
        grid: { color: t.grid },
        title: { display: true, text: "Test Score (%)", color: t.ink, font: { size: 16 } },
      },
    },
  },
});
Runnable source as JSON, for any HTTP client: https://api.anyplot.ai/specs/violin-basic/chartjs/code. Any spec id and library id listed in llms-full.txt fit the same URL shape; every URL below is complete and callable.
{
  "spec_id": "violin-basic",
  "language": "javascript",
  "library": "chartjs",
  "page": "https://anyplot.ai/violin-basic/javascript/chartjs",
  "hub": "https://anyplot.ai/violin-basic",
  "code_json": "https://api.anyplot.ai/specs/violin-basic/chartjs/code",
  "spec_json": "https://api.anyplot.ai/specs/violin-basic",
  "render_light_png": "https://storage.googleapis.com/anyplot-images/plots/violin-basic/javascript/chartjs/plot-light.png",
  "render_dark_png": "https://storage.googleapis.com/anyplot-images/plots/violin-basic/javascript/chartjs/plot-dark.png",
  "interactive_light_html": "https://storage.googleapis.com/anyplot-images/plots/violin-basic/javascript/chartjs/plot-light.html",
  "interactive_dark_html": "https://storage.googleapis.com/anyplot-images/plots/violin-basic/javascript/chartjs/plot-dark.html",
  "quality_score": 86.0,
  "license": "MIT",
  "guide": "https://anyplot.ai/llms.txt"
}
Part of Basic Violin Plot on anyplot.ai.