The same plot in 14 other libraries — JavaScript: Chart.js, D3.js, Apache ECharts, Highcharts; Python: Altair, Bokeh, lets-plot, Matplotlib, Plotly, plotnine, Pygal, Seaborn; R: ggplot2; Julia: Makie.jl. Compare all 15 side by side: Basic Violin Plot in Python, R, Julia and JavaScript.
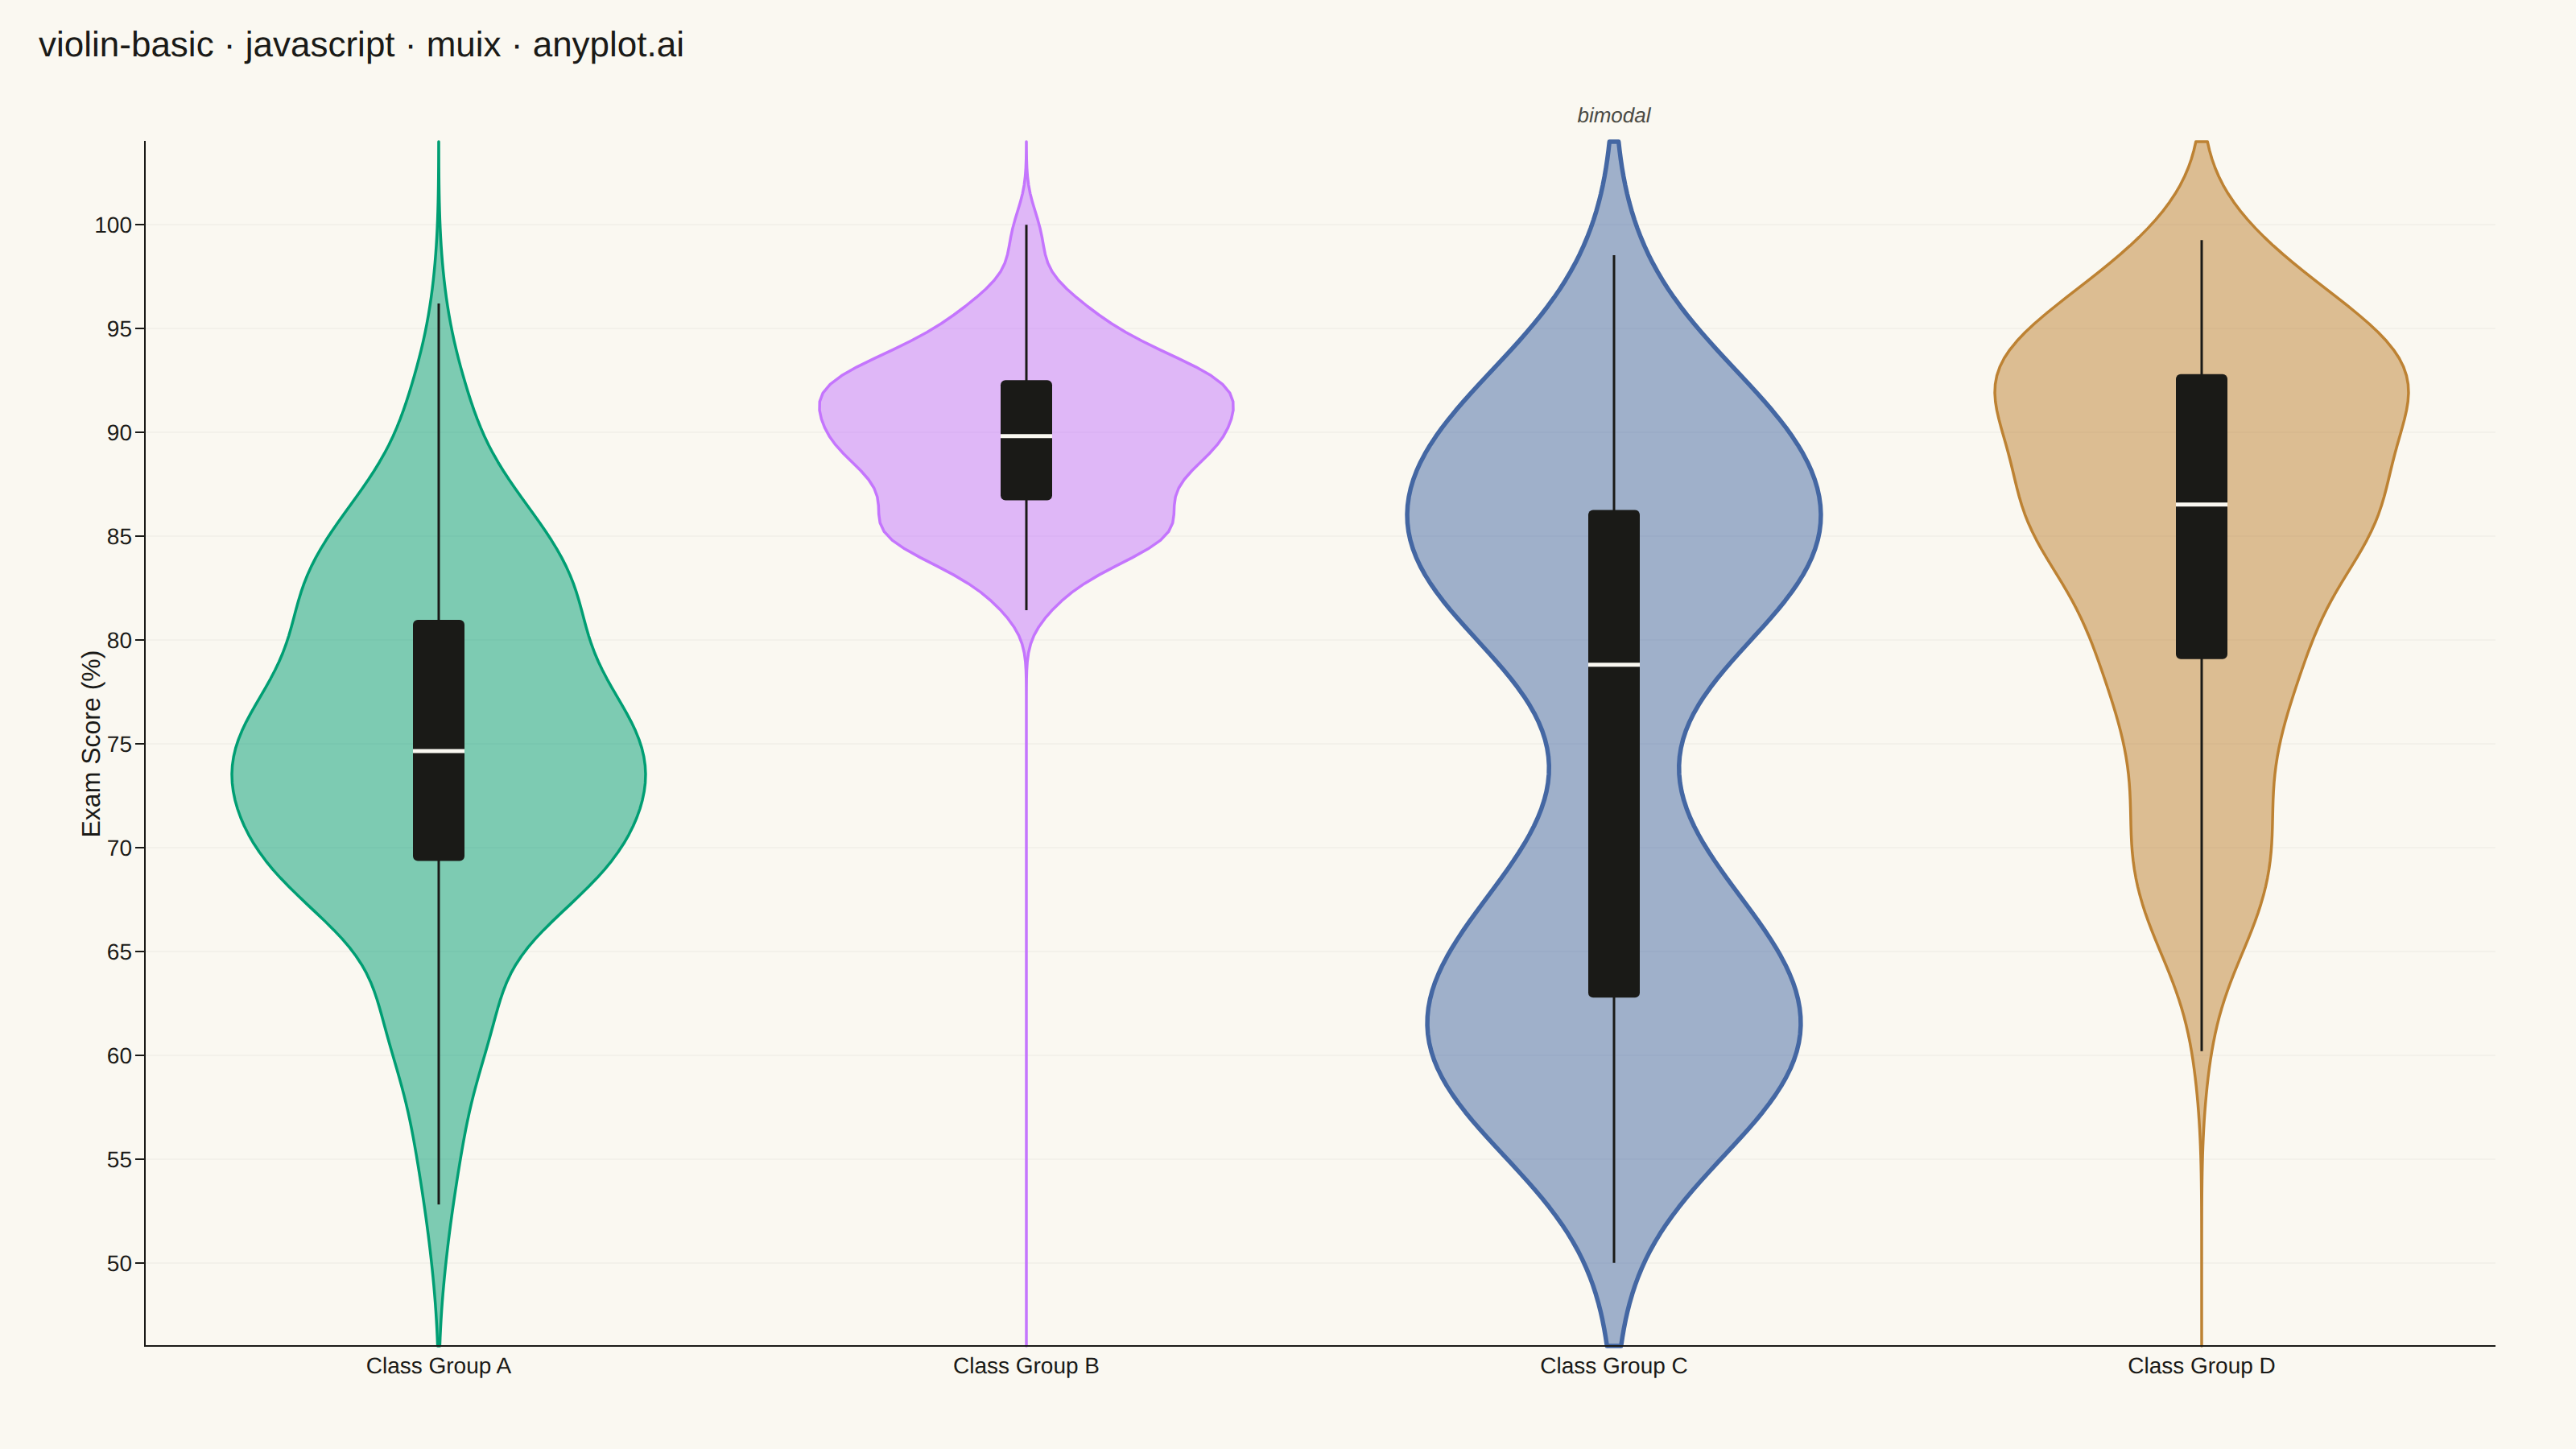
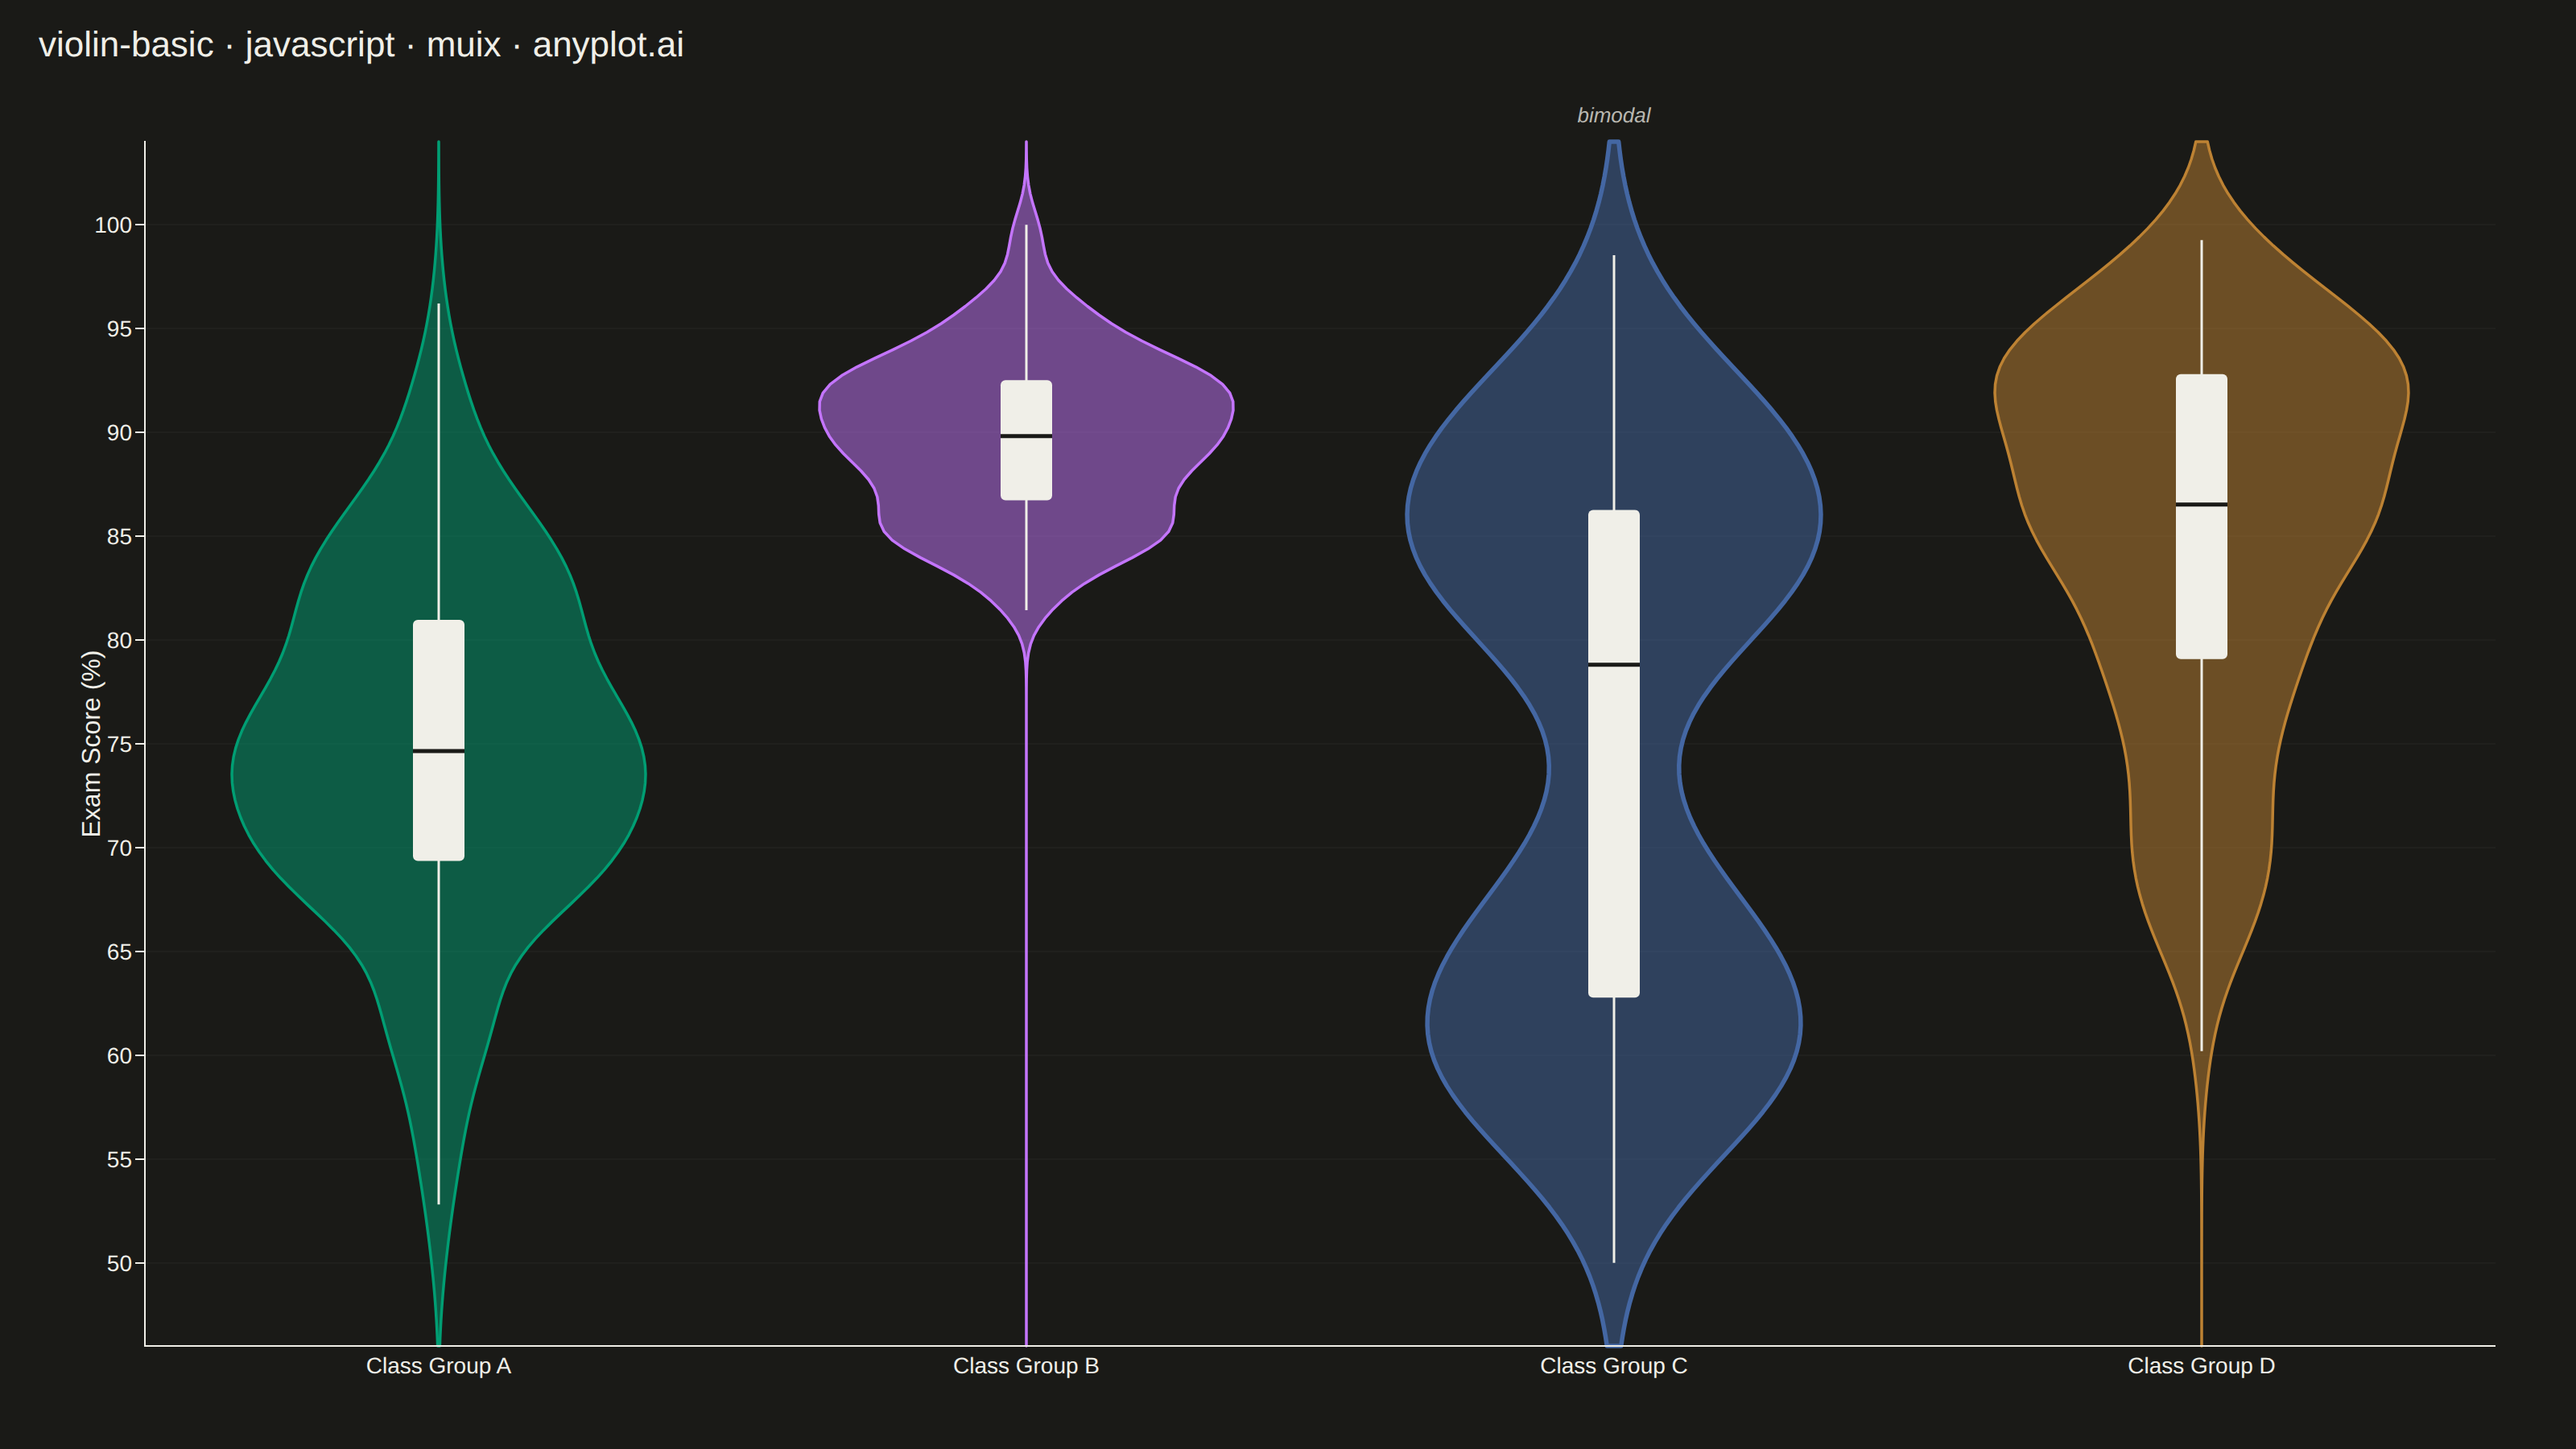
A violin plot combining a box plot with a kernel density estimation on each side, showing the distribution shape of numerical data. The width of the violin at each point represents the frequency of data values at that level. Excellent for comparing distributions across categories while revealing their underlying shape, providing more detail than a traditional box plot.
// anyplot.ai
// violin-basic: Basic Violin Plot
// Library: muix 7.29.1 | JavaScript 22.23.2
// Quality: 88/100 | Created: 2026-08-26
import { ChartContainer } from "@mui/x-charts/ChartContainer";
import { ChartsGrid } from "@mui/x-charts/ChartsGrid";
import { ChartsXAxis } from "@mui/x-charts/ChartsXAxis";
import { ChartsYAxis } from "@mui/x-charts/ChartsYAxis";
import { useXScale, useYScale } from "@mui/x-charts/hooks";

const t = window.ANYPLOT_TOKENS;
const TITLE = "violin-basic · javascript · muix · anyplot.ai";
const TITLE_HEIGHT = 56;

// --- Data (in-memory, deterministic LCG — no seeded RNG in the browser) -----
function lcg(seed) {
  let state = seed;
  return () => {
    state = (state * 1664525 + 1013904223) % 4294967296;
    return state / 4294967296;
  };
}

function randomNormal(rand, mean, stdDev) {
  const u1 = Math.max(rand(), 1e-9);
  const u2 = rand();
  const z = Math.sqrt(-2 * Math.log(u1)) * Math.cos(2 * Math.PI * u2);
  return mean + z * stdDev;
}

function clamp(v, lo, hi) {
  return Math.min(hi, Math.max(lo, v));
}

const rand = lcg(42);

// Exam scores (0-100) across 4 class groups, each shaped differently so the
// KDE — not just the summary stats — carries information a plain box plot
// would hide.
const N_PER_GROUP = 220;
const groups = [
  {
    name: "Class Group A",
    // Typical unimodal spread.
    sample: () => clamp(randomNormal(rand, 74, 9), 50, 100),
  },
  {
    name: "Class Group B",
    // High-achieving and consistent — narrow peak near the top.
    sample: () => clamp(randomNormal(rand, 90, 4), 50, 100),
  },
  {
    name: "Class Group C",
    // Bimodal: a struggling cluster and a thriving cluster — the shape a
    // plain box plot would flatten into a single, misleading median.
    sample: () => clamp(rand() < 0.45 ? randomNormal(rand, 62, 5) : randomNormal(rand, 87, 5), 50, 100),
    note: "bimodal",
  },
  {
    name: "Class Group D",
    // Right-skewed: most students cluster high, with a long low tail.
    sample: () => clamp(94 - 30 * Math.pow(rand(), 2.4) + 3 * randomNormal(rand, 0, 1), 50, 100),
  },
];
const categories = groups.map((g) => g.name);
const valuesByCategory = groups.map((g) => Array.from({ length: N_PER_GROUP }, g.sample));

const allValues = valuesByCategory.flat();
const dataMin = Math.min(...allValues);
const dataMax = Math.max(...allValues);
const yPad = (dataMax - dataMin) * 0.08;
const Y_MIN = dataMin - yPad;
const Y_MAX = dataMax + yPad;

// --- Quartile stats (Tukey whiskers, 1.5×IQR) --------------------------------
function quantile(sorted, q) {
  const pos = (sorted.length - 1) * q;
  const base = Math.floor(pos);
  const rest = pos - base;
  return base + 1 < sorted.length ? sorted[base] + rest * (sorted[base + 1] - sorted[base]) : sorted[base];
}
function boxStats(values) {
  const sorted = [...values].sort((a, b) => a - b);
  const q1 = quantile(sorted, 0.25);
  const median = quantile(sorted, 0.5);
  const q3 = quantile(sorted, 0.75);
  const iqr = q3 - q1;
  const lowerFence = q1 - 1.5 * iqr;
  const upperFence = q3 + 1.5 * iqr;
  const inliers = sorted.filter((v) => v >= lowerFence && v <= upperFence);
  return {
    q1,
    median,
    q3,
    whiskerLow: inliers.length ? inliers[0] : q1,
    whiskerHigh: inliers.length ? inliers[inliers.length - 1] : q3,
  };
}
const statsByCategory = valuesByCategory.map(boxStats);

// --- Gaussian KDE per group, Silverman bandwidth, normalized to its own peak
// so each violin shows shape (including Class Group C's two humps), not n.
const GRID_N = 140;
const grid = Array.from({ length: GRID_N }, (_, k) => Y_MIN + (k * (Y_MAX - Y_MIN)) / (GRID_N - 1));
function stdOf(values) {
  const m = values.reduce((a, b) => a + b, 0) / values.length;
  const variance = values.reduce((a, b) => a + (b - m) ** 2, 0) / (values.length - 1);
  return Math.sqrt(variance);
}
function kde(values) {
  const n = values.length;
  const bandwidth = 0.9 * stdOf(values) * Math.pow(n, -0.2);
  const raw = grid.map((gy) => values.reduce((sum, v) => sum + Math.exp(-0.5 * ((gy - v) / bandwidth) ** 2), 0));
  const peak = Math.max(...raw);
  return raw.map((v) => v / peak);
}
const densityByCategory = valuesByCategory.map(kde);

// --- Mirrored violin (KDE on both sides) + inner quartile box --------------
// The community package (7.29.1) has no violin/box-plot component. A custom
// SVG layer positioned via the chart's own band/linear scale hooks reproduces
// one while staying entirely within the community ChartContainer surface —
// the documented "composition" technique for chart types MUI X doesn't ship.
function Violins() {
  const xScale = useXScale();
  const yScale = useYScale();
  const bandwidth = xScale.bandwidth();
  const violinHalfWidth = bandwidth * 0.44;
  const boxHalfWidth = Math.min(16, bandwidth * 0.09);

  return (
    <g>
      {categories.map((cat, i) => {
        const color = t.palette[i % t.palette.length];
        const center = xScale(cat) + bandwidth / 2;
        const density = densityByCategory[i];

        const leftSide = grid.map((gy, k) => `${center - density[k] * violinHalfWidth},${yScale(gy)}`);
        const rightSide = grid.map((gy, k) => `${center + density[k] * violinHalfWidth},${yScale(gy)}`).reverse();
        const violinPath = `M${leftSide.join(" L")} L${rightSide.join(" L")} Z`;

        const { q1, median, q3, whiskerLow, whiskerHigh } = statsByCategory[i];
        const isDistinctive = Boolean(groups[i].note);

        return (
          <g key={cat}>
            <path
              d={violinPath}
              fill={color}
              fillOpacity={0.5}
              stroke={color}
              strokeWidth={isDistinctive ? 2.75 : 1.75}
              strokeLinejoin="round"
            />
            {isDistinctive && (
              <text x={center} y={20} textAnchor="middle" fontSize={13} fontStyle="italic" fill={t.inkSoft}>
                {groups[i].note}
              </text>
            )}
            <line x1={center} x2={center} y1={yScale(whiskerLow)} y2={yScale(whiskerHigh)} stroke={t.ink} strokeWidth={1.5} />
            <rect
              x={center - boxHalfWidth}
              y={yScale(q3)}
              width={boxHalfWidth * 2}
              height={Math.max(1, yScale(q1) - yScale(q3))}
              fill={t.ink}
              rx={3}
            />
            <line
              x1={center - boxHalfWidth}
              x2={center + boxHalfWidth}
              y1={yScale(median)}
              y2={yScale(median)}
              stroke={t.pageBg}
              strokeWidth={2.5}
            />
          </g>
        );
      })}
    </g>
  );
}

export default function Chart() {
  const chartHeight = window.ANYPLOT_SIZE.height - TITLE_HEIGHT;

  return (
    <div style={{ width: window.ANYPLOT_SIZE.width, height: window.ANYPLOT_SIZE.height }}>
      <div
        style={{
          height: TITLE_HEIGHT,
          lineHeight: `${TITLE_HEIGHT}px`,
          paddingLeft: 24,
          fontSize: 22,
          fontWeight: 500,
          color: t.ink,
        }}
      >
        {TITLE}
      </div>
      <ChartContainer
        width={window.ANYPLOT_SIZE.width}
        height={chartHeight}
        series={[]}
        skipAnimation
        margin={{ top: 32, right: 50, bottom: 64, left: 90 }}
        xAxis={[
          {
            id: "groups",
            data: categories,
            scaleType: "band",
            tickLabelStyle: { fontSize: 14 },
          },
        ]}
        yAxis={[
          {
            id: "scores",
            min: Y_MIN,
            max: Y_MAX,
            label: "Exam Score (%)",
            labelStyle: { fontSize: 16 },
            tickLabelStyle: { fontSize: 14 },
          },
        ]}
      >
        <ChartsGrid
          horizontal
          sx={{
            "& .MuiChartsGrid-line": {
              stroke: t.grid,
              opacity: 0.2,
            },
          }}
        />
        <Violins />
        <ChartsXAxis axisId="groups" disableTicks />
        <ChartsYAxis axisId="scores" />
      </ChartContainer>
    </div>
  );
}
Runnable source as JSON, for any HTTP client: https://api.anyplot.ai/specs/violin-basic/muix/code. Any spec id and library id listed in llms-full.txt fit the same URL shape; every URL below is complete and callable.
{
  "spec_id": "violin-basic",
  "language": "javascript",
  "library": "muix",
  "page": "https://anyplot.ai/violin-basic/javascript/muix",
  "hub": "https://anyplot.ai/violin-basic",
  "code_json": "https://api.anyplot.ai/specs/violin-basic/muix/code",
  "spec_json": "https://api.anyplot.ai/specs/violin-basic",
  "render_light_png": "https://storage.googleapis.com/anyplot-images/plots/violin-basic/javascript/muix/plot-light.png",
  "render_dark_png": "https://storage.googleapis.com/anyplot-images/plots/violin-basic/javascript/muix/plot-dark.png",
  "interactive_light_html": "https://storage.googleapis.com/anyplot-images/plots/violin-basic/javascript/muix/plot-light.html",
  "interactive_dark_html": "https://storage.googleapis.com/anyplot-images/plots/violin-basic/javascript/muix/plot-dark.html",
  "quality_score": 88.0,
  "license": "MIT",
  "guide": "https://anyplot.ai/llms.txt"
}
Part of Basic Violin Plot on anyplot.ai.