The same plot in 14 other libraries — Python: Altair, Bokeh, lets-plot, Matplotlib, Plotly, plotnine, Pygal, Seaborn; R: ggplot2; JavaScript: Chart.js, D3.js, Apache ECharts, Highcharts, MUI X Charts. Compare all 15 side by side: Basic Violin Plot in Python, R, Julia and JavaScript.
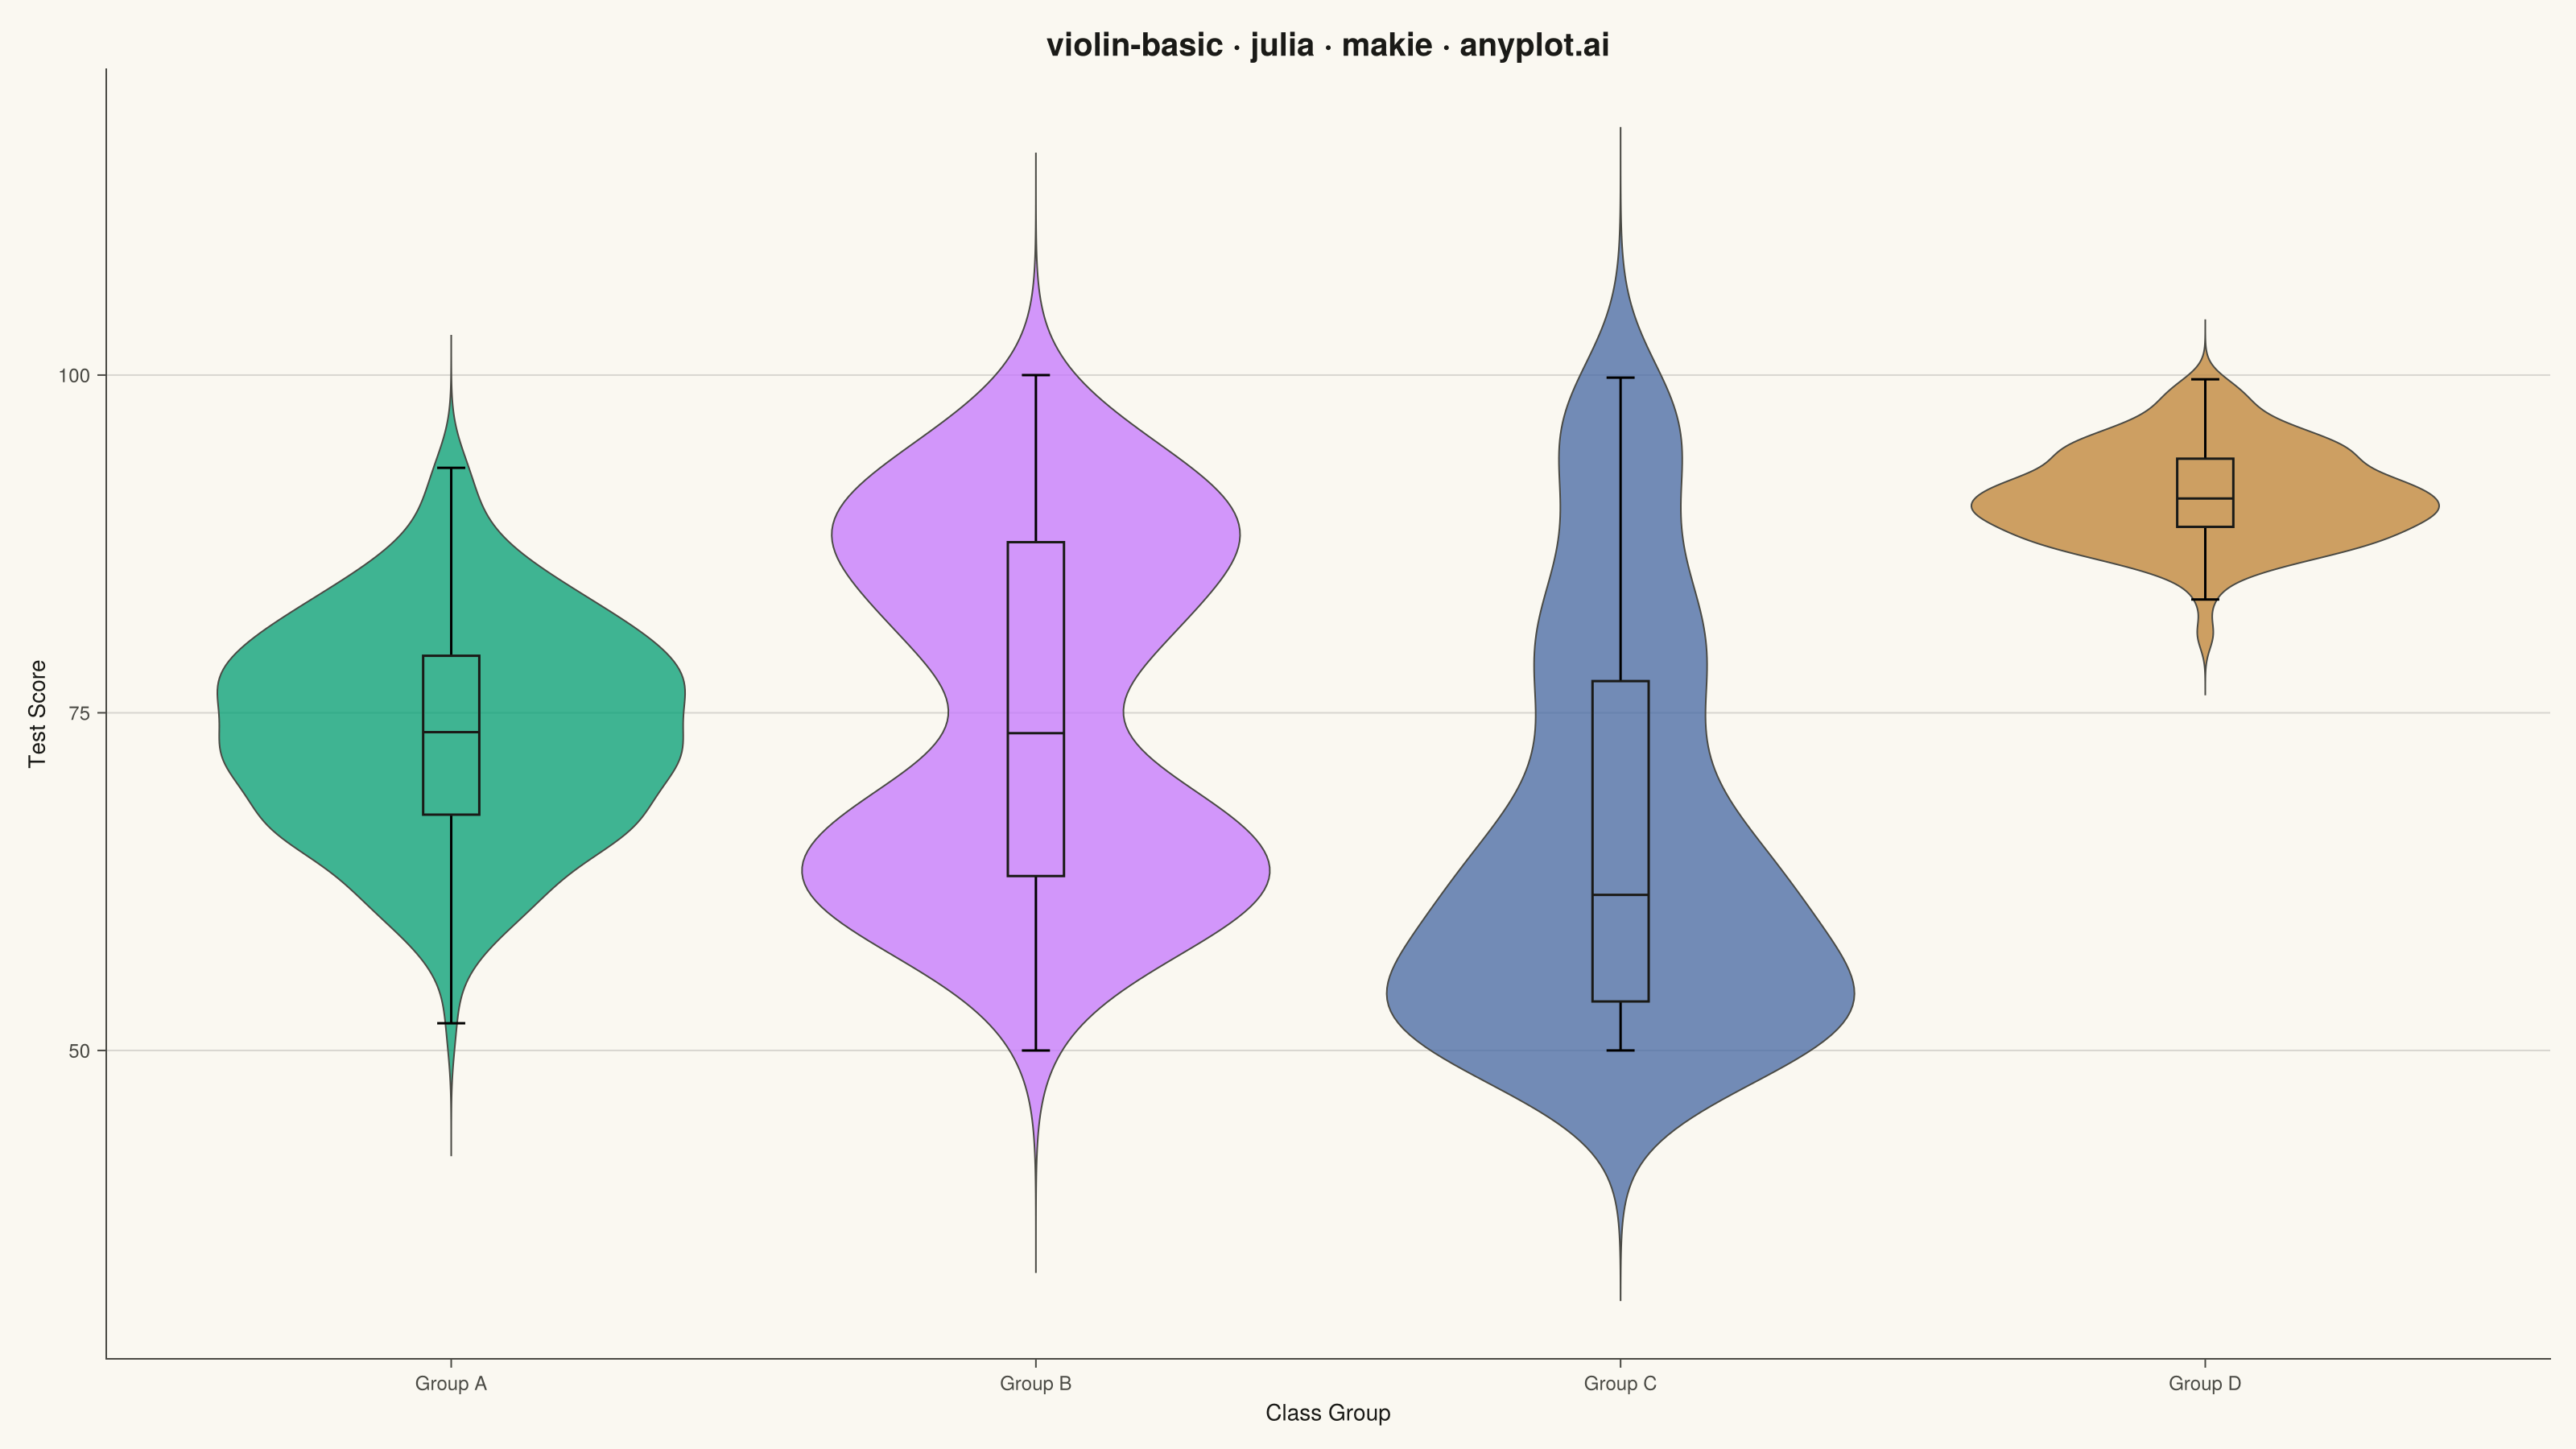
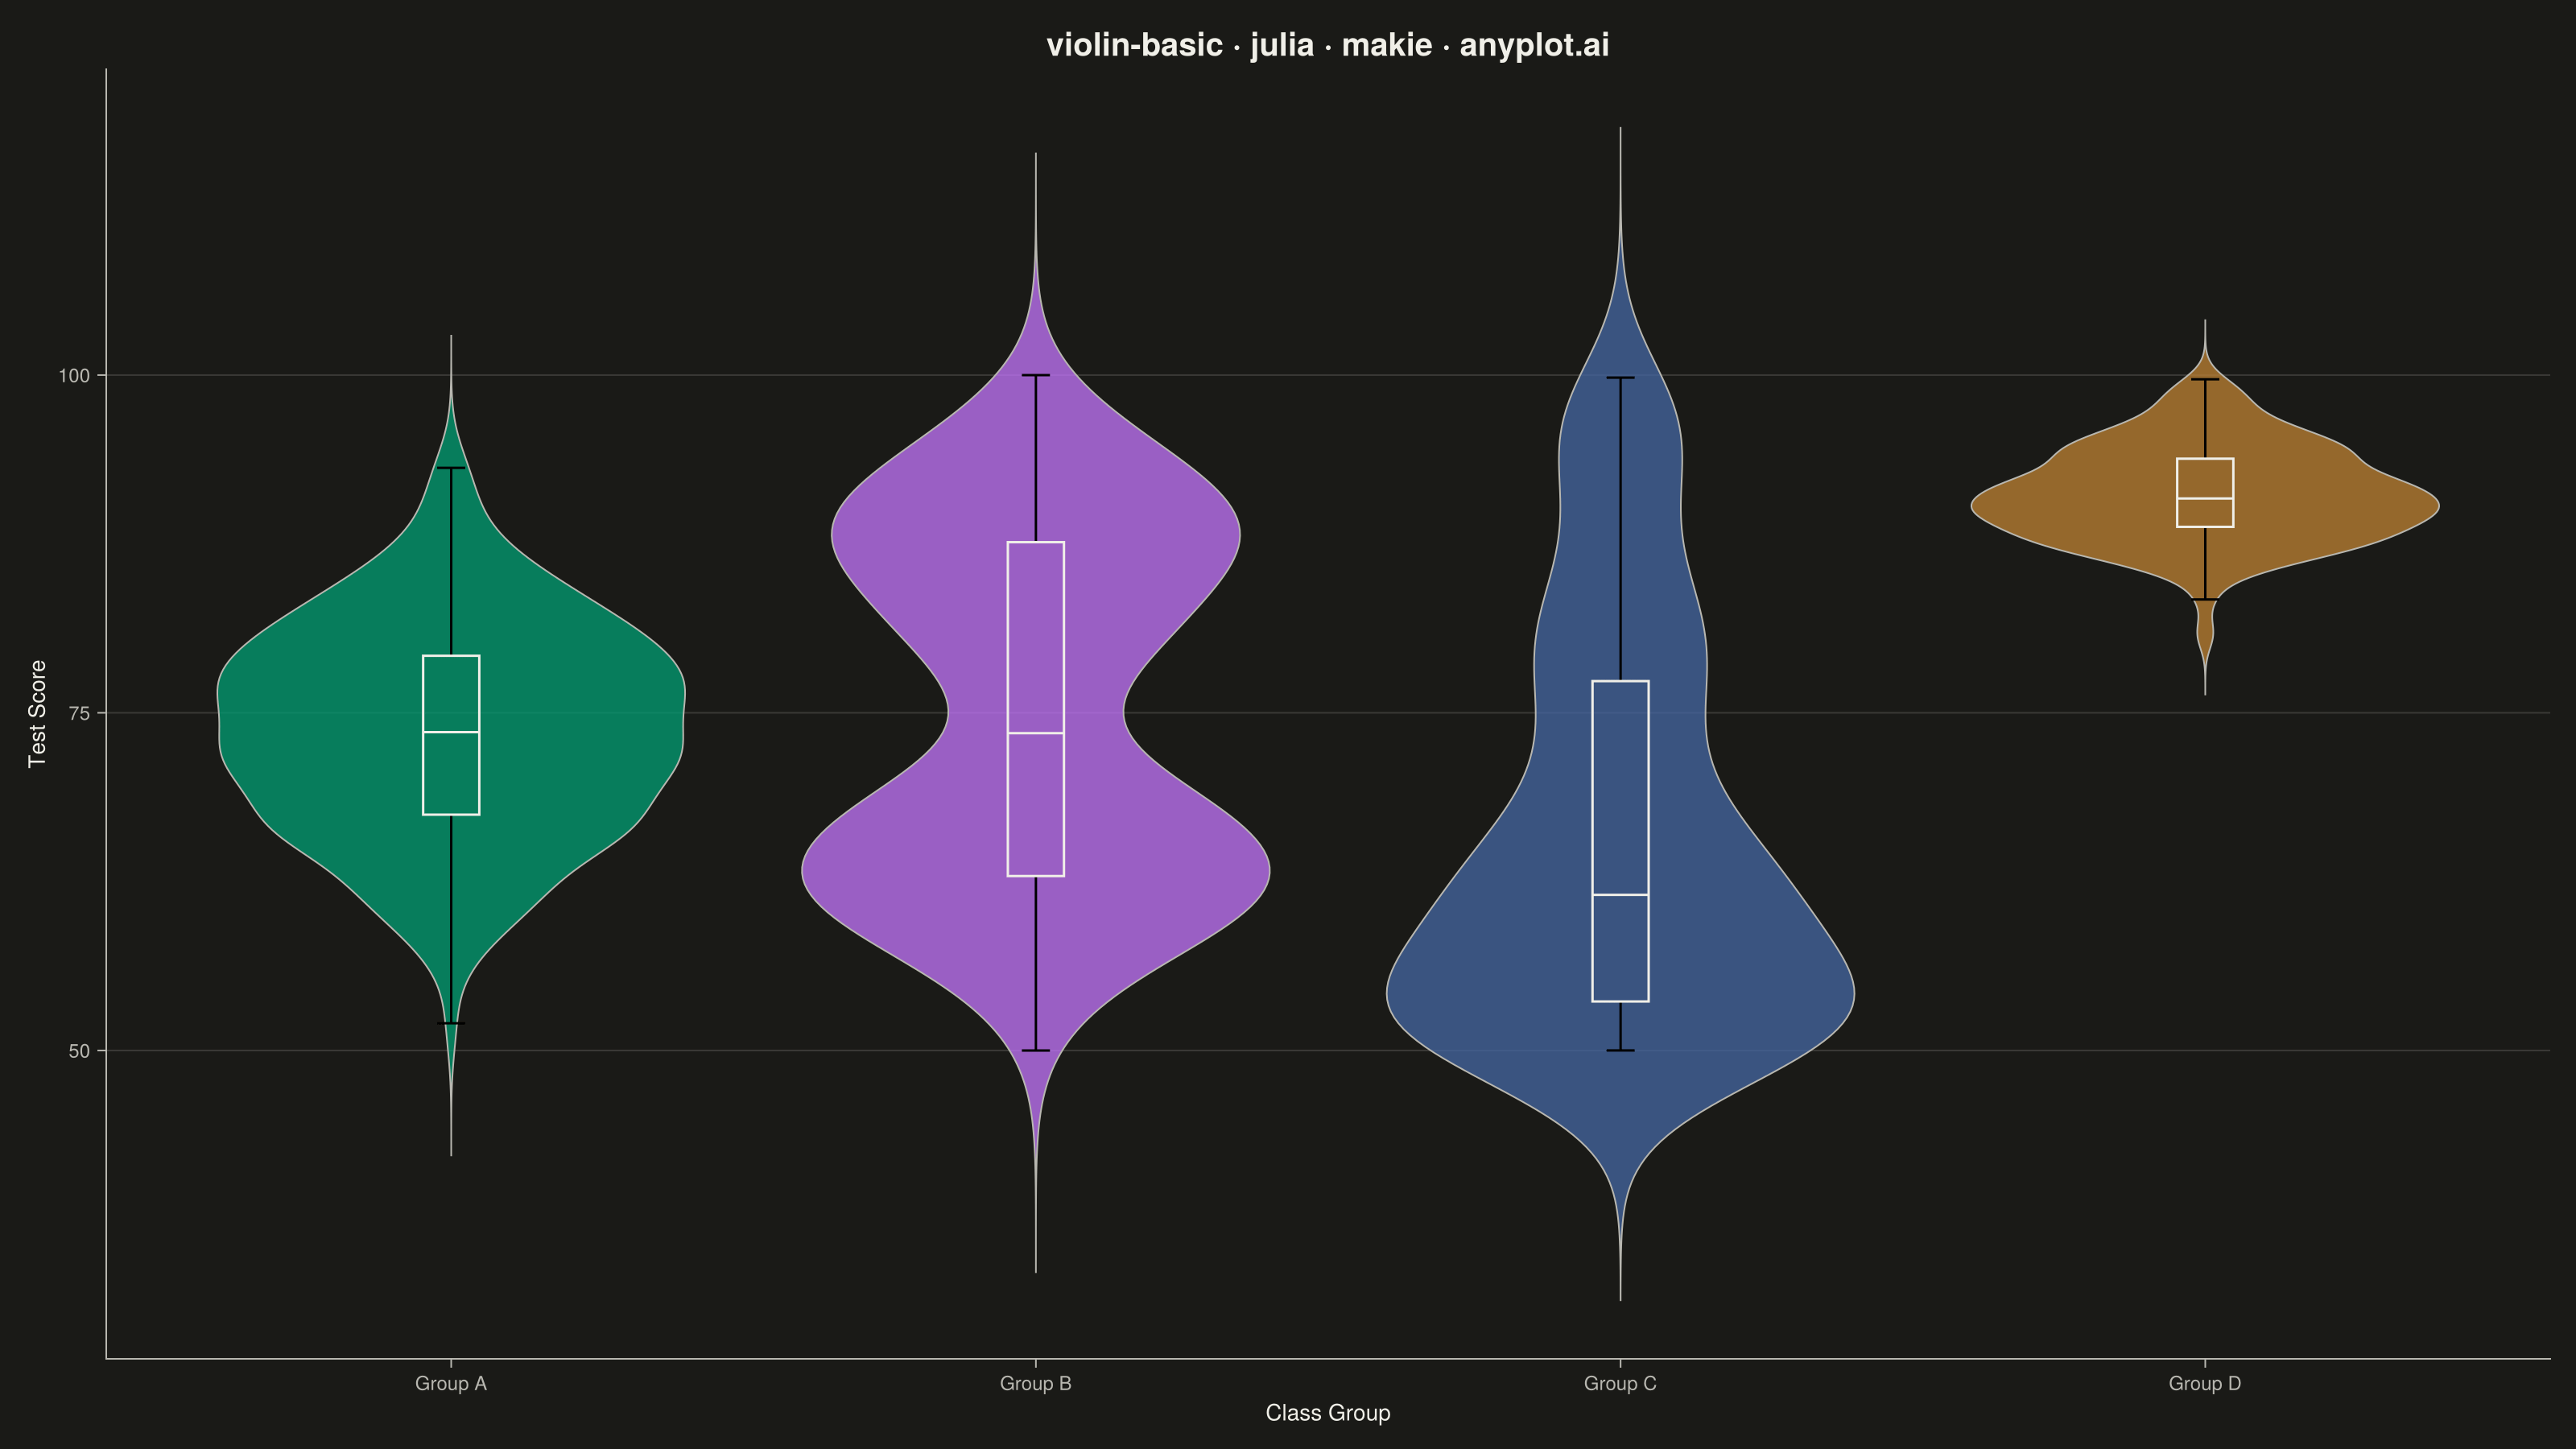
A violin plot combining a box plot with a kernel density estimation on each side, showing the distribution shape of numerical data. The width of the violin at each point represents the frequency of data values at that level. Excellent for comparing distributions across categories while revealing their underlying shape, providing more detail than a traditional box plot.
# anyplot.ai
# violin-basic: Basic Violin Plot
# Library: makie 0.22.10 | Julia 1.11.9
# Quality: 87/100 | Created: 2026-05-29

using CairoMakie
using Colors
using Random

Random.seed!(42)

# Theme tokens — Imprint palette
const THEME       = get(ENV, "ANYPLOT_THEME", "light")
const PAGE_BG     = THEME == "light" ? colorant"#FAF8F1" : colorant"#1A1A17"
const ELEVATED_BG = THEME == "light" ? colorant"#FFFDF6" : colorant"#242420"
const INK         = THEME == "light" ? colorant"#1A1A17" : colorant"#F0EFE8"
const INK_SOFT    = THEME == "light" ? colorant"#4A4A44" : colorant"#B8B7B0"
const INK_MUTED   = THEME == "light" ? colorant"#6B6A63" : colorant"#A8A79F"

const IMPRINT_PALETTE = [
    colorant"#009E73",  # 1 — brand green
    colorant"#C475FD",  # 2 — lavender
    colorant"#4467A3",  # 3 — blue
    colorant"#BD8233",  # 4 — ochre
]

# Data — test scores (50–100) across 4 class groups with distinct distribution shapes
n = 200

scores_a = clamp.(randn(n) .* 8.0 .+ 74.0, 50.0, 100.0)          # roughly normal
scores_b = clamp.(vcat(randn(n ÷ 2) .* 5.0 .+ 63.0,
                       randn(n ÷ 2) .* 5.0 .+ 87.0), 50.0, 100.0) # bimodal
scores_c = clamp.(50.0 .+ 50.0 .* rand(n) .^ 2, 50.0, 100.0)     # right-skewed
scores_d = clamp.(randn(n) .* 3.5 .+ 91.0, 50.0, 100.0)           # narrow, high-performing

groups = vcat(fill(1, n), fill(2, n), fill(3, n), fill(4, n))
values = vcat(scores_a, scores_b, scores_c, scores_d)

group_labels = ["Group A", "Group B", "Group C", "Group D"]
dist_labels  = ["normal", "bimodal ★", "right-skewed", "narrow"]

# Plot
fig = Figure(
    size            = (1600, 900),
    fontsize        = 14,
    backgroundcolor = PAGE_BG,
)

ax = Axis(
    fig[1, 1];
    title              = "violin-basic · julia · makie · anyplot.ai",
    titlesize          = 22,
    titlecolor         = INK,
    xlabel             = "Class Group",
    ylabel             = "Test Score",
    xlabelsize         = 14,
    ylabelsize         = 14,
    xlabelcolor        = INK,
    ylabelcolor        = INK,
    xticklabelsize     = 12,
    yticklabelsize     = 12,
    xticklabelcolor    = INK_SOFT,
    yticklabelcolor    = INK_SOFT,
    xtickcolor         = INK_SOFT,
    ytickcolor         = INK_SOFT,
    backgroundcolor    = PAGE_BG,
    topspinevisible    = false,
    rightspinevisible  = false,
    leftspinecolor     = INK_SOFT,
    bottomspinecolor   = INK_SOFT,
    xgridvisible       = false,
    ygridcolor         = RGBAf(INK.r, INK.g, INK.b, 0.15),
    yminorgridvisible  = false,
    xminorgridvisible  = false,
    xticks             = (1:4, group_labels),
)

# Draw one violin per group with Imprint palette color
for (i, col) in enumerate(IMPRINT_PALETTE)
    mask = groups .== i
    violin!(ax, groups[mask], values[mask];
        color       = (col, 0.75),
        strokewidth = 1.0,
        strokecolor = INK_SOFT,
    )
end

# Overlay narrow boxplot to show quartiles and median
boxplot!(ax, groups, values;
    color        = (:white, 0.0),
    strokecolor  = INK,
    strokewidth  = 1.5,
    mediancolor  = INK,
    width        = 0.12,
    whiskerwidth = 0.5,
    show_outliers = false,
)

# Callout annotation — draw viewer's eye to the bimodal shape in Group B
text!(ax, 2.0, 96.5;
    text     = "bimodal",
    color    = IMPRINT_PALETTE[2],
    fontsize = 12,
    font     = :bold,
    align    = (:center, :bottom),
)

# Custom Legend with per-group color swatches and distribution type labels
legend_elements = [PolyElement(color = (IMPRINT_PALETTE[i], 0.75),
                               strokecolor = INK_SOFT, strokewidth = 1.0)
                   for i in eachindex(group_labels)]
legend_labels   = ["$(group_labels[i]): $(dist_labels[i])" for i in eachindex(group_labels)]
Legend(fig[1, 2], legend_elements, legend_labels, "Distribution Shape";
    framevisible    = false,
    backgroundcolor = PAGE_BG,
    labelcolor      = INK_SOFT,
    titlecolor   = INK,
    titlesize    = 13,
    labelsize    = 12,
    padding      = (6, 6, 6, 6),
)

# Save
save("plot-$(THEME).png", fig; px_per_unit = 2)
Runnable source as JSON, for any HTTP client: https://api.anyplot.ai/specs/violin-basic/makie/code. Any spec id and library id listed in llms-full.txt fit the same URL shape; every URL below is complete and callable.
{
  "spec_id": "violin-basic",
  "language": "julia",
  "library": "makie",
  "page": "https://anyplot.ai/violin-basic/julia/makie",
  "hub": "https://anyplot.ai/violin-basic",
  "code_json": "https://api.anyplot.ai/specs/violin-basic/makie/code",
  "spec_json": "https://api.anyplot.ai/specs/violin-basic",
  "render_light_png": "https://storage.googleapis.com/anyplot-images/plots/violin-basic/julia/makie/plot-light.png",
  "render_dark_png": "https://storage.googleapis.com/anyplot-images/plots/violin-basic/julia/makie/plot-dark.png",
  "quality_score": 87.0,
  "license": "MIT",
  "guide": "https://anyplot.ai/llms.txt"
}
Part of Basic Violin Plot on anyplot.ai.