The same plot in 14 other libraries — Python: Altair, Bokeh, lets-plot, Matplotlib, Plotly, plotnine, Pygal, Seaborn; Julia: Makie.jl; JavaScript: Chart.js, D3.js, Apache ECharts, Highcharts, MUI X Charts. Compare all 15 side by side: Basic Violin Plot in Python, R, Julia and JavaScript.
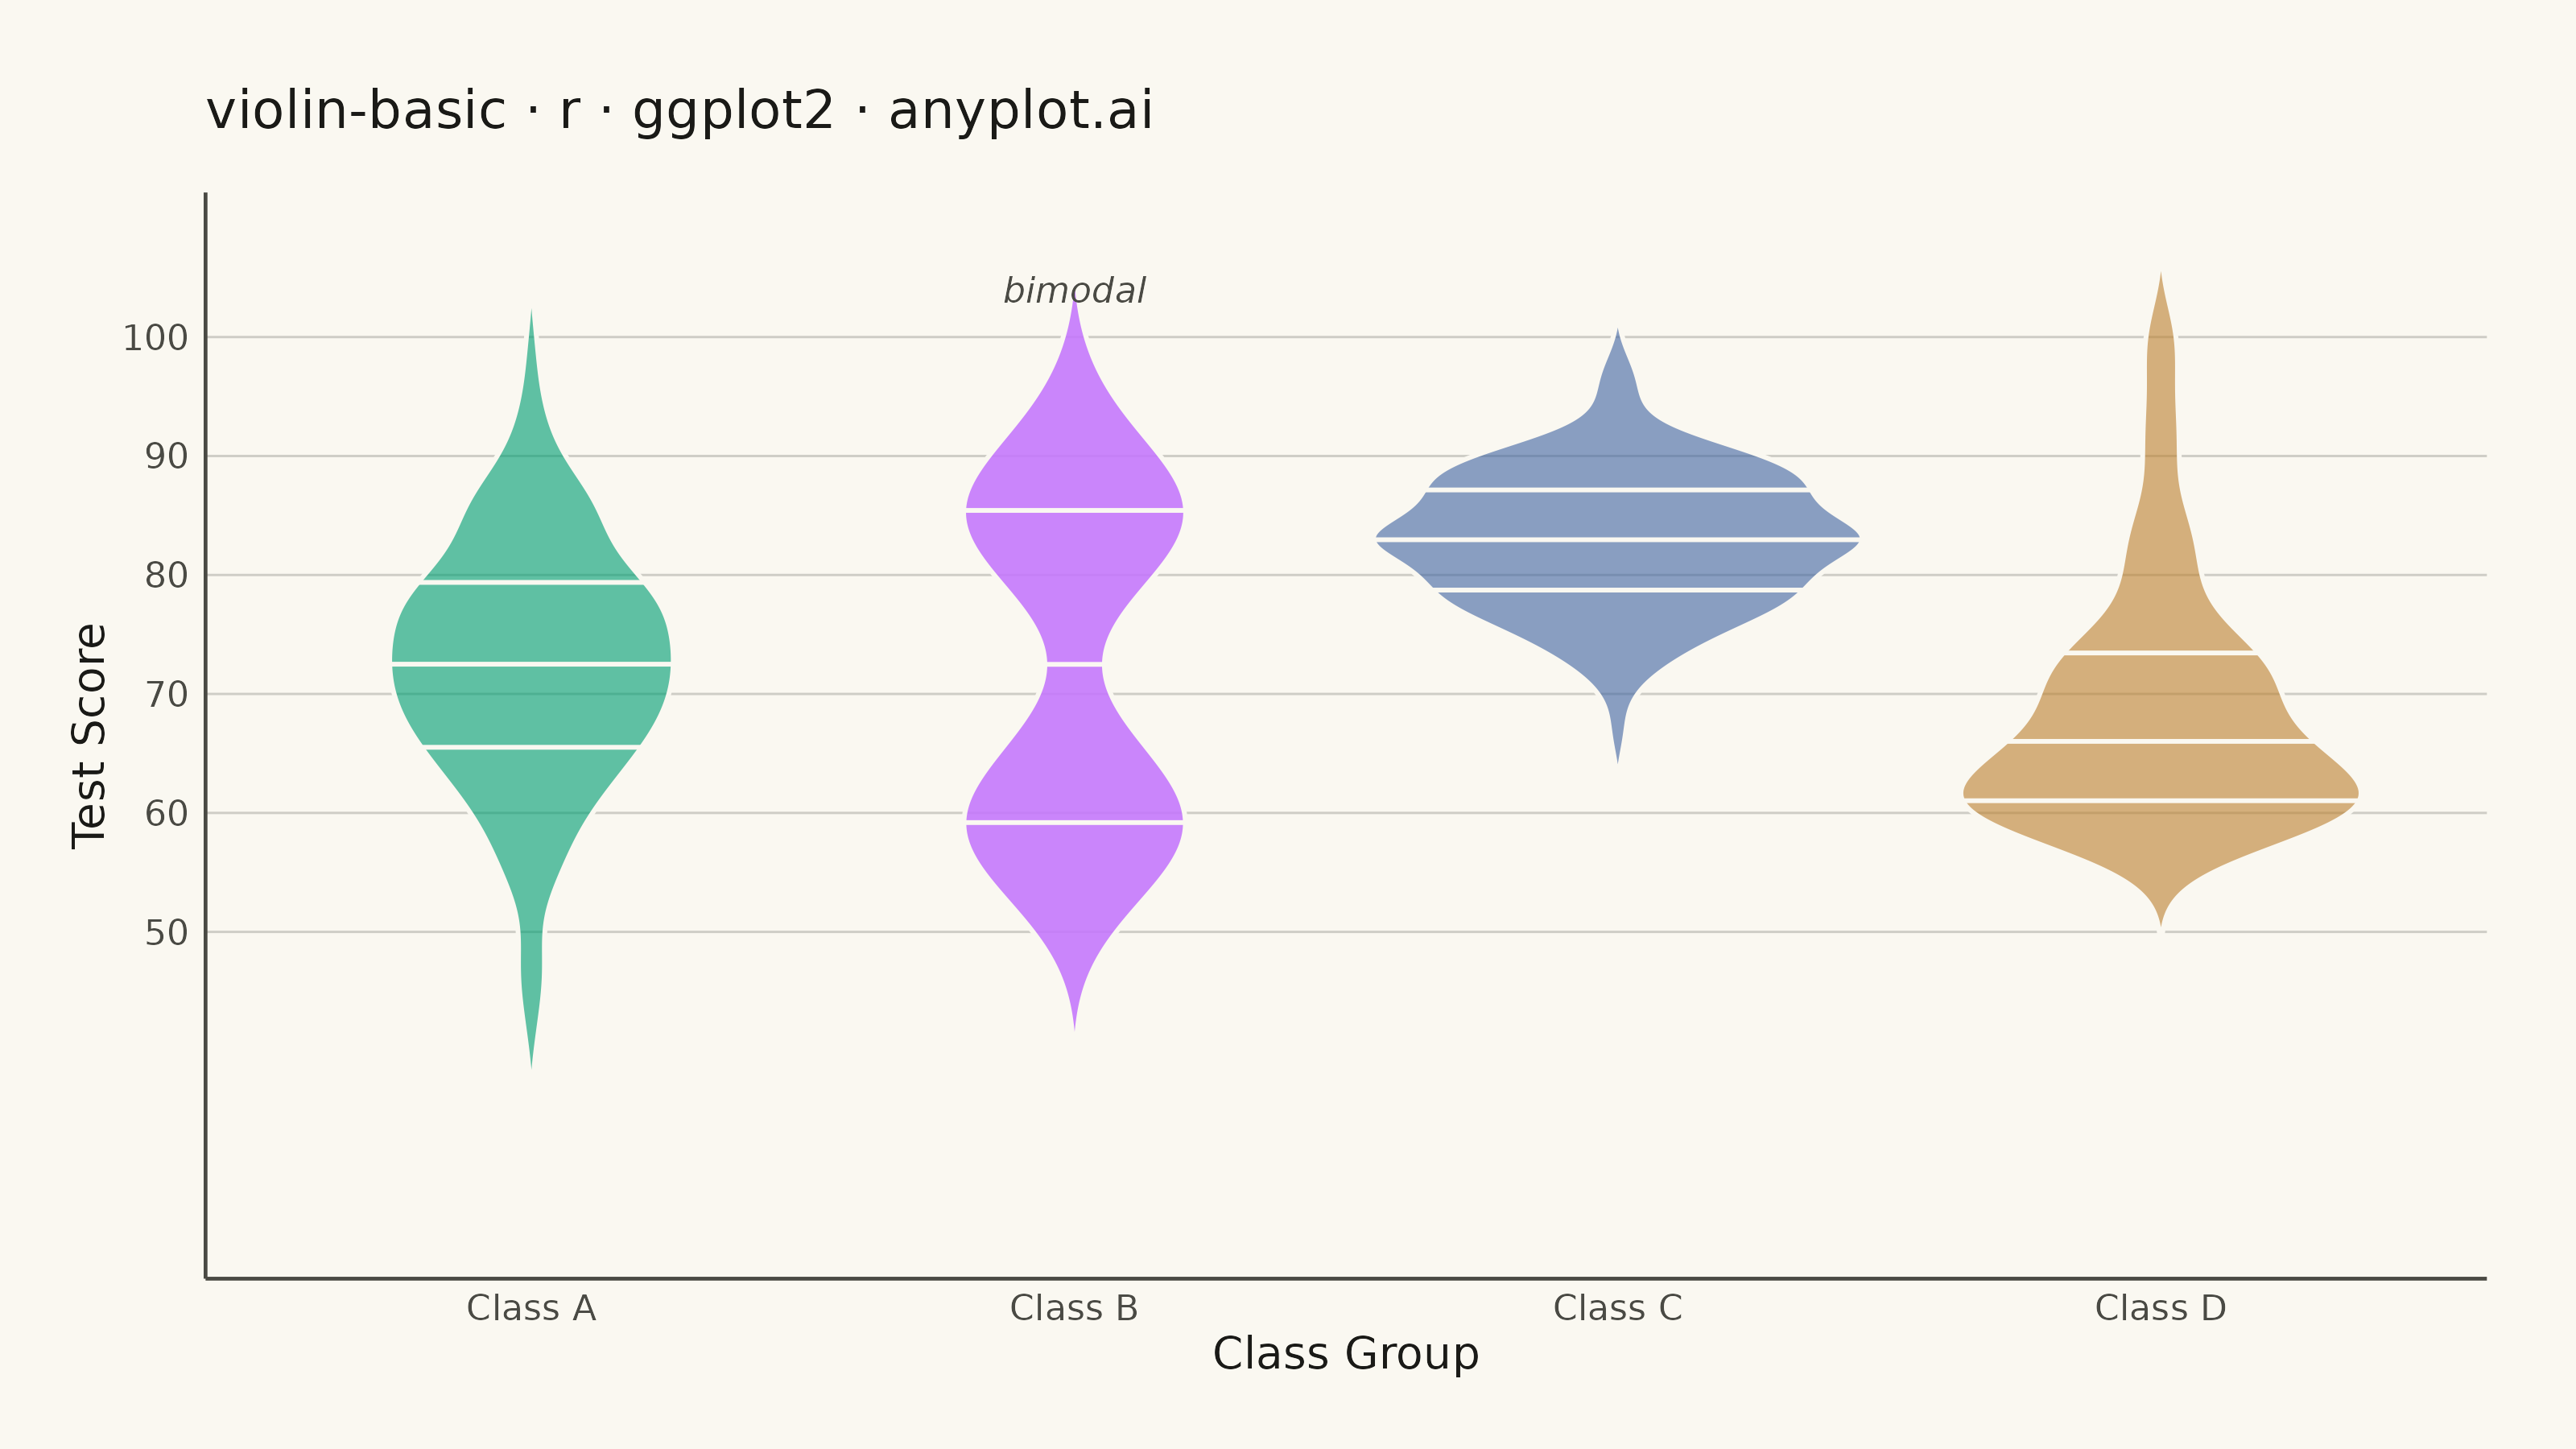
A violin plot combining a box plot with a kernel density estimation on each side, showing the distribution shape of numerical data. The width of the violin at each point represents the frequency of data values at that level. Excellent for comparing distributions across categories while revealing their underlying shape, providing more detail than a traditional box plot.
#' anyplot.ai
#' violin-basic: Basic Violin Plot
#' Library: ggplot2 3.5.1 | R 4.4.1
#' Quality: 87/100 | Created: 2026-05-29

library(ggplot2)
library(ragg)

set.seed(42)

# Theme tokens
THEME       <- Sys.getenv("ANYPLOT_THEME", "light")
PAGE_BG     <- if (THEME == "light") "#FAF8F1" else "#1A1A17"
ELEVATED_BG <- if (THEME == "light") "#FFFDF6" else "#242420"
INK         <- if (THEME == "light") "#1A1A17" else "#F0EFE8"
INK_SOFT    <- if (THEME == "light") "#4A4A44" else "#B8B7B0"

# Imprint palette — 4 series for 4 class groups
IMPRINT_PALETTE <- c(
  "#009E73",  # 1 — brand green
  "#C475FD",  # 2 — lavender
  "#4467A3",  # 3 — blue
  "#BD8233"   # 4 — ochre
)

# Data: test scores (50–100) across 4 class groups with distinct distribution shapes
class_a <- rnorm(120, mean = 72, sd = 10)                                        # average, symmetric
class_b <- c(rnorm(60, mean = 60, sd = 5), rnorm(60, mean = 86, sd = 5))        # bimodal
class_c <- rnorm(120, mean = 83, sd = 6)                                         # high-performing
class_d <- pmax(50, pmin(100, 58 + rexp(120, rate = 0.10)))                      # low, right-skewed

scores <- tibble::tibble(
  class = rep(c("Class A", "Class B", "Class C", "Class D"),
              times = c(length(class_a), length(class_b), length(class_c), length(class_d))),
  score = c(class_a, class_b, class_c, class_d)
)
scores$class <- factor(scores$class, levels = c("Class A", "Class B", "Class C", "Class D"))

# Alpha: emphasize the bimodal Class B distribution
ALPHA_VALUES <- c("Class A" = 0.62, "Class B" = 0.88, "Class C" = 0.62, "Class D" = 0.62)

# Grid color at ~25% opacity to keep lines subtle
GRID_COLOR <- adjustcolor(INK_SOFT, alpha.f = 0.25)

# Plot
p <- ggplot(scores, aes(x = class, y = score, fill = class, alpha = class)) +
  geom_violin(
    trim           = FALSE,
    color          = PAGE_BG,   # quantile lines appear as PAGE_BG cuts through the fill
    linewidth      = 0.5,
    draw_quantiles = c(0.25, 0.5, 0.75)
  ) +
  annotate(
    "text",
    x = "Class B", y = 104,
    label    = "bimodal",
    color    = INK_SOFT,
    size     = 2.8,
    fontface = "italic"
  ) +
  scale_fill_manual(values = IMPRINT_PALETTE, guide = "none") +
  scale_alpha_manual(values = ALPHA_VALUES, guide = "none") +
  scale_y_continuous(breaks = seq(50, 100, by = 10)) +
  coord_cartesian(ylim = c(25, 108)) +
  labs(
    title = "violin-basic · r · ggplot2 · anyplot.ai",
    x     = "Class Group",
    y     = "Test Score"
  ) +
  theme_minimal(base_size = 8) +
  theme(
    plot.background    = element_rect(fill = PAGE_BG,    color = PAGE_BG),
    panel.background   = element_rect(fill = PAGE_BG,    color = NA),
    panel.grid.major.y = element_line(color = GRID_COLOR, linewidth = 0.25),
    panel.grid.major.x = element_blank(),
    panel.grid.minor   = element_blank(),
    panel.border       = element_blank(),
    axis.line.x        = element_line(color = INK_SOFT,  linewidth = 0.4),
    axis.line.y        = element_line(color = INK_SOFT,  linewidth = 0.4),
    axis.title         = element_text(color = INK,       size = 10),
    axis.text          = element_text(color = INK_SOFT,  size = 8),
    plot.title         = element_text(color = INK,       size = 12, margin = margin(b = 12)),
    plot.margin        = margin(t = 20, r = 20, b = 16, l = 16)
  )

# Save
ggsave(
  filename = sprintf("plot-%s.png", THEME),
  plot     = p,
  device   = ragg::agg_png,
  width    = 8,
  height   = 4.5,
  units    = "in",
  dpi      = 400
)
Runnable source as JSON, for any HTTP client: https://api.anyplot.ai/specs/violin-basic/ggplot2/code. Any spec id and library id listed in llms-full.txt fit the same URL shape; every URL below is complete and callable.
{
  "spec_id": "violin-basic",
  "language": "r",
  "library": "ggplot2",
  "page": "https://anyplot.ai/violin-basic/r/ggplot2",
  "hub": "https://anyplot.ai/violin-basic",
  "code_json": "https://api.anyplot.ai/specs/violin-basic/ggplot2/code",
  "spec_json": "https://api.anyplot.ai/specs/violin-basic",
  "render_light_png": "https://storage.googleapis.com/anyplot-images/plots/violin-basic/r/ggplot2/plot-light.png",
  "render_dark_png": "https://storage.googleapis.com/anyplot-images/plots/violin-basic/r/ggplot2/plot-dark.png",
  "quality_score": 87.0,
  "license": "MIT",
  "guide": "https://anyplot.ai/llms.txt"
}
Part of Basic Violin Plot on anyplot.ai.