The same plot in 14 other libraries — JavaScript: Chart.js, D3.js, Highcharts, MUI X Charts; Python: Altair, Bokeh, lets-plot, Matplotlib, Plotly, plotnine, Pygal, Seaborn; R: ggplot2; Julia: Makie.jl. Compare all 15 side by side: Basic Violin Plot in Python, R, Julia and JavaScript.
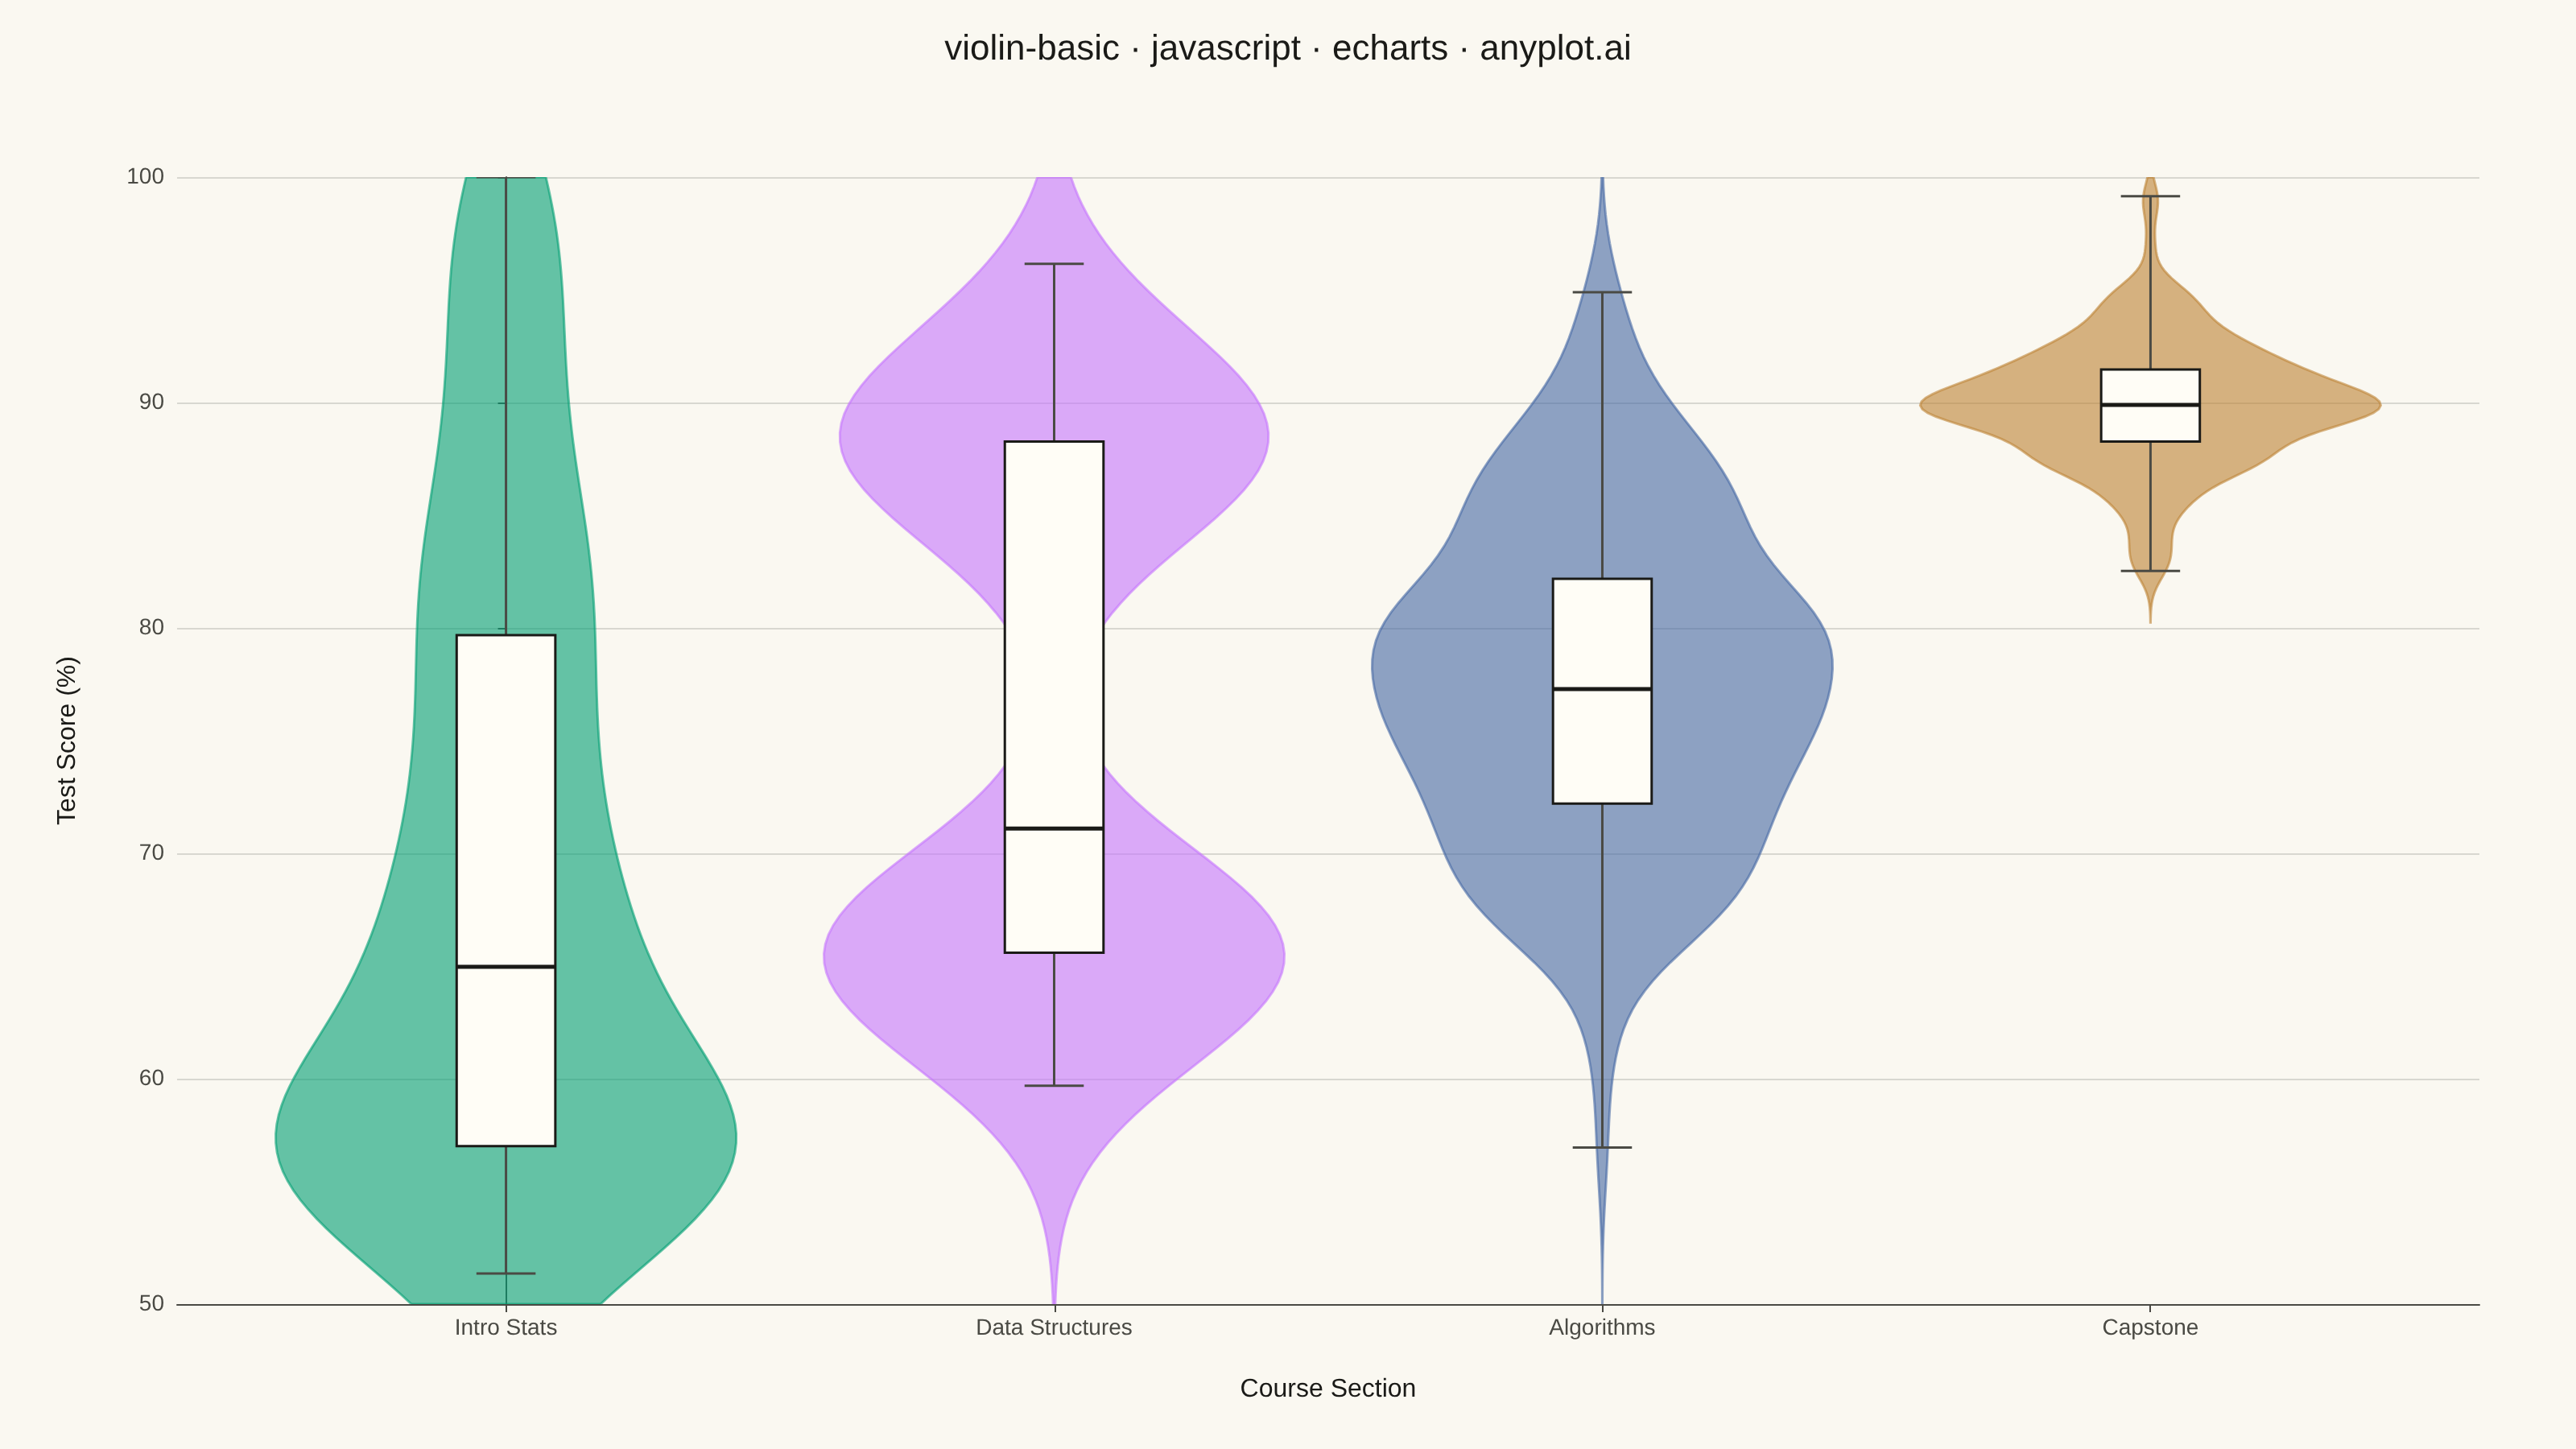
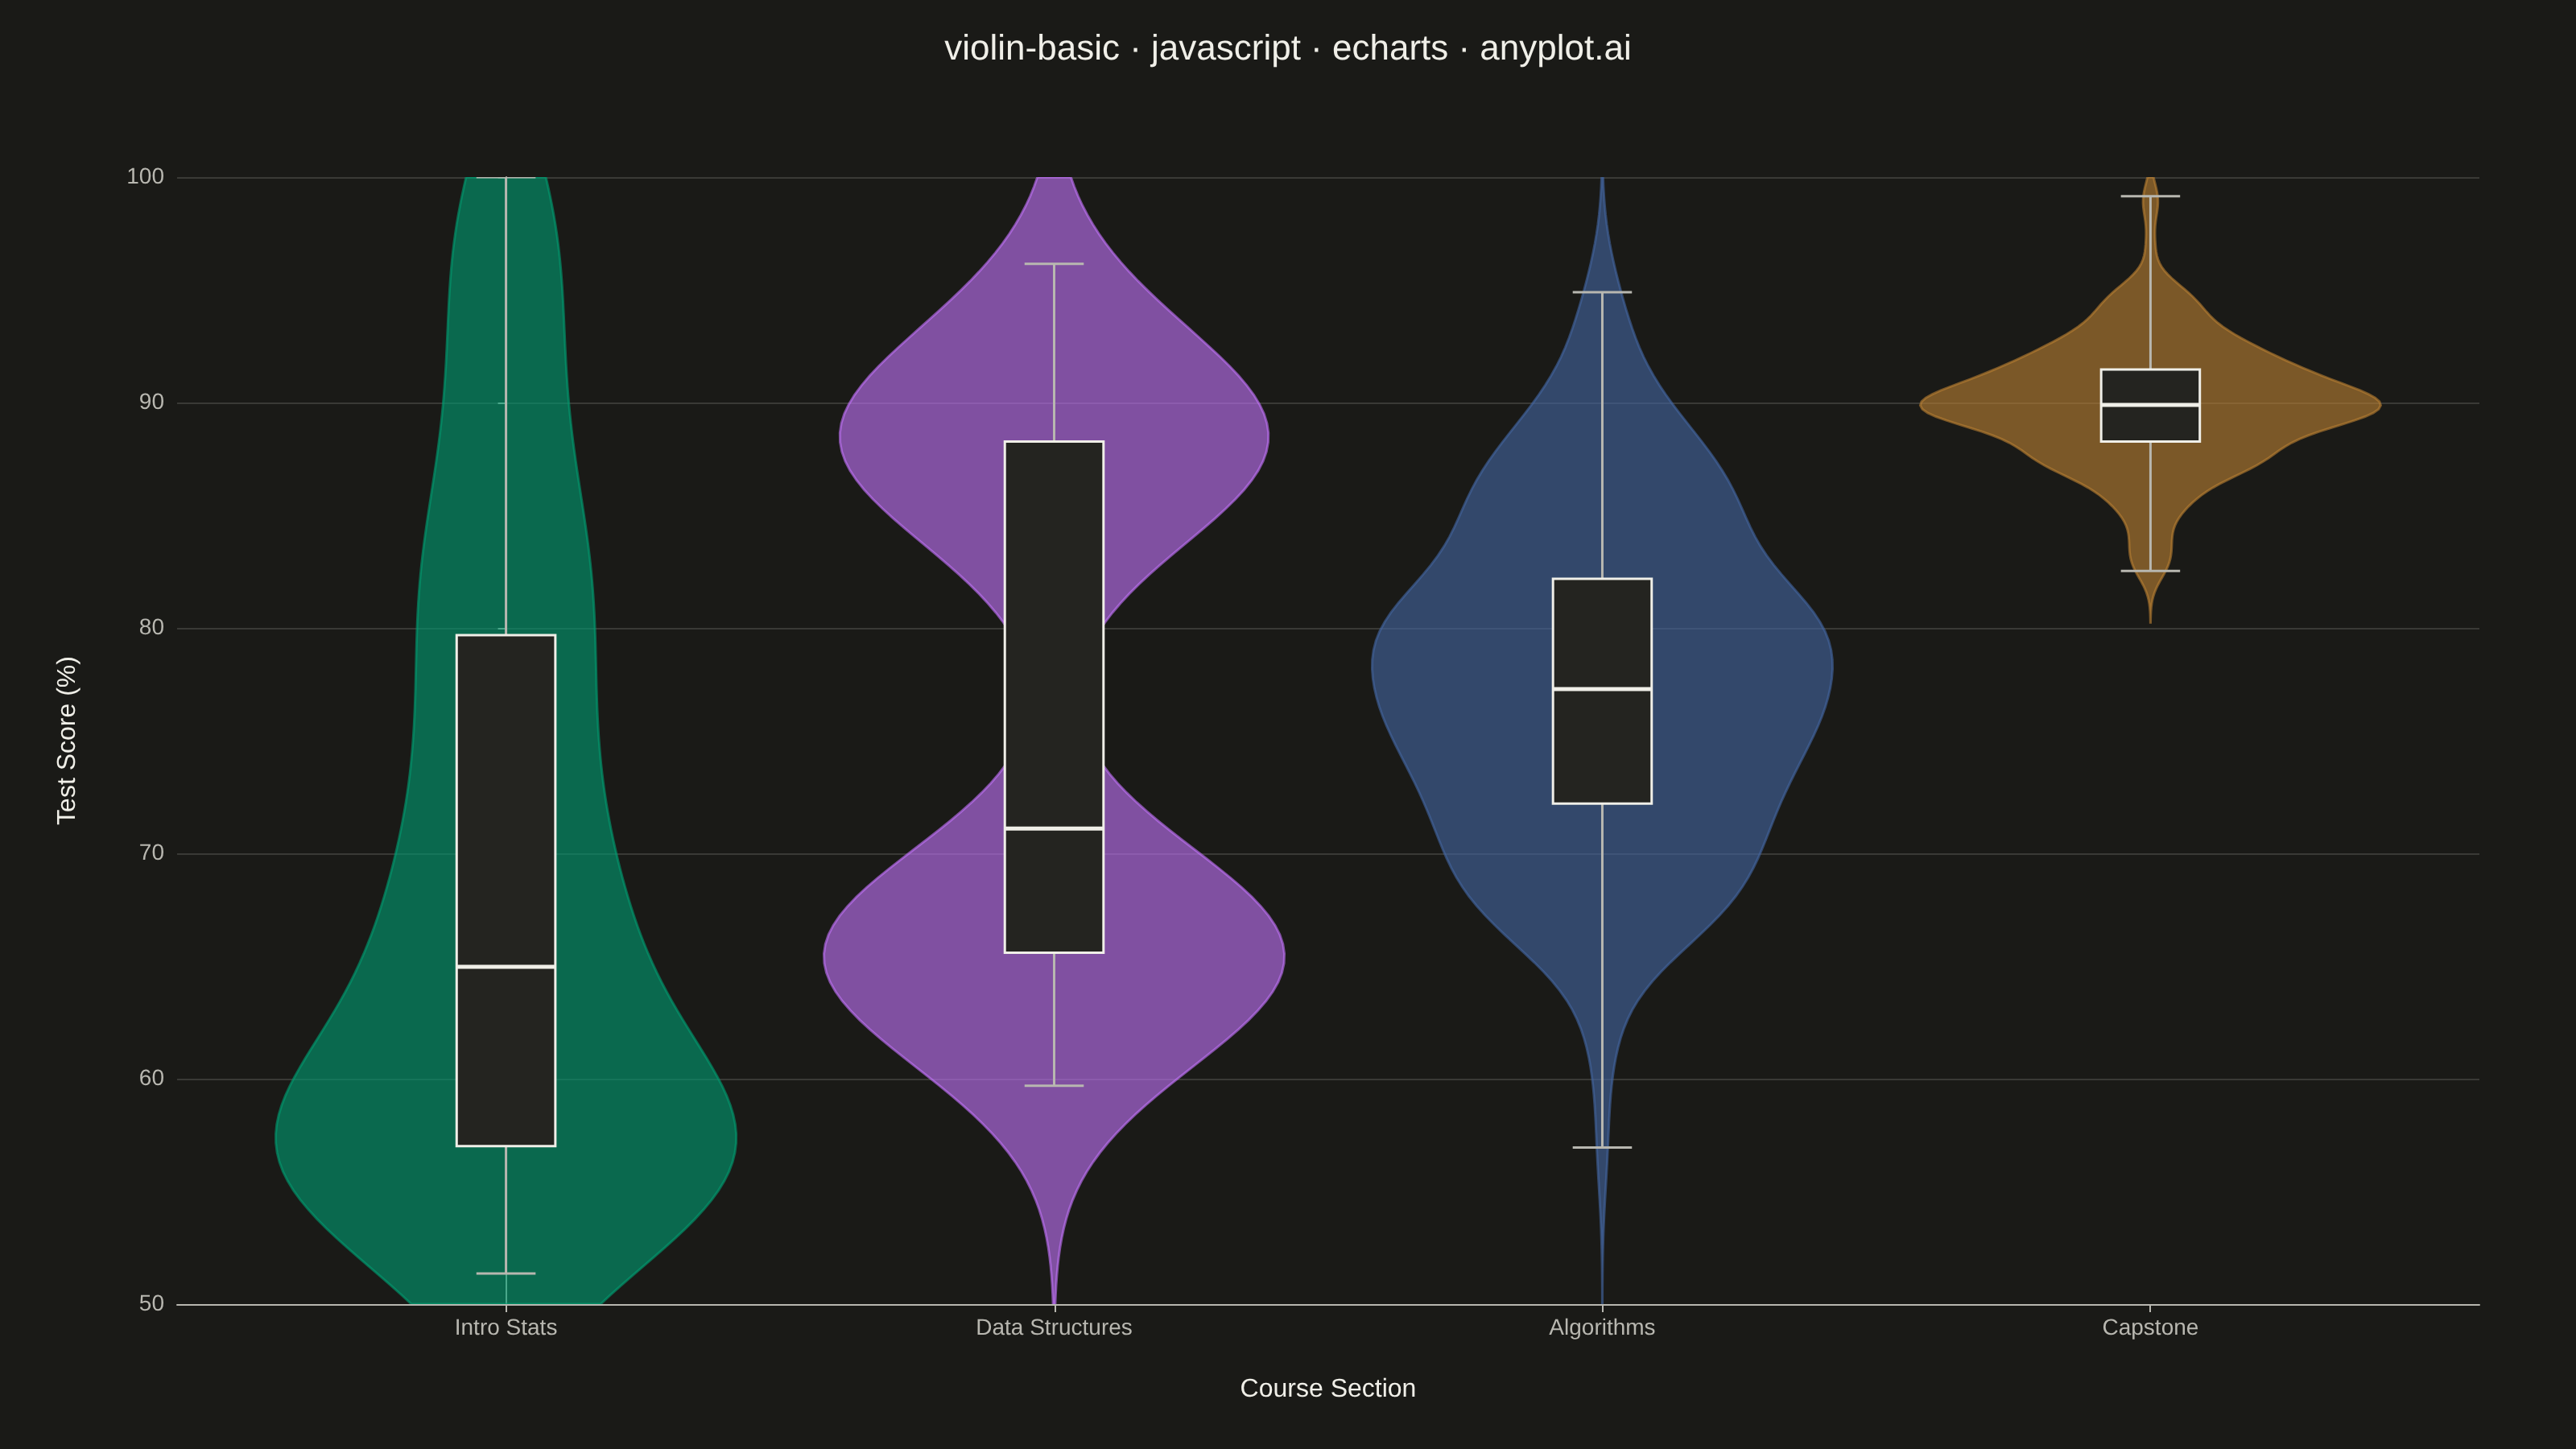
A violin plot combining a box plot with a kernel density estimation on each side, showing the distribution shape of numerical data. The width of the violin at each point represents the frequency of data values at that level. Excellent for comparing distributions across categories while revealing their underlying shape, providing more detail than a traditional box plot.
// anyplot.ai
// violin-basic: Basic Violin Plot
// Library: echarts 6.1.0 | JavaScript 22.23.2
// Quality: 90/100 | Created: 2026-08-26

const t = window.ANYPLOT_TOKENS;

// --- Data (in-memory, deterministic, LCG-seeded) ----------------------------
// Test-score distributions (0-100 scale) across four course sections, each
// shaped to show a distinct distribution: right-skewed, bimodal, moderate
// spread, and tightly clustered.

function makeLCG(seed) {
  let state = seed >>> 0;
  return function rng() {
    state = (Math.imul(state, 1664525) + 1013904223) >>> 0;
    return state / 4294967296;
  };
}

function randNormal(rng) {
  let u1 = 0;
  while (u1 === 0) u1 = rng();
  const u2 = rng();
  return Math.sqrt(-2 * Math.log(u1)) * Math.cos(2 * Math.PI * u2);
}

function clip(value, lo, hi) {
  return Math.min(hi, Math.max(lo, value));
}

const rng = makeLCG(42);
const sampleSize = 180;

const courses = ["Intro Stats", "Data Structures", "Algorithms", "Capstone"];

function generateScores(centerFn, noiseStd) {
  const scores = [];
  for (let i = 0; i < sampleSize; i++) {
    scores.push(clip(centerFn() + randNormal(rng) * noiseStd, 50, 100));
  }
  return scores;
}

const scoresByCourse = [
  generateScores(() => 55 + 45 * Math.pow(rng(), 2.3), 2), // right-skewed
  generateScores(() => (rng() < 0.52 ? 65 : 89), 3.2), // bimodal
  generateScores(() => 78, 8), // moderate spread
  generateScores(() => 90, 3), // narrow cluster
];

// --- Stats + kernel density estimation --------------------------------------

function quantile(sorted, q) {
  const pos = q * (sorted.length - 1);
  const lo = Math.floor(pos);
  const hi = Math.ceil(pos);
  const frac = pos - lo;
  return sorted[lo] + (sorted[hi] - sorted[lo]) * frac;
}

function computeStats(values) {
  const sorted = [...values].sort((a, b) => a - b);
  return {
    min: sorted[0],
    q1: quantile(sorted, 0.25),
    median: quantile(sorted, 0.5),
    q3: quantile(sorted, 0.75),
    max: sorted[sorted.length - 1],
  };
}

function silvermanBandwidth(values, stats) {
  const n = values.length;
  const mean = values.reduce((sum, v) => sum + v, 0) / n;
  const variance = values.reduce((sum, v) => sum + (v - mean) ** 2, 0) / (n - 1);
  const std = Math.sqrt(variance);
  const iqr = stats.q3 - stats.q1;
  const spread = iqr > 0 ? Math.min(std, iqr / 1.34) : std;
  return 0.9 * spread * Math.pow(n, -0.2);
}

function gaussianKDE(values, grid, bandwidth) {
  const norm = 1 / (values.length * bandwidth * Math.sqrt(2 * Math.PI));
  return grid.map((x) => {
    let sum = 0;
    for (const v of values) {
      const u = (x - v) / bandwidth;
      sum += Math.exp(-0.5 * u * u);
    }
    return sum * norm;
  });
}

const gridN = 120;

const boxStats = scoresByCourse.map(computeStats);
const violinProfiles = scoresByCourse.map((values, i) => {
  const stats = boxStats[i];
  const bandwidth = silvermanBandwidth(values, stats);
  // Scope the grid to this category's own data range (padded by 3 bandwidths)
  // instead of a shared fixed range, so tight distributions taper to zero
  // within their real extent rather than streaking to the axis floor.
  const gridMin = Math.max(50, stats.min - 3 * bandwidth);
  const gridMax = Math.min(100, stats.max + 3 * bandwidth);
  const grid = Array.from(
    { length: gridN },
    (_, j) => gridMin + (j * (gridMax - gridMin)) / (gridN - 1),
  );
  const density = gaussianKDE(values, grid, bandwidth);
  return { grid, density, maxDensity: Math.max(...density) };
});

// --- Layout constants ---------------------------------------------------
const violinHalfWidth = 0.42;
const boxHalfWidth = 0.09;
const capHalfWidth = boxHalfWidth * 0.6;

// --- renderItem: mirrored density polygon -----------------------------------
function renderViolin(params, api) {
  const idx = params.dataIndex;
  const profile = violinProfiles[idx];
  const points = [];
  for (let j = 0; j < profile.grid.length; j++) {
    const w = violinHalfWidth * (profile.density[j] / profile.maxDensity);
    points.push(api.coord([idx - w, profile.grid[j]]));
  }
  for (let j = profile.grid.length - 1; j >= 0; j--) {
    const w = violinHalfWidth * (profile.density[j] / profile.maxDensity);
    points.push(api.coord([idx + w, profile.grid[j]]));
  }
  return {
    type: "polygon",
    shape: { points },
    style: api.style(),
  };
}

// --- renderItem: box (quartiles) + median line + whiskers -------------------
function renderBox(params, api) {
  const idx = params.dataIndex;
  const s = boxStats[idx];
  const topLeft = api.coord([idx - boxHalfWidth, s.q3]);
  const bottomRight = api.coord([idx + boxHalfWidth, s.q1]);
  const medianL = api.coord([idx - boxHalfWidth, s.median]);
  const medianR = api.coord([idx + boxHalfWidth, s.median]);
  const whiskerHighTop = api.coord([idx, s.max]);
  const whiskerHighBottom = api.coord([idx, s.q3]);
  const whiskerLowTop = api.coord([idx, s.q1]);
  const whiskerLowBottom = api.coord([idx, s.min]);
  const capHighL = api.coord([idx - capHalfWidth, s.max]);
  const capHighR = api.coord([idx + capHalfWidth, s.max]);
  const capLowL = api.coord([idx - capHalfWidth, s.min]);
  const capLowR = api.coord([idx + capHalfWidth, s.min]);

  const whiskerStyle = { stroke: t.inkSoft, lineWidth: 1.5 };
  return {
    type: "group",
    children: [
      { type: "line", shape: { x1: whiskerHighTop[0], y1: whiskerHighTop[1], x2: whiskerHighBottom[0], y2: whiskerHighBottom[1] }, style: whiskerStyle },
      { type: "line", shape: { x1: whiskerLowTop[0], y1: whiskerLowTop[1], x2: whiskerLowBottom[0], y2: whiskerLowBottom[1] }, style: whiskerStyle },
      { type: "line", shape: { x1: capHighL[0], y1: capHighL[1], x2: capHighR[0], y2: capHighR[1] }, style: whiskerStyle },
      { type: "line", shape: { x1: capLowL[0], y1: capLowL[1], x2: capLowR[0], y2: capLowR[1] }, style: whiskerStyle },
      {
        type: "rect",
        shape: {
          x: topLeft[0],
          y: topLeft[1],
          width: bottomRight[0] - topLeft[0],
          height: bottomRight[1] - topLeft[1],
        },
        style: { fill: t.elevatedBg, stroke: t.ink, lineWidth: 1.5 },
      },
      { type: "line", shape: { x1: medianL[0], y1: medianL[1], x2: medianR[0], y2: medianR[1] }, style: { stroke: t.ink, lineWidth: 2.5 } },
    ],
  };
}

// --- Init ---------------------------------------------------------------
const chart = echarts.init(document.getElementById("container"));

// --- Option ---------------------------------------------------------------
chart.setOption({
  animation: false,
  backgroundColor: "transparent",
  title: {
    text: "violin-basic · javascript · echarts · anyplot.ai",
    left: "center",
    textStyle: { color: t.ink, fontSize: 22, fontWeight: 500 },
  },
  tooltip: {
    trigger: "item",
    backgroundColor: t.elevatedBg,
    borderColor: t.grid,
    textStyle: { color: t.ink },
    formatter: (params) => {
      const s = boxStats[params.dataIndex];
      return [
        `<b>${courses[params.dataIndex]}</b>`,
        `Max: ${s.max.toFixed(1)}`,
        `Q3: ${s.q3.toFixed(1)}`,
        `Median: ${s.median.toFixed(1)}`,
        `Q1: ${s.q1.toFixed(1)}`,
        `Min: ${s.min.toFixed(1)}`,
      ].join("<br/>");
    },
  },
  grid: { left: 110, right: 60, top: 110, bottom: 90 },
  xAxis: {
    type: "value",
    min: -0.6,
    max: courses.length - 1 + 0.6,
    name: "Course Section",
    nameLocation: "middle",
    nameGap: 45,
    nameTextStyle: { color: t.ink, fontSize: 16 },
    axisLabel: {
      customValues: courses.map((_, i) => i),
      formatter: (value) => courses[Math.round(value)],
      color: t.inkSoft,
      fontSize: 14,
    },
    axisTick: { customValues: courses.map((_, i) => i) },
    axisLine: { lineStyle: { color: t.inkSoft } },
    splitLine: { show: false },
  },
  yAxis: {
    type: "value",
    min: 50,
    max: 100,
    name: "Test Score (%)",
    nameLocation: "middle",
    nameGap: 60,
    nameTextStyle: { color: t.ink, fontSize: 16 },
    axisLabel: { color: t.inkSoft, fontSize: 14 },
    axisLine: { lineStyle: { color: t.inkSoft } },
    splitLine: { lineStyle: { color: t.grid } },
  },
  series: [
    {
      type: "custom",
      name: "Distribution",
      renderItem: renderViolin,
      coordinateSystem: "cartesian2d",
      clip: true,
      data: courses.map((_, i) => ({
        value: [i, boxStats[i].median],
        itemStyle: { color: t.palette[i], borderColor: t.palette[i], borderWidth: 1.5, opacity: 0.6 },
      })),
      encode: { x: 0, y: 1 },
    },
    {
      type: "custom",
      name: "Quartiles",
      renderItem: renderBox,
      coordinateSystem: "cartesian2d",
      clip: true,
      data: courses.map((_, i) => [i, boxStats[i].median]),
      encode: { x: 0, y: 1 },
    },
  ],
});
Runnable source as JSON, for any HTTP client: https://api.anyplot.ai/specs/violin-basic/echarts/code. Any spec id and library id listed in llms-full.txt fit the same URL shape; every URL below is complete and callable.
{
  "spec_id": "violin-basic",
  "language": "javascript",
  "library": "echarts",
  "page": "https://anyplot.ai/violin-basic/javascript/echarts",
  "hub": "https://anyplot.ai/violin-basic",
  "code_json": "https://api.anyplot.ai/specs/violin-basic/echarts/code",
  "spec_json": "https://api.anyplot.ai/specs/violin-basic",
  "render_light_png": "https://storage.googleapis.com/anyplot-images/plots/violin-basic/javascript/echarts/plot-light.png",
  "render_dark_png": "https://storage.googleapis.com/anyplot-images/plots/violin-basic/javascript/echarts/plot-dark.png",
  "interactive_light_html": "https://storage.googleapis.com/anyplot-images/plots/violin-basic/javascript/echarts/plot-light.html",
  "interactive_dark_html": "https://storage.googleapis.com/anyplot-images/plots/violin-basic/javascript/echarts/plot-dark.html",
  "quality_score": 90.0,
  "license": "MIT",
  "guide": "https://anyplot.ai/llms.txt"
}
Part of Basic Violin Plot on anyplot.ai.