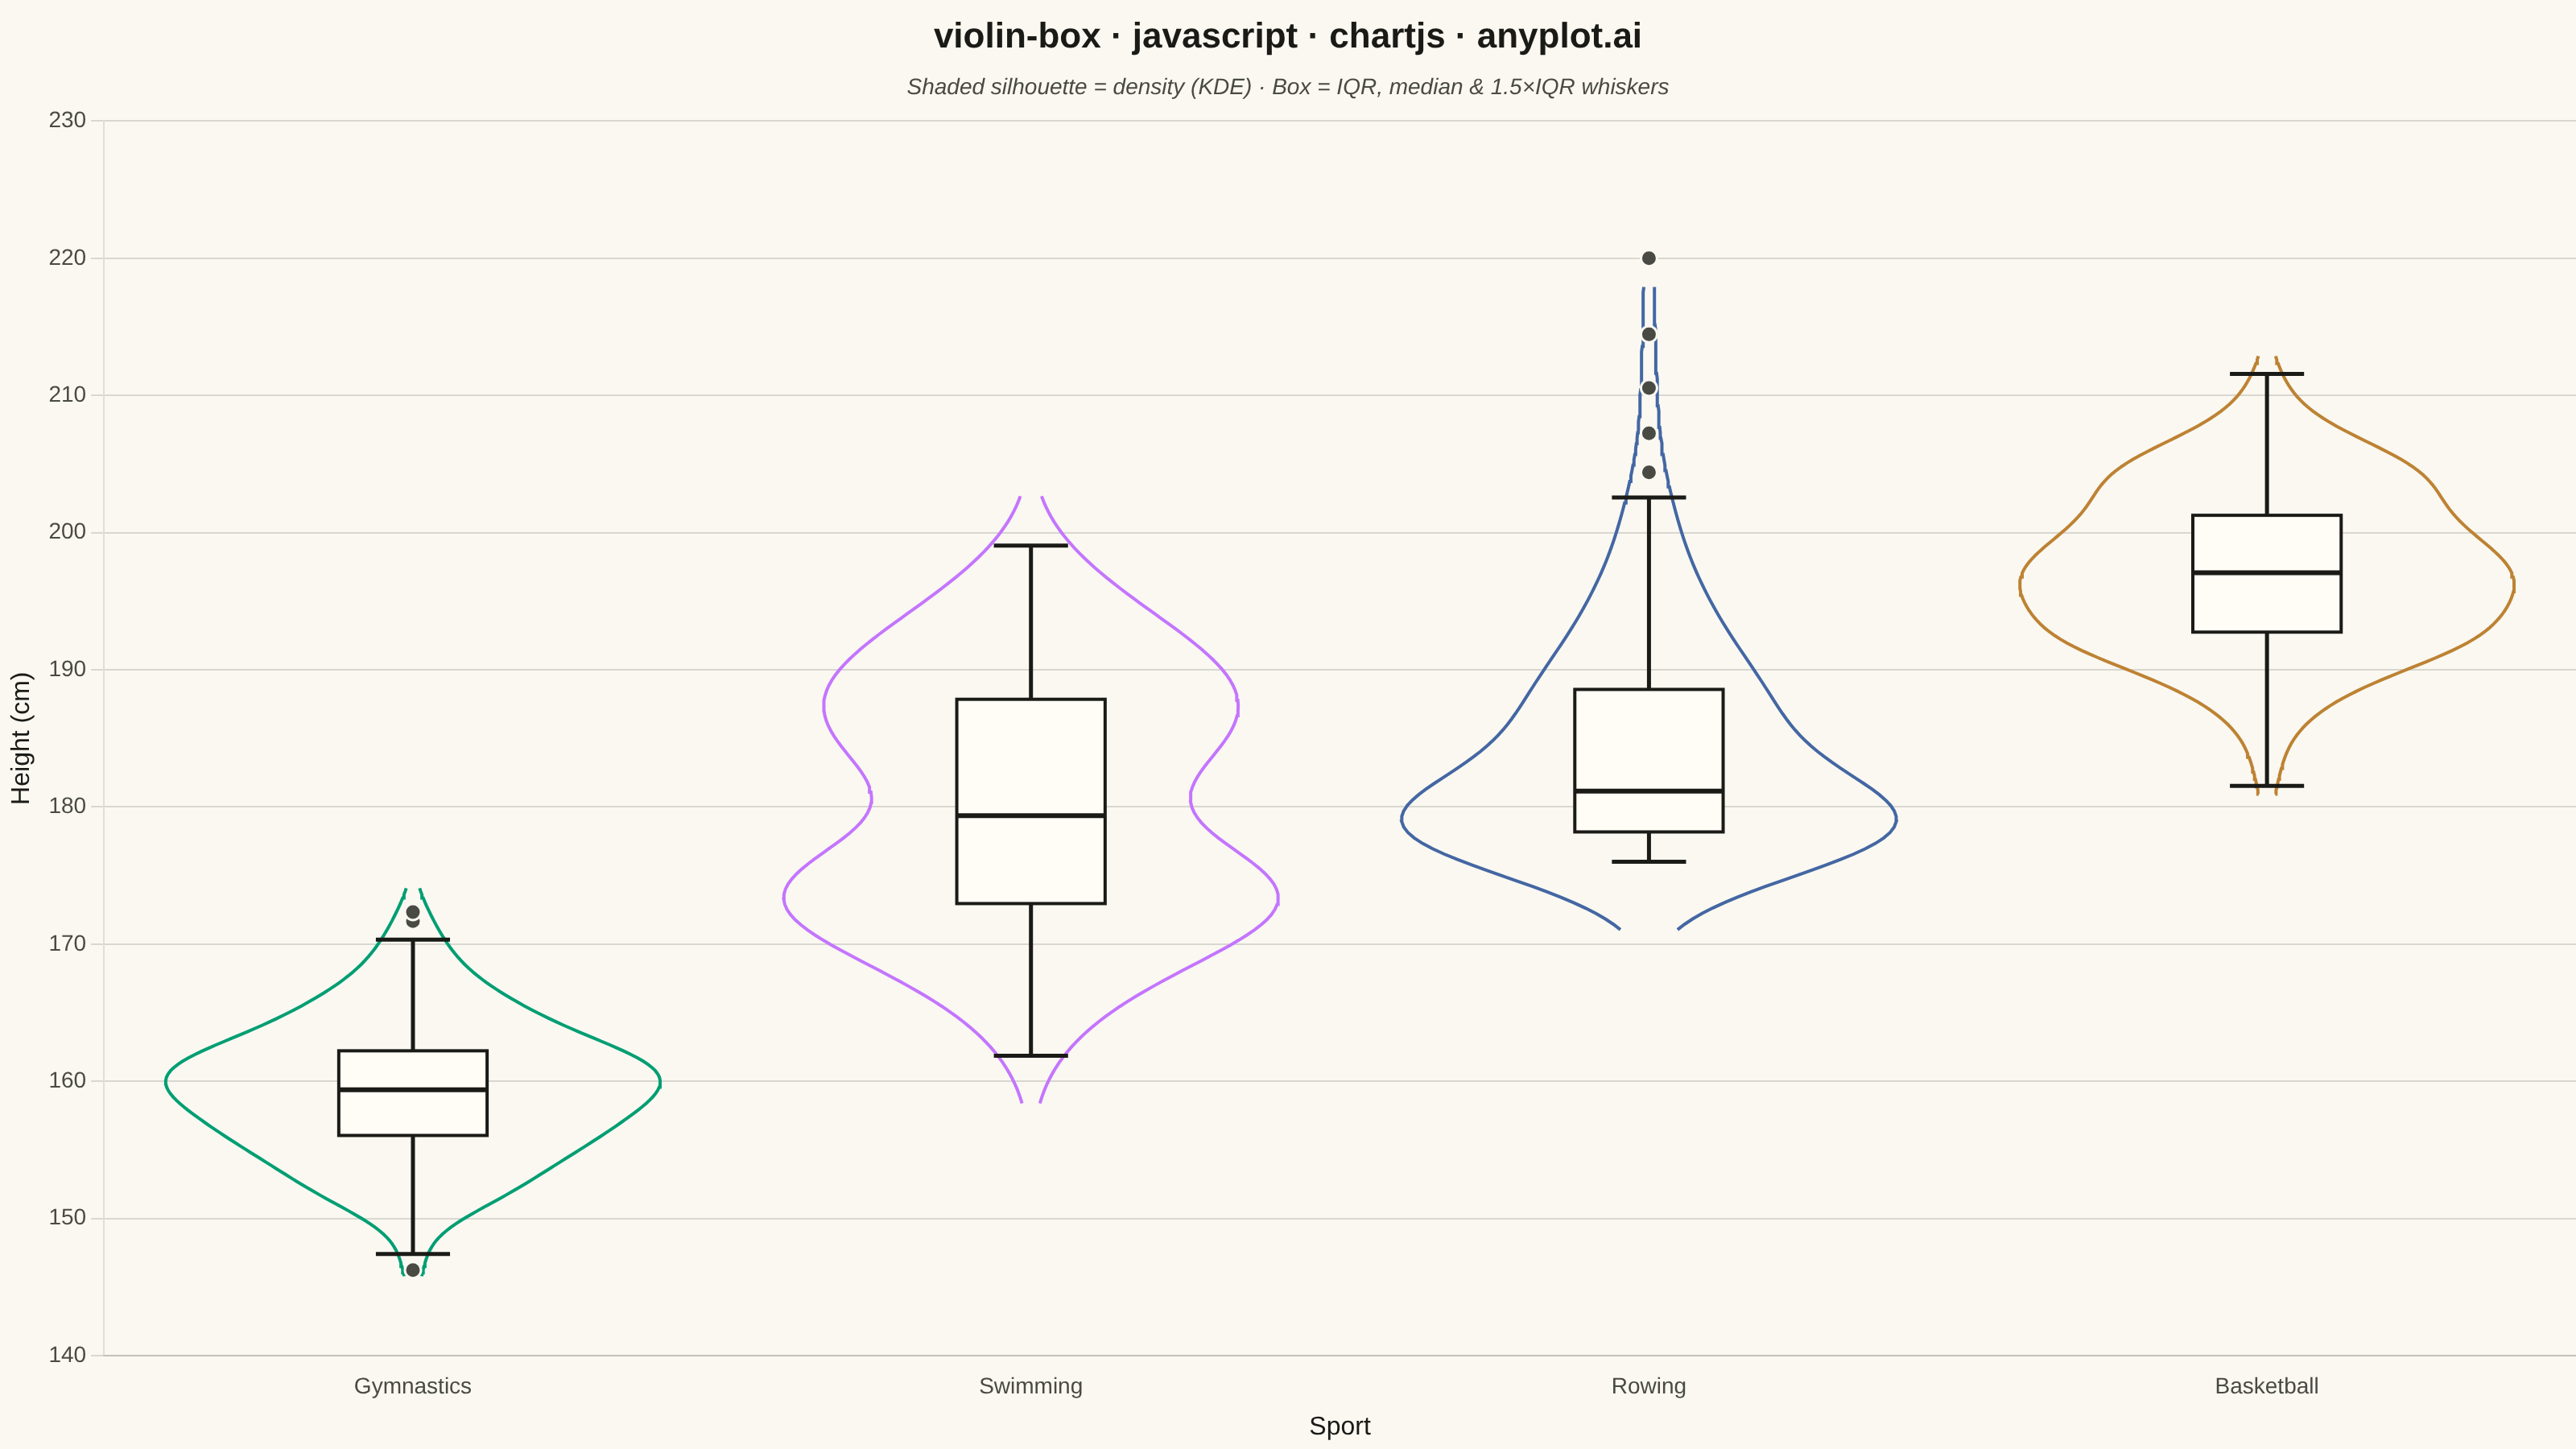
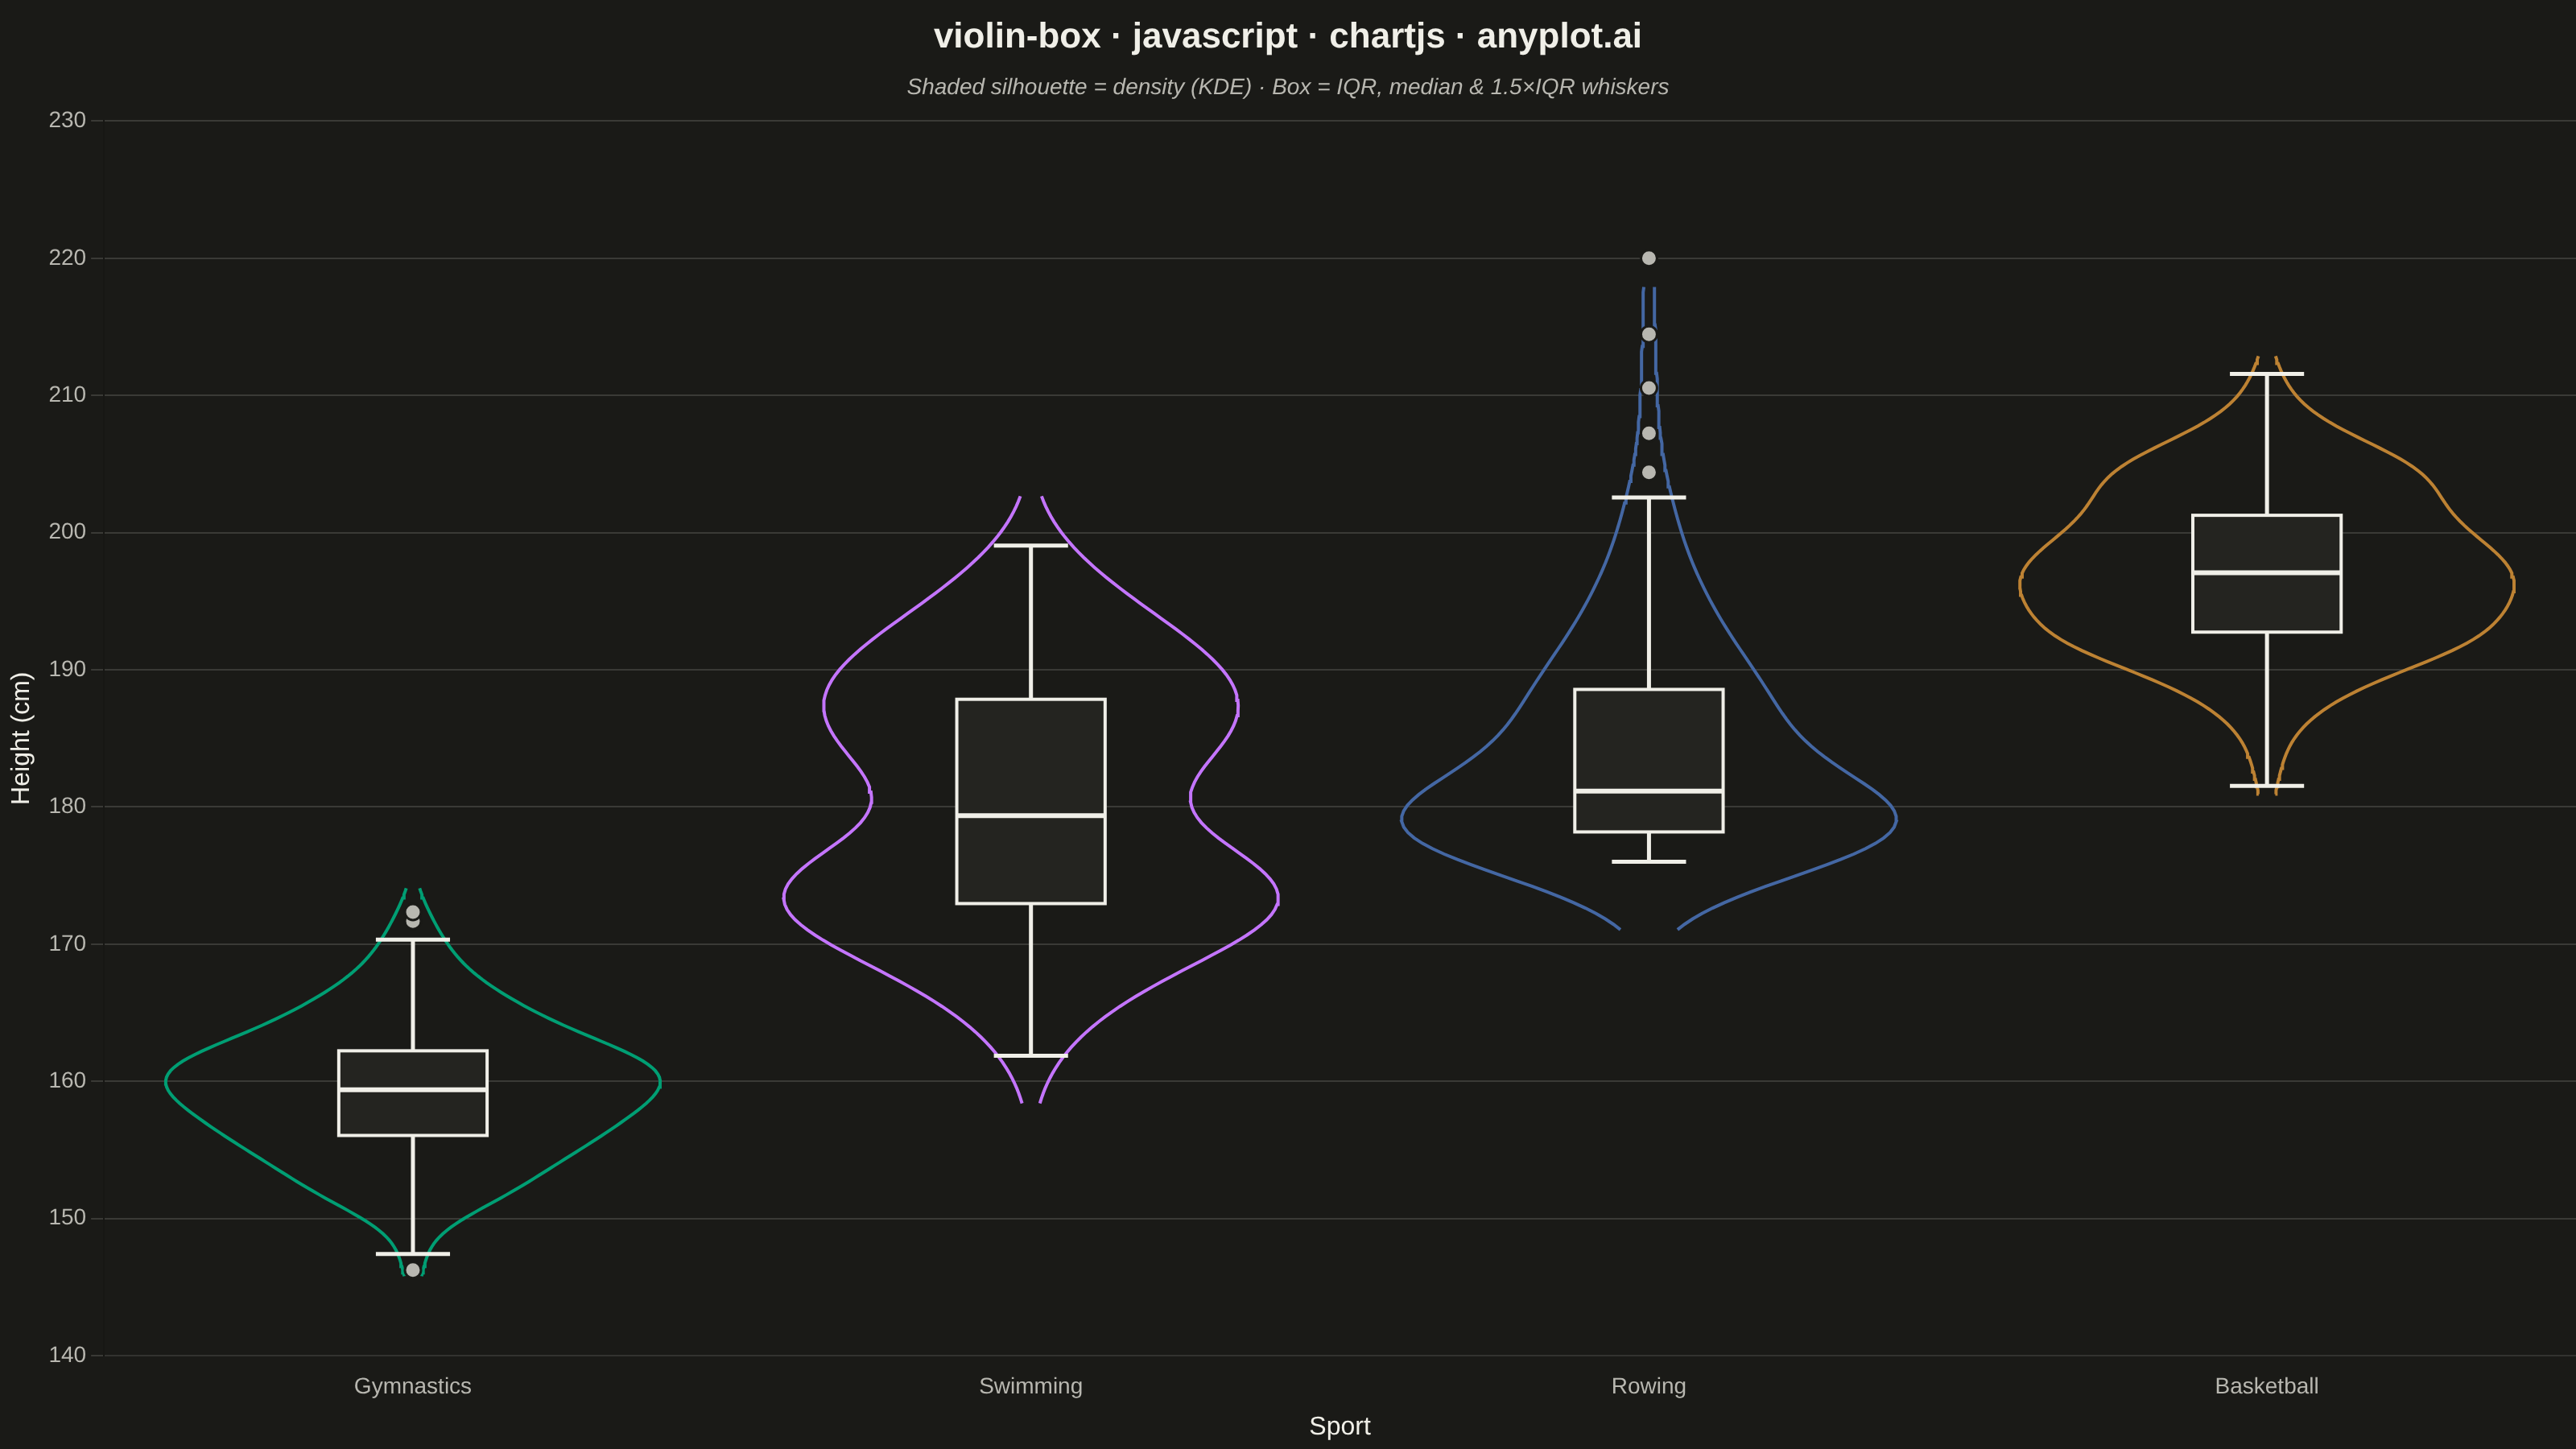
A violin plot with an embedded box plot inside, combining the distribution shape visualization (KDE) with traditional quartile statistics. Shows both the probability density and summary statistics in one plot.
Preview render from the Chart.js implementation.