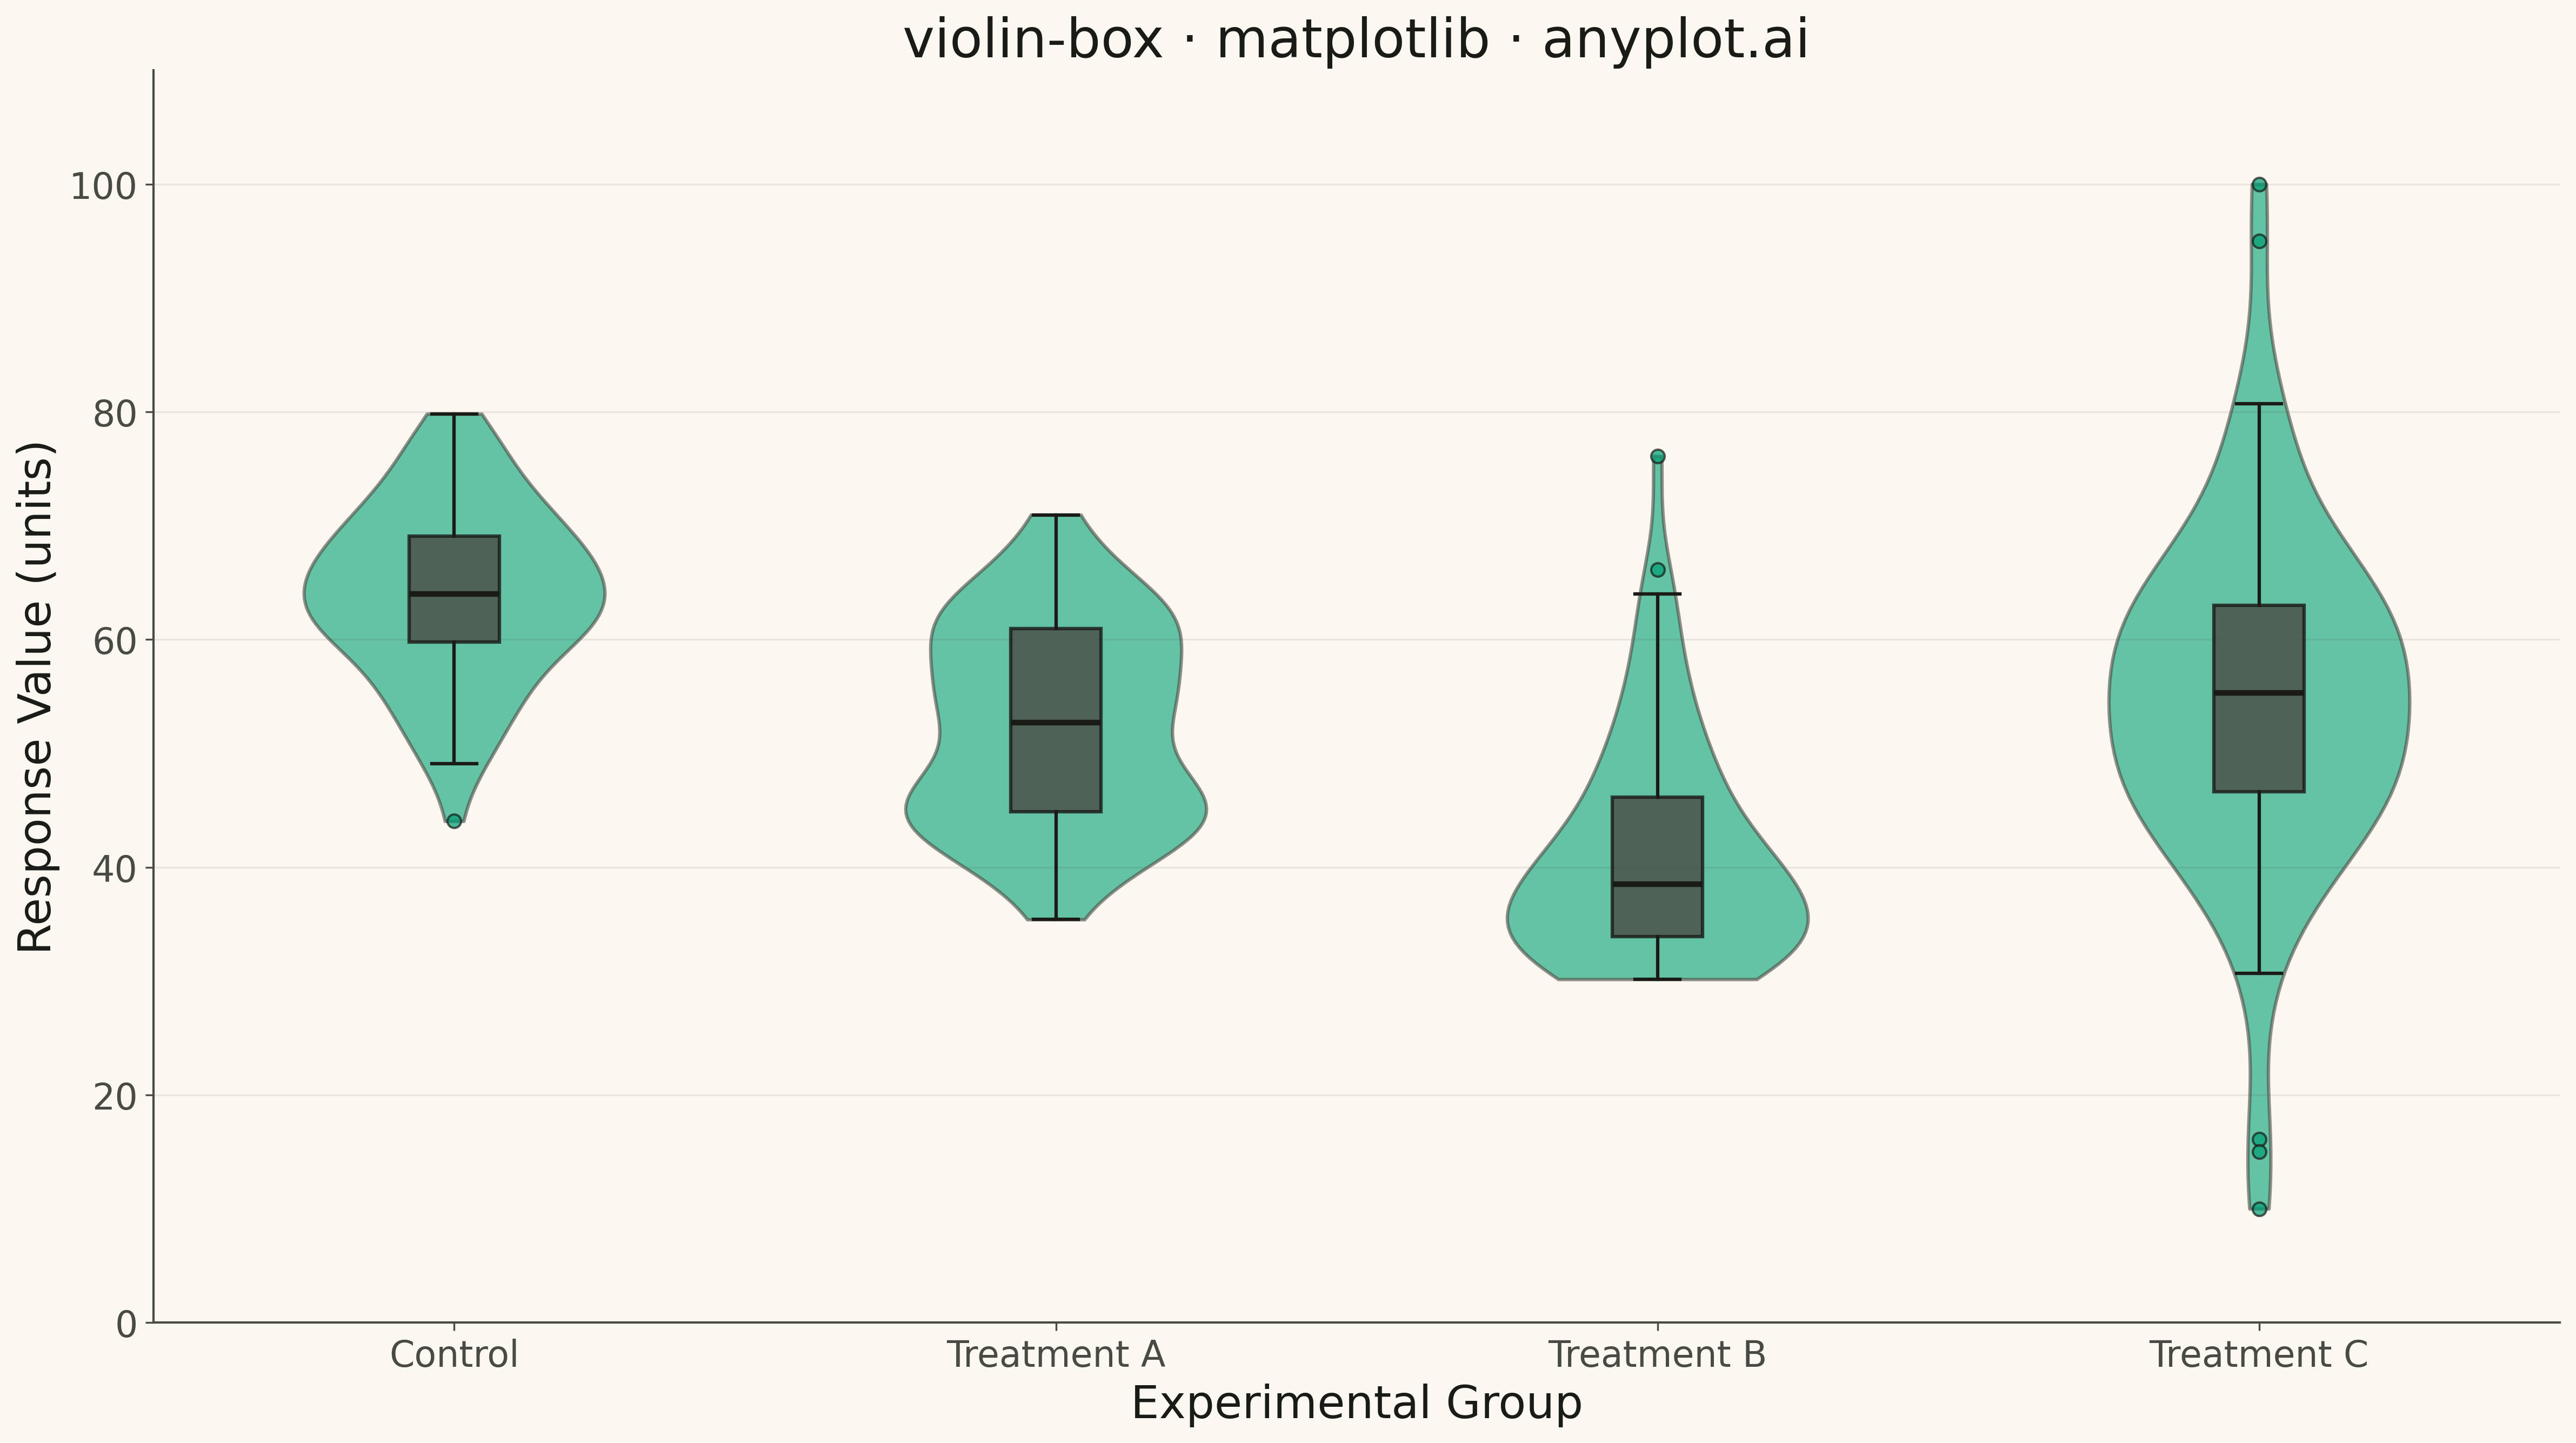
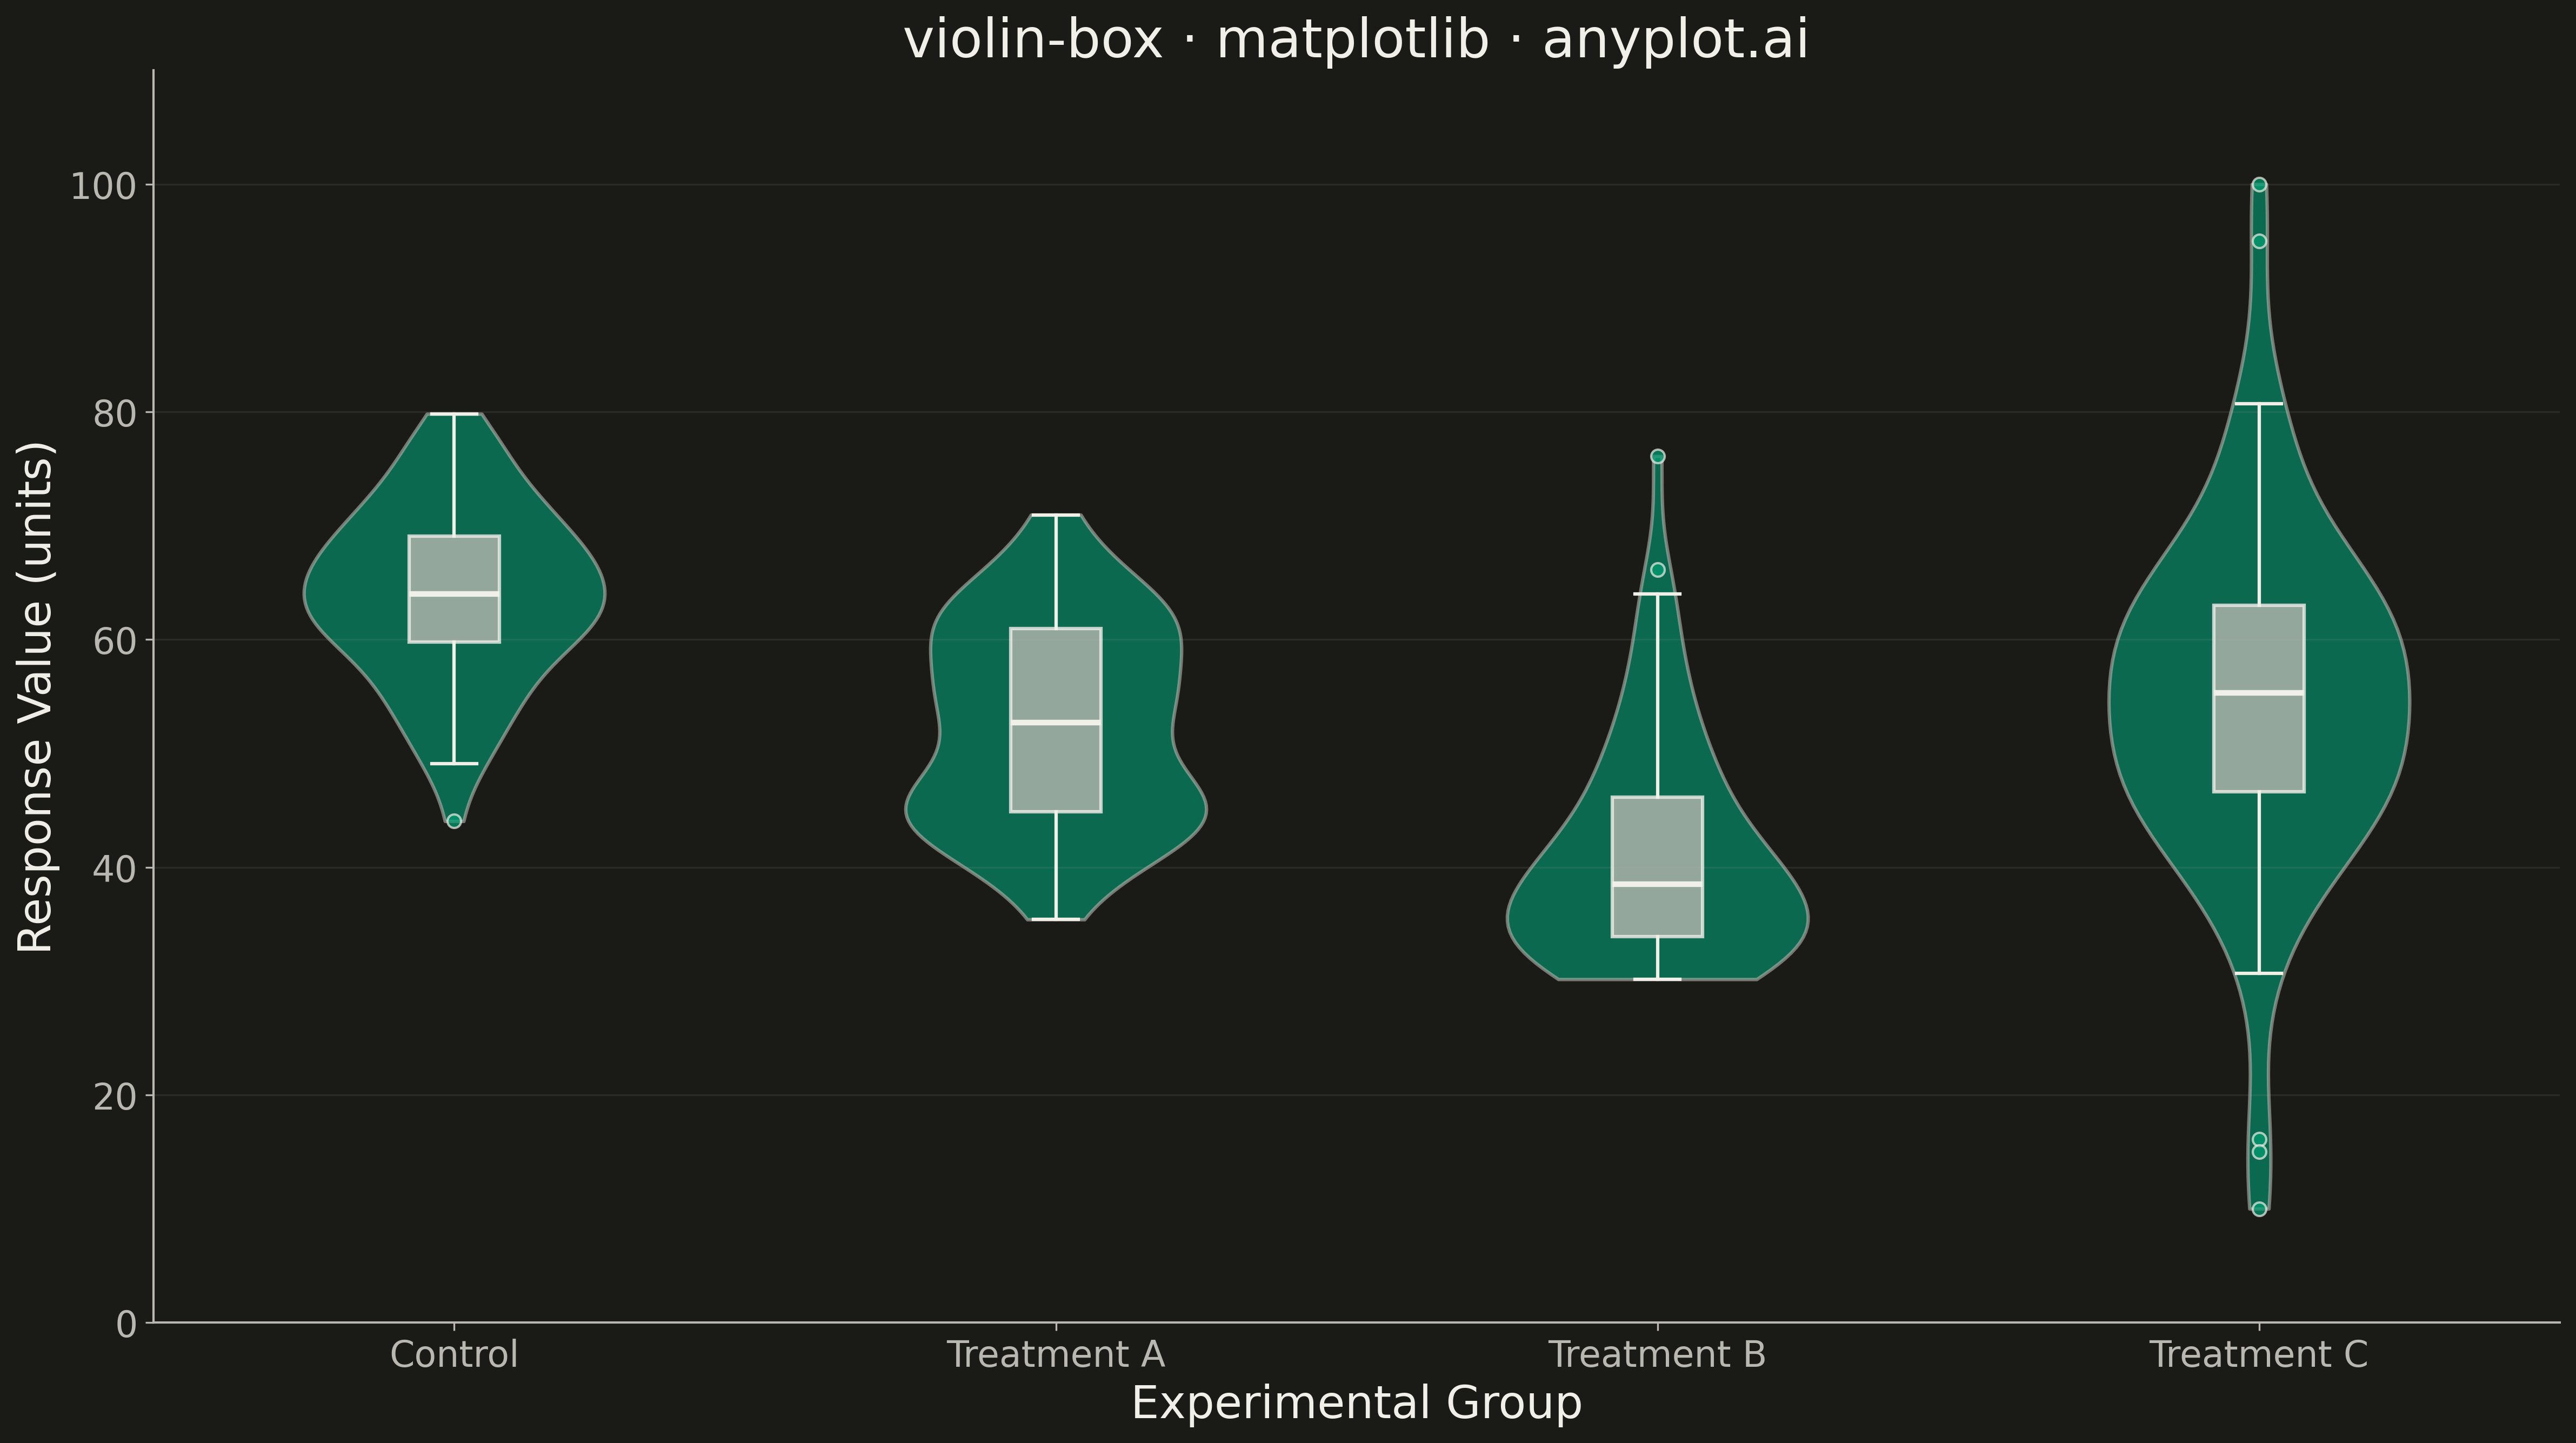
A violin plot with an embedded box plot inside, combining the distribution shape visualization (KDE) with traditional quartile statistics. Shows both the probability density and summary statistics in one plot.
""" anyplot.ai
violin-box: Violin Plot with Embedded Box Plot
Library: matplotlib 3.10.9 | Python 3.13.13
Quality: 90/100 | Updated: 2026-05-12
"""

import os

import matplotlib.pyplot as plt
import numpy as np


# Theme tokens
THEME = os.getenv("ANYPLOT_THEME", "light")
PAGE_BG = "#FAF8F1" if THEME == "light" else "#1A1A17"
INK = "#1A1A17" if THEME == "light" else "#F0EFE8"
INK_SOFT = "#4A4A44" if THEME == "light" else "#B8B7B0"
BRAND = "#009E73"

# Data - Generate groups with different distributions
np.random.seed(42)

# Four groups with varying distributions to showcase violin+box features
group_a = np.random.normal(65, 8, 80)  # Symmetric
group_b = np.concatenate([np.random.normal(45, 5, 40), np.random.normal(60, 5, 40)])  # Bimodal
group_c = np.random.exponential(10, 80) + 30  # Right-skewed
group_d = np.random.normal(55, 12, 80)  # Wide spread with outliers
group_d = np.append(group_d, [95, 100, 15, 10])  # Add outliers

data = [group_a, group_b, group_c, group_d]
labels = ["Control", "Treatment A", "Treatment B", "Treatment C"]

# Plot
fig, ax = plt.subplots(figsize=(16, 9), facecolor=PAGE_BG)
ax.set_facecolor(PAGE_BG)

# Plot violins
positions = np.arange(1, len(data) + 1)
violin_parts = ax.violinplot(data, positions=positions, showmeans=False, showmedians=False, showextrema=False)

# Style violins with brand color
for body in violin_parts["bodies"]:
    body.set_facecolor(BRAND)
    body.set_edgecolor(INK_SOFT)
    body.set_alpha(0.6)
    body.set_linewidth(1.5)

# Overlay box plots inside violins
box_parts = ax.boxplot(
    data, positions=positions, widths=0.15, patch_artist=True, tick_labels=labels, showfliers=True, zorder=3
)

# Style box plots
for patch in box_parts["boxes"]:
    patch.set_facecolor(INK_SOFT)
    patch.set_edgecolor(INK)
    patch.set_linewidth(1.5)
    patch.set_alpha(0.8)

for whisker in box_parts["whiskers"]:
    whisker.set_color(INK)
    whisker.set_linewidth(1.5)

for cap in box_parts["caps"]:
    cap.set_color(INK)
    cap.set_linewidth(1.5)

for median in box_parts["medians"]:
    median.set_color(INK)
    median.set_linewidth(2.5)

for flier in box_parts["fliers"]:
    flier.set(marker="o", markerfacecolor=BRAND, markeredgecolor=INK, markersize=6, alpha=0.7)

# Style
ax.set_xlabel("Experimental Group", fontsize=20, color=INK)
ax.set_ylabel("Response Value (units)", fontsize=20, color=INK)
ax.set_title("violin-box · matplotlib · anyplot.ai", fontsize=24, fontweight="medium", color=INK)
ax.tick_params(axis="both", labelsize=16, colors=INK_SOFT)
ax.spines["top"].set_visible(False)
ax.spines["right"].set_visible(False)
for s in ("left", "bottom"):
    ax.spines[s].set_color(INK_SOFT)
    ax.spines[s].set_linewidth(1)
ax.yaxis.grid(True, alpha=0.10, linewidth=0.8, color=INK_SOFT)

# Set y-axis range to accommodate all data
ax.set_ylim(0, 110)

plt.tight_layout()
plt.savefig(f"plot-{THEME}.png", dpi=300, bbox_inches="tight", facecolor=PAGE_BG)
Runnable source as JSON, for any HTTP client: https://api.anyplot.ai/specs/violin-box/matplotlib/code. Any spec id and library id listed in llms-full.txt fit the same URL shape; every URL below is complete and callable.
{
  "spec_id": "violin-box",
  "language": "python",
  "library": "matplotlib",
  "page": "https://anyplot.ai/violin-box/python/matplotlib",
  "hub": "https://anyplot.ai/violin-box",
  "code_json": "https://api.anyplot.ai/specs/violin-box/matplotlib/code",
  "spec_json": "https://api.anyplot.ai/specs/violin-box",
  "render_light_png": "https://storage.googleapis.com/anyplot-images/plots/violin-box/python/matplotlib/plot-light.png",
  "render_dark_png": "https://storage.googleapis.com/anyplot-images/plots/violin-box/python/matplotlib/plot-dark.png",
  "quality_score": 90.0,
  "license": "MIT",
  "guide": "https://anyplot.ai/llms.txt"
}
Part of Violin Plot with Embedded Box Plot on anyplot.ai.