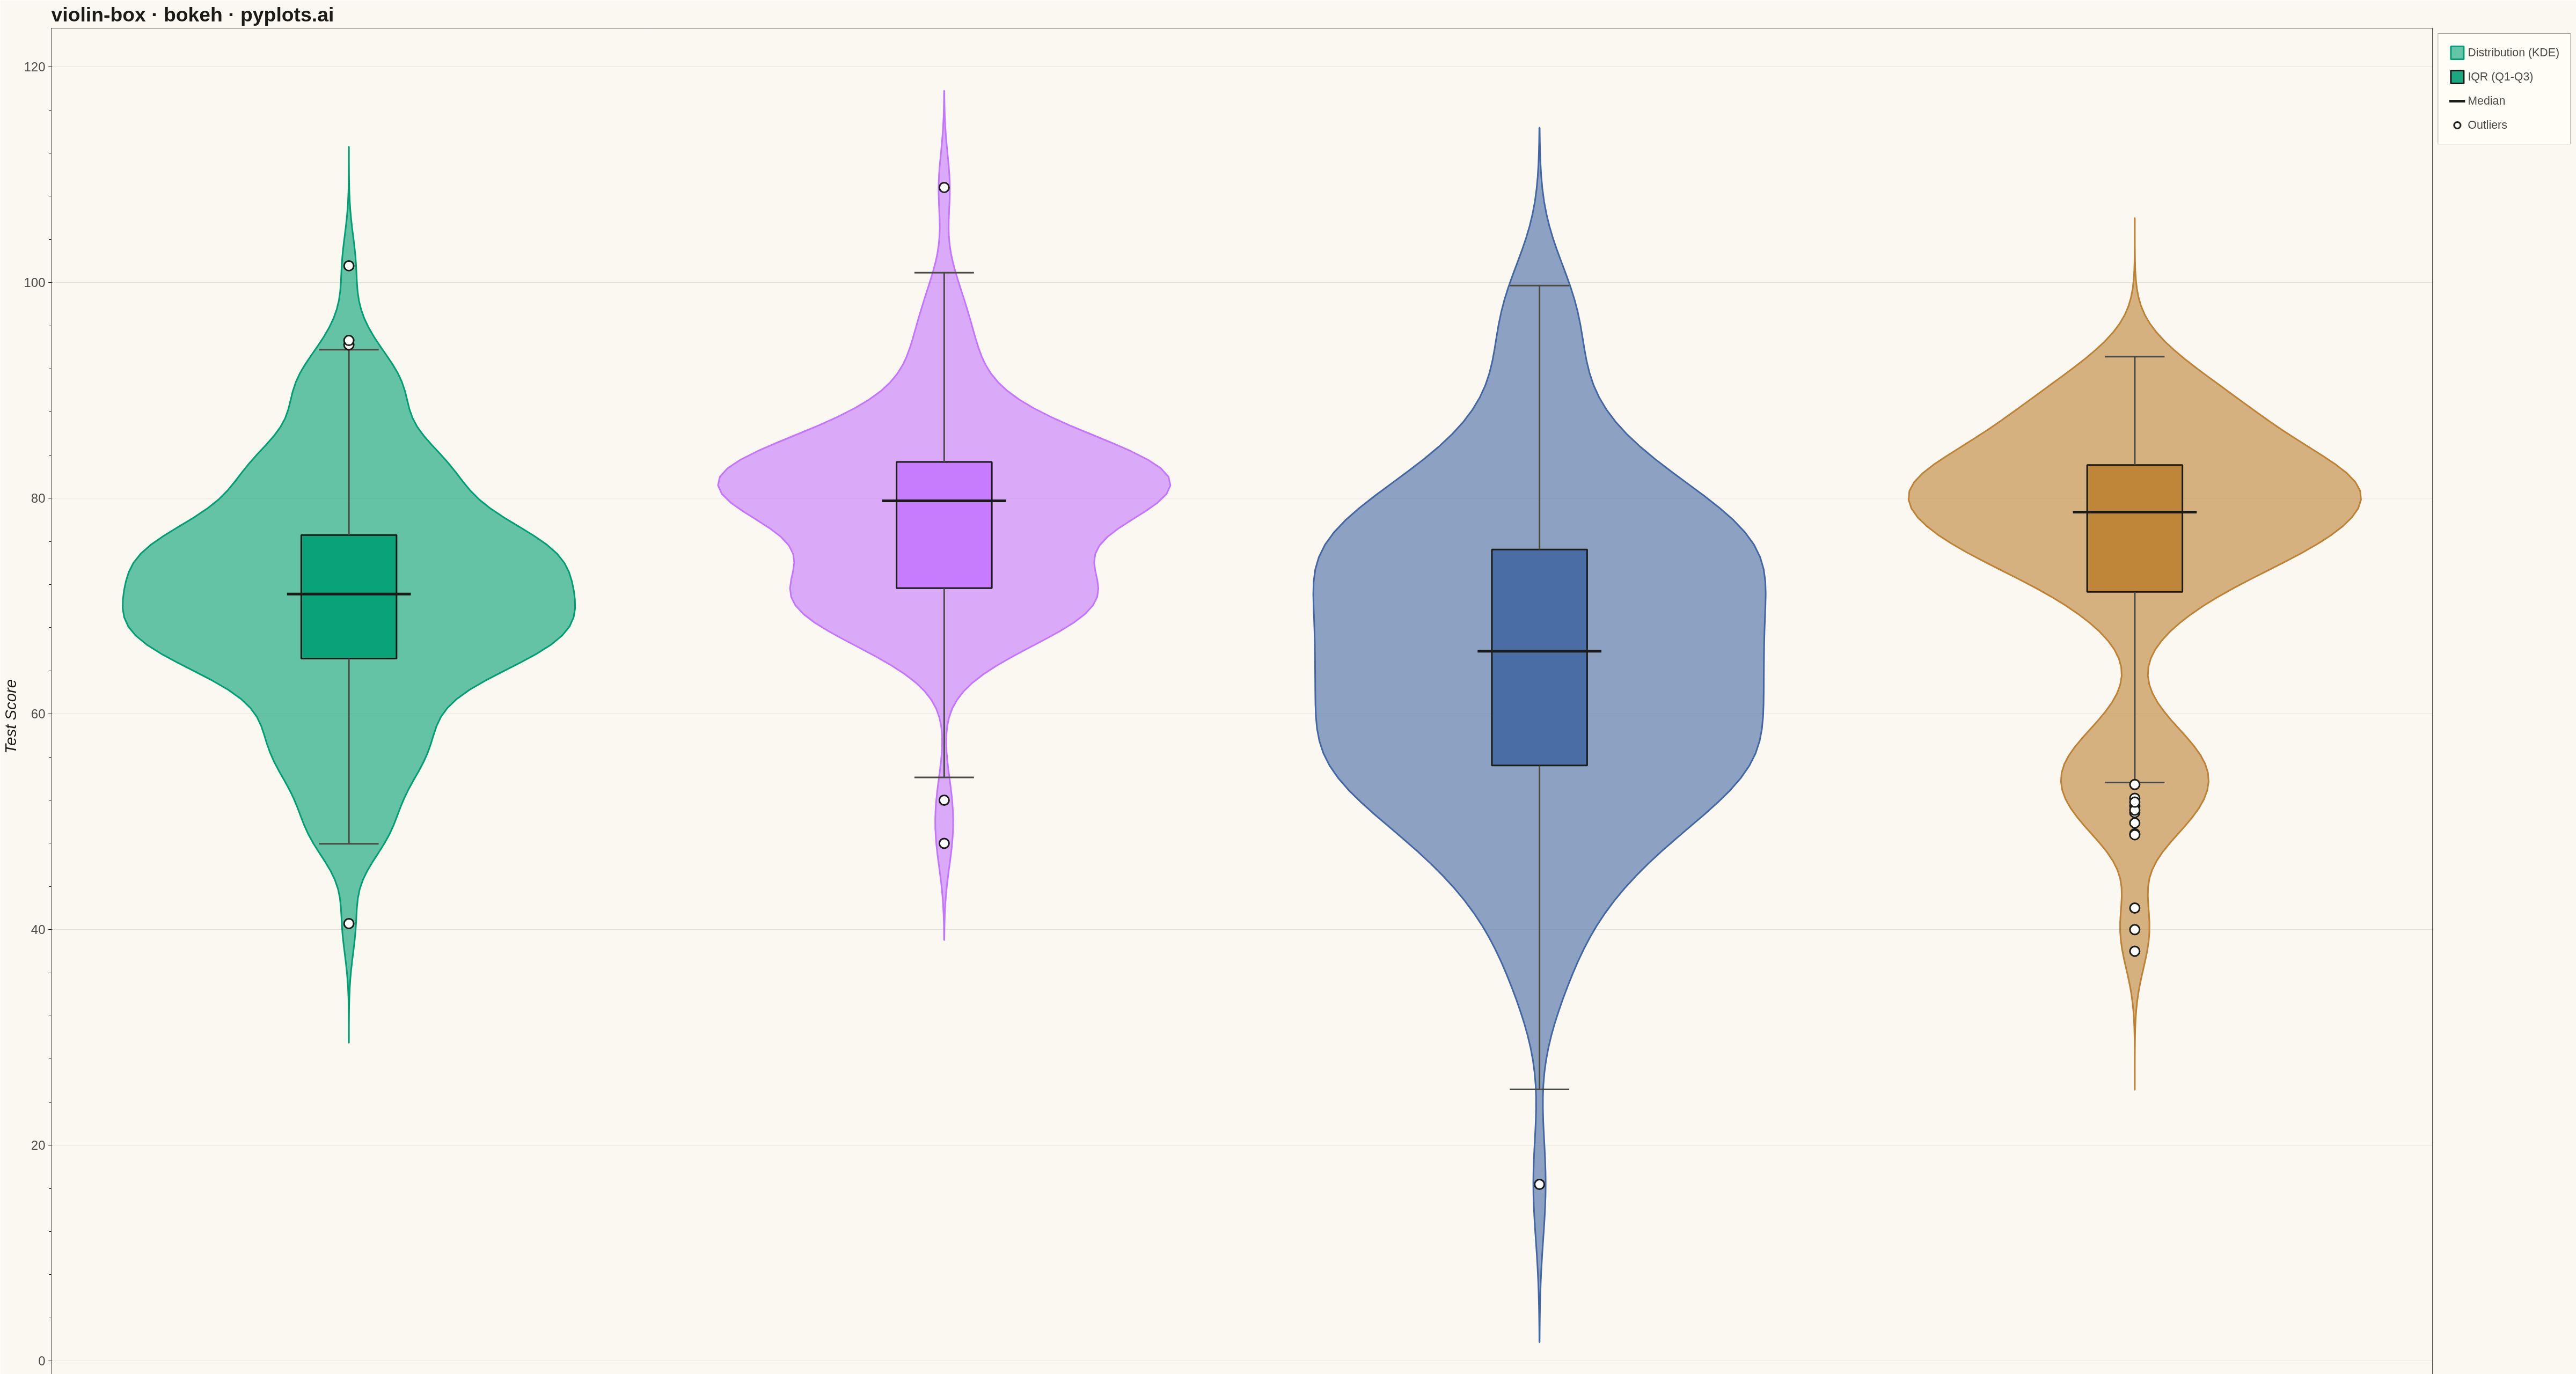
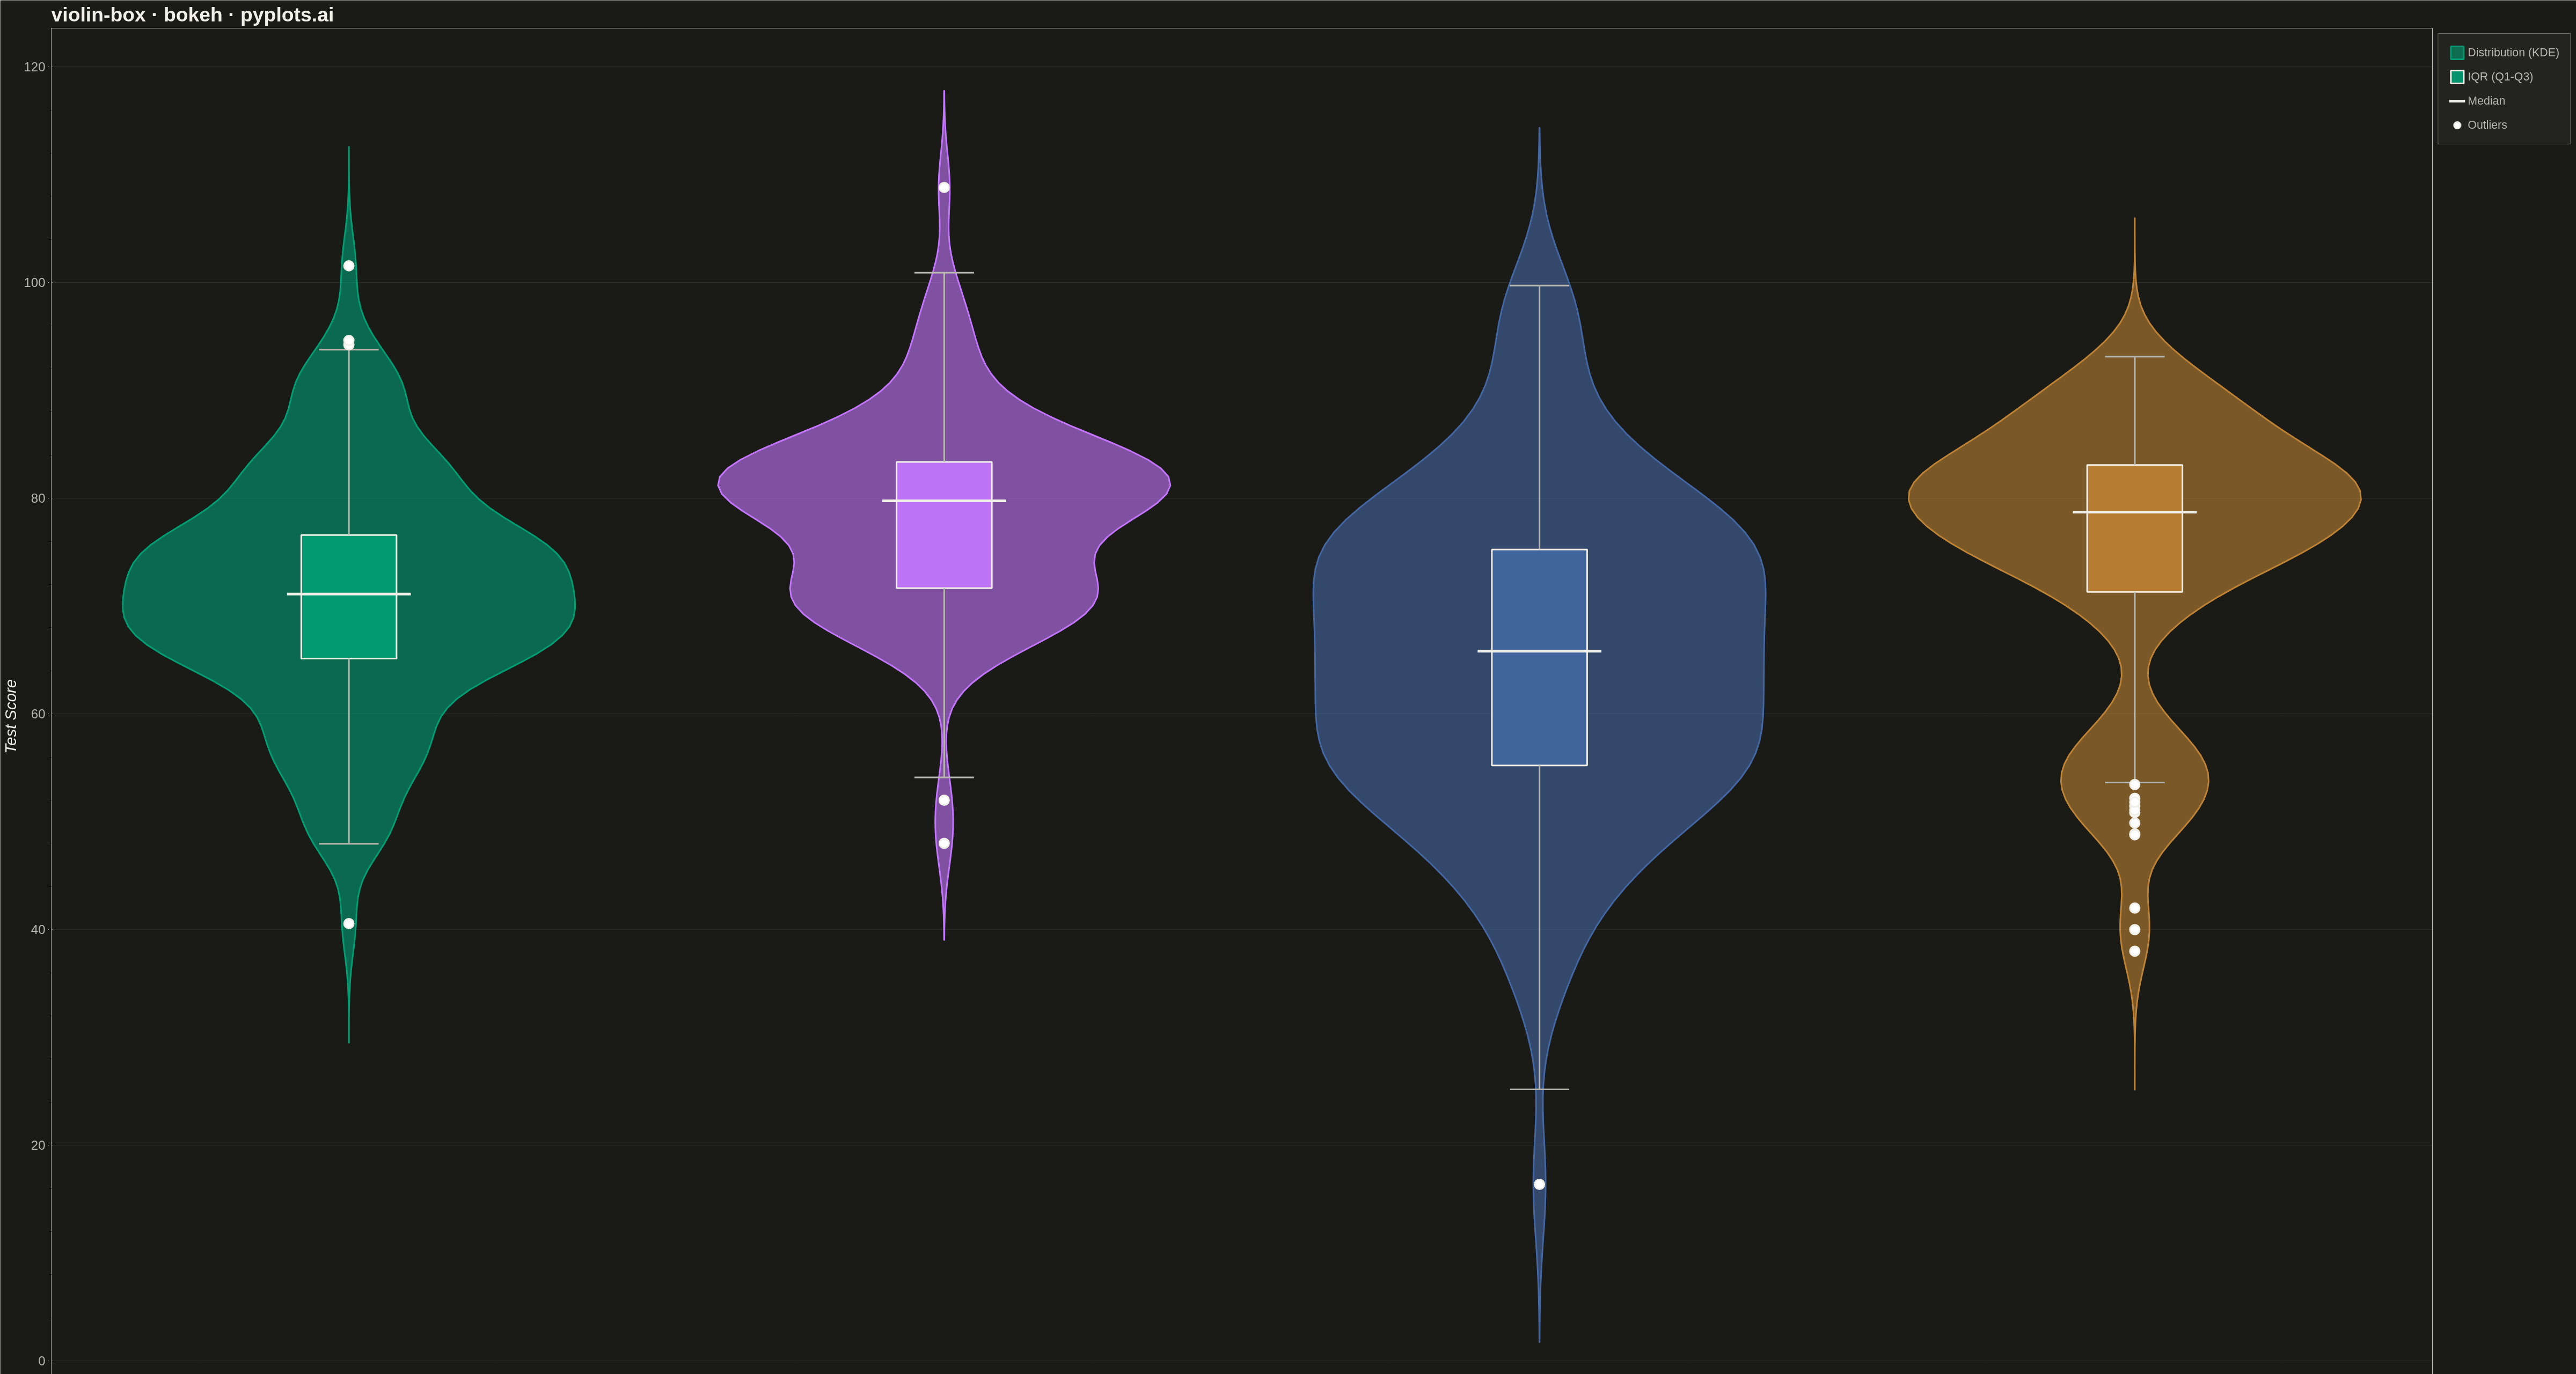
A violin plot with an embedded box plot inside, combining the distribution shape visualization (KDE) with traditional quartile statistics. Shows both the probability density and summary statistics in one plot.
""" anyplot.ai
violin-box: Violin Plot with Embedded Box Plot
Library: bokeh 3.9.0 | Python 3.13.13
Quality: 90/100 | Updated: 2026-05-12
"""

import os
import time
from pathlib import Path

import numpy as np
from bokeh.io import output_file, save
from bokeh.models import ColumnDataSource, Legend, LegendItem
from bokeh.plotting import figure
from selenium import webdriver
from selenium.webdriver.chrome.options import Options


# Theme tokens (see prompts/default-style-guide.md)
THEME = os.getenv("ANYPLOT_THEME", "light")
PAGE_BG = "#FAF8F1" if THEME == "light" else "#1A1A17"
ELEVATED_BG = "#FFFDF6" if THEME == "light" else "#242420"
INK = "#1A1A17" if THEME == "light" else "#F0EFE8"
INK_SOFT = "#4A4A44" if THEME == "light" else "#B8B7B0"

# Okabe-Ito palette - first series is always #009E73
IMPRINT = [
    "#009E73",  # bluish green - first series
    "#C475FD",  # vermillion
    "#4467A3",  # blue
    "#BD8233",  # reddish purple
]

# Data - Test scores by study method (educational context)
np.random.seed(42)
categories = ["Method A", "Method B", "Method C", "Method D"]

# Create distributions with different characteristics to showcase features
data = {
    "Method A": np.random.normal(72, 12, 120),  # Standard distribution
    "Method B": np.concatenate(
        [
            np.random.normal(78, 8, 100),  # Main group
            np.array([48, 52, 95, 98]),  # Outliers both ends
        ]
    ),
    "Method C": np.random.normal(65, 15, 120),  # Wider spread
    "Method D": np.concatenate(
        [
            np.random.normal(80, 6, 90),  # Tight main group
            np.random.normal(55, 3, 20),  # Bimodal lower group
            np.array([38, 40, 42]),  # Low outliers
        ]
    ),
}

# Create figure with categorical x-axis
p = figure(
    width=4800,
    height=2700,
    title="violin-box · bokeh · pyplots.ai",
    x_axis_label="Study Method",
    y_axis_label="Test Score",
    x_range=categories,
    toolbar_location=None,
)

# Theme-adaptive styling
p.background_fill_color = PAGE_BG
p.border_fill_color = PAGE_BG
p.outline_line_color = INK_SOFT

p.title.text_color = INK
p.title.text_font_size = "28pt"

p.xaxis.axis_label_text_color = INK
p.xaxis.axis_label_text_font_size = "22pt"
p.yaxis.axis_label_text_color = INK
p.yaxis.axis_label_text_font_size = "22pt"

p.xaxis.major_label_text_color = INK_SOFT
p.xaxis.major_label_text_font_size = "18pt"
p.yaxis.major_label_text_color = INK_SOFT
p.yaxis.major_label_text_font_size = "18pt"

p.xaxis.axis_line_color = INK_SOFT
p.yaxis.axis_line_color = INK_SOFT
p.xaxis.major_tick_line_color = INK_SOFT
p.yaxis.major_tick_line_color = INK_SOFT

# Grid styling - subtle
p.xgrid.grid_line_color = None
p.ygrid.grid_line_color = INK
p.ygrid.grid_line_alpha = 0.10
p.ygrid.grid_line_dash = "solid"

# Violin width scaling (0.4 = 40% of category spacing)
violin_width = 0.38

# Track renderers for legend
violin_renderer = None
box_renderer = None
median_renderer = None
outlier_renderer = None

# Collect outlier data for all categories
all_outliers_x = []
all_outliers_y = []

# Draw violins with embedded box plots for each category
for i, cat in enumerate(categories):
    values = np.array(data[cat])
    n = len(values)

    # Compute KDE using Gaussian kernel (Silverman's rule for bandwidth)
    std = np.std(values)
    iqr = np.percentile(values, 75) - np.percentile(values, 25)
    bandwidth = 0.9 * min(std, iqr / 1.34) * n ** (-0.2)
    bandwidth = max(bandwidth, 0.1)

    y_grid = np.linspace(values.min() - std, values.max() + std, 100)
    density = np.zeros_like(y_grid, dtype=float)
    for xi in values:
        density += np.exp(-0.5 * ((y_grid - xi) / bandwidth) ** 2)
    density /= n * bandwidth * np.sqrt(2 * np.pi)

    # Scale density to violin width
    density_scaled = density / density.max() * violin_width

    # Create violin shape (mirrored on both sides)
    x_left = -density_scaled
    x_right = density_scaled

    # Convert to categorical offset format for bokeh
    xs_left = [(cat, float(xl)) for xl in x_left]
    xs_right = [(cat, float(xr)) for xr in x_right[::-1]]

    # Draw violin patch with Okabe-Ito color
    violin_color = IMPRINT[i % len(IMPRINT)]
    vr = p.patch(
        xs_left + xs_right,
        list(y_grid) + list(y_grid[::-1]),
        fill_color=violin_color,
        fill_alpha=0.6,
        line_color=violin_color,
        line_width=3,
    )
    if violin_renderer is None:
        violin_renderer = vr

    # Compute box plot statistics
    q1 = np.percentile(values, 25)
    median = np.percentile(values, 50)
    q3 = np.percentile(values, 75)
    iqr_val = q3 - q1
    whisker_low = max(values.min(), q1 - 1.5 * iqr_val)
    whisker_high = min(values.max(), q3 + 1.5 * iqr_val)

    # Draw box inside violin (IQR from Q1 to Q3)
    box_width = 0.08
    box_fill_color = violin_color  # Same color as violin
    br = p.quad(
        left=[(cat, -box_width)],
        right=[(cat, box_width)],
        top=[q3],
        bottom=[q1],
        fill_color=box_fill_color,
        fill_alpha=0.9,
        line_color=INK,
        line_width=3,
    )
    if box_renderer is None:
        box_renderer = br

    # Draw median line
    mr = p.segment(
        x0=[(cat, -box_width * 1.3)],
        y0=[median],
        x1=[(cat, box_width * 1.3)],
        y1=[median],
        line_color=INK,
        line_width=5,
    )
    if median_renderer is None:
        median_renderer = mr

    # Whiskers (vertical lines from box to whisker limits)
    p.segment(x0=[cat], y0=[q1], x1=[cat], y1=[whisker_low], line_color=INK_SOFT, line_width=3)
    p.segment(x0=[cat], y0=[q3], x1=[cat], y1=[whisker_high], line_color=INK_SOFT, line_width=3)

    # Whisker caps
    cap_width = 0.05
    p.segment(
        x0=[(cat, -cap_width)],
        y0=[whisker_low],
        x1=[(cat, cap_width)],
        y1=[whisker_low],
        line_color=INK_SOFT,
        line_width=3,
    )
    p.segment(
        x0=[(cat, -cap_width)],
        y0=[whisker_high],
        x1=[(cat, cap_width)],
        y1=[whisker_high],
        line_color=INK_SOFT,
        line_width=3,
    )

    # Collect outliers
    outliers = values[(values < whisker_low) | (values > whisker_high)]
    for out in outliers:
        all_outliers_x.append(cat)
        all_outliers_y.append(out)

# Draw all outliers
if len(all_outliers_x) > 0:
    outlier_source = ColumnDataSource(data={"x": all_outliers_x, "y": all_outliers_y})
    outlier_renderer = p.scatter(
        x="x", y="y", source=outlier_source, size=18, fill_color="white", line_color=INK, line_width=3, marker="circle"
    )

# Create legend
legend_items = [
    LegendItem(label="Distribution (KDE)", renderers=[violin_renderer]),
    LegendItem(label="IQR (Q1-Q3)", renderers=[box_renderer]),
    LegendItem(label="Median", renderers=[median_renderer]),
]
if outlier_renderer is not None:
    legend_items.append(LegendItem(label="Outliers", renderers=[outlier_renderer]))

legend = Legend(items=legend_items, location="top_right")
legend.label_text_color = INK_SOFT
legend.label_text_font_size = "16pt"
legend.background_fill_color = ELEVATED_BG
legend.border_line_color = INK_SOFT
legend.glyph_height = 30
legend.glyph_width = 30
legend.spacing = 15
legend.padding = 20
p.add_layout(legend, "right")

# Save HTML output
output_file(f"plot-{THEME}.html")
save(p)

# Screenshot with headless Chrome
W, H = 4800, 2700
opts = Options()
for arg in (
    "--headless=new",
    "--no-sandbox",
    "--disable-dev-shm-usage",
    "--disable-gpu",
    f"--window-size={W},{H}",
    "--hide-scrollbars",
):
    opts.add_argument(arg)

driver = webdriver.Chrome(options=opts)
driver.set_window_size(W, H)
driver.get(f"file://{Path(f'plot-{THEME}.html').resolve()}")
time.sleep(3)  # let bokeh's JS render the canvas
driver.save_screenshot(f"plot-{THEME}.png")
driver.quit()
Runnable source as JSON, for any HTTP client: https://api.anyplot.ai/specs/violin-box/bokeh/code. Any spec id and library id listed in llms-full.txt fit the same URL shape; every URL below is complete and callable.
{
  "spec_id": "violin-box",
  "language": "python",
  "library": "bokeh",
  "page": "https://anyplot.ai/violin-box/python/bokeh",
  "hub": "https://anyplot.ai/violin-box",
  "code_json": "https://api.anyplot.ai/specs/violin-box/bokeh/code",
  "spec_json": "https://api.anyplot.ai/specs/violin-box",
  "render_light_png": "https://storage.googleapis.com/anyplot-images/plots/violin-box/python/bokeh/plot-light.png",
  "render_dark_png": "https://storage.googleapis.com/anyplot-images/plots/violin-box/python/bokeh/plot-dark.png",
  "interactive_light_html": "https://storage.googleapis.com/anyplot-images/plots/violin-box/python/bokeh/plot-light.html",
  "interactive_dark_html": "https://storage.googleapis.com/anyplot-images/plots/violin-box/python/bokeh/plot-dark.html",
  "quality_score": 90.0,
  "license": "MIT",
  "guide": "https://anyplot.ai/llms.txt"
}
Part of Violin Plot with Embedded Box Plot on anyplot.ai.