The same plot in 14 other libraries — JavaScript: Chart.js, Apache ECharts, Highcharts, MUI X Charts; Python: Altair, Bokeh, lets-plot, Matplotlib, Plotly, plotnine, Pygal, Seaborn; R: ggplot2; Julia: Makie.jl. Compare all 15 side by side: Violin Plot with Embedded Box Plot in Python, R, Julia and JavaScript.
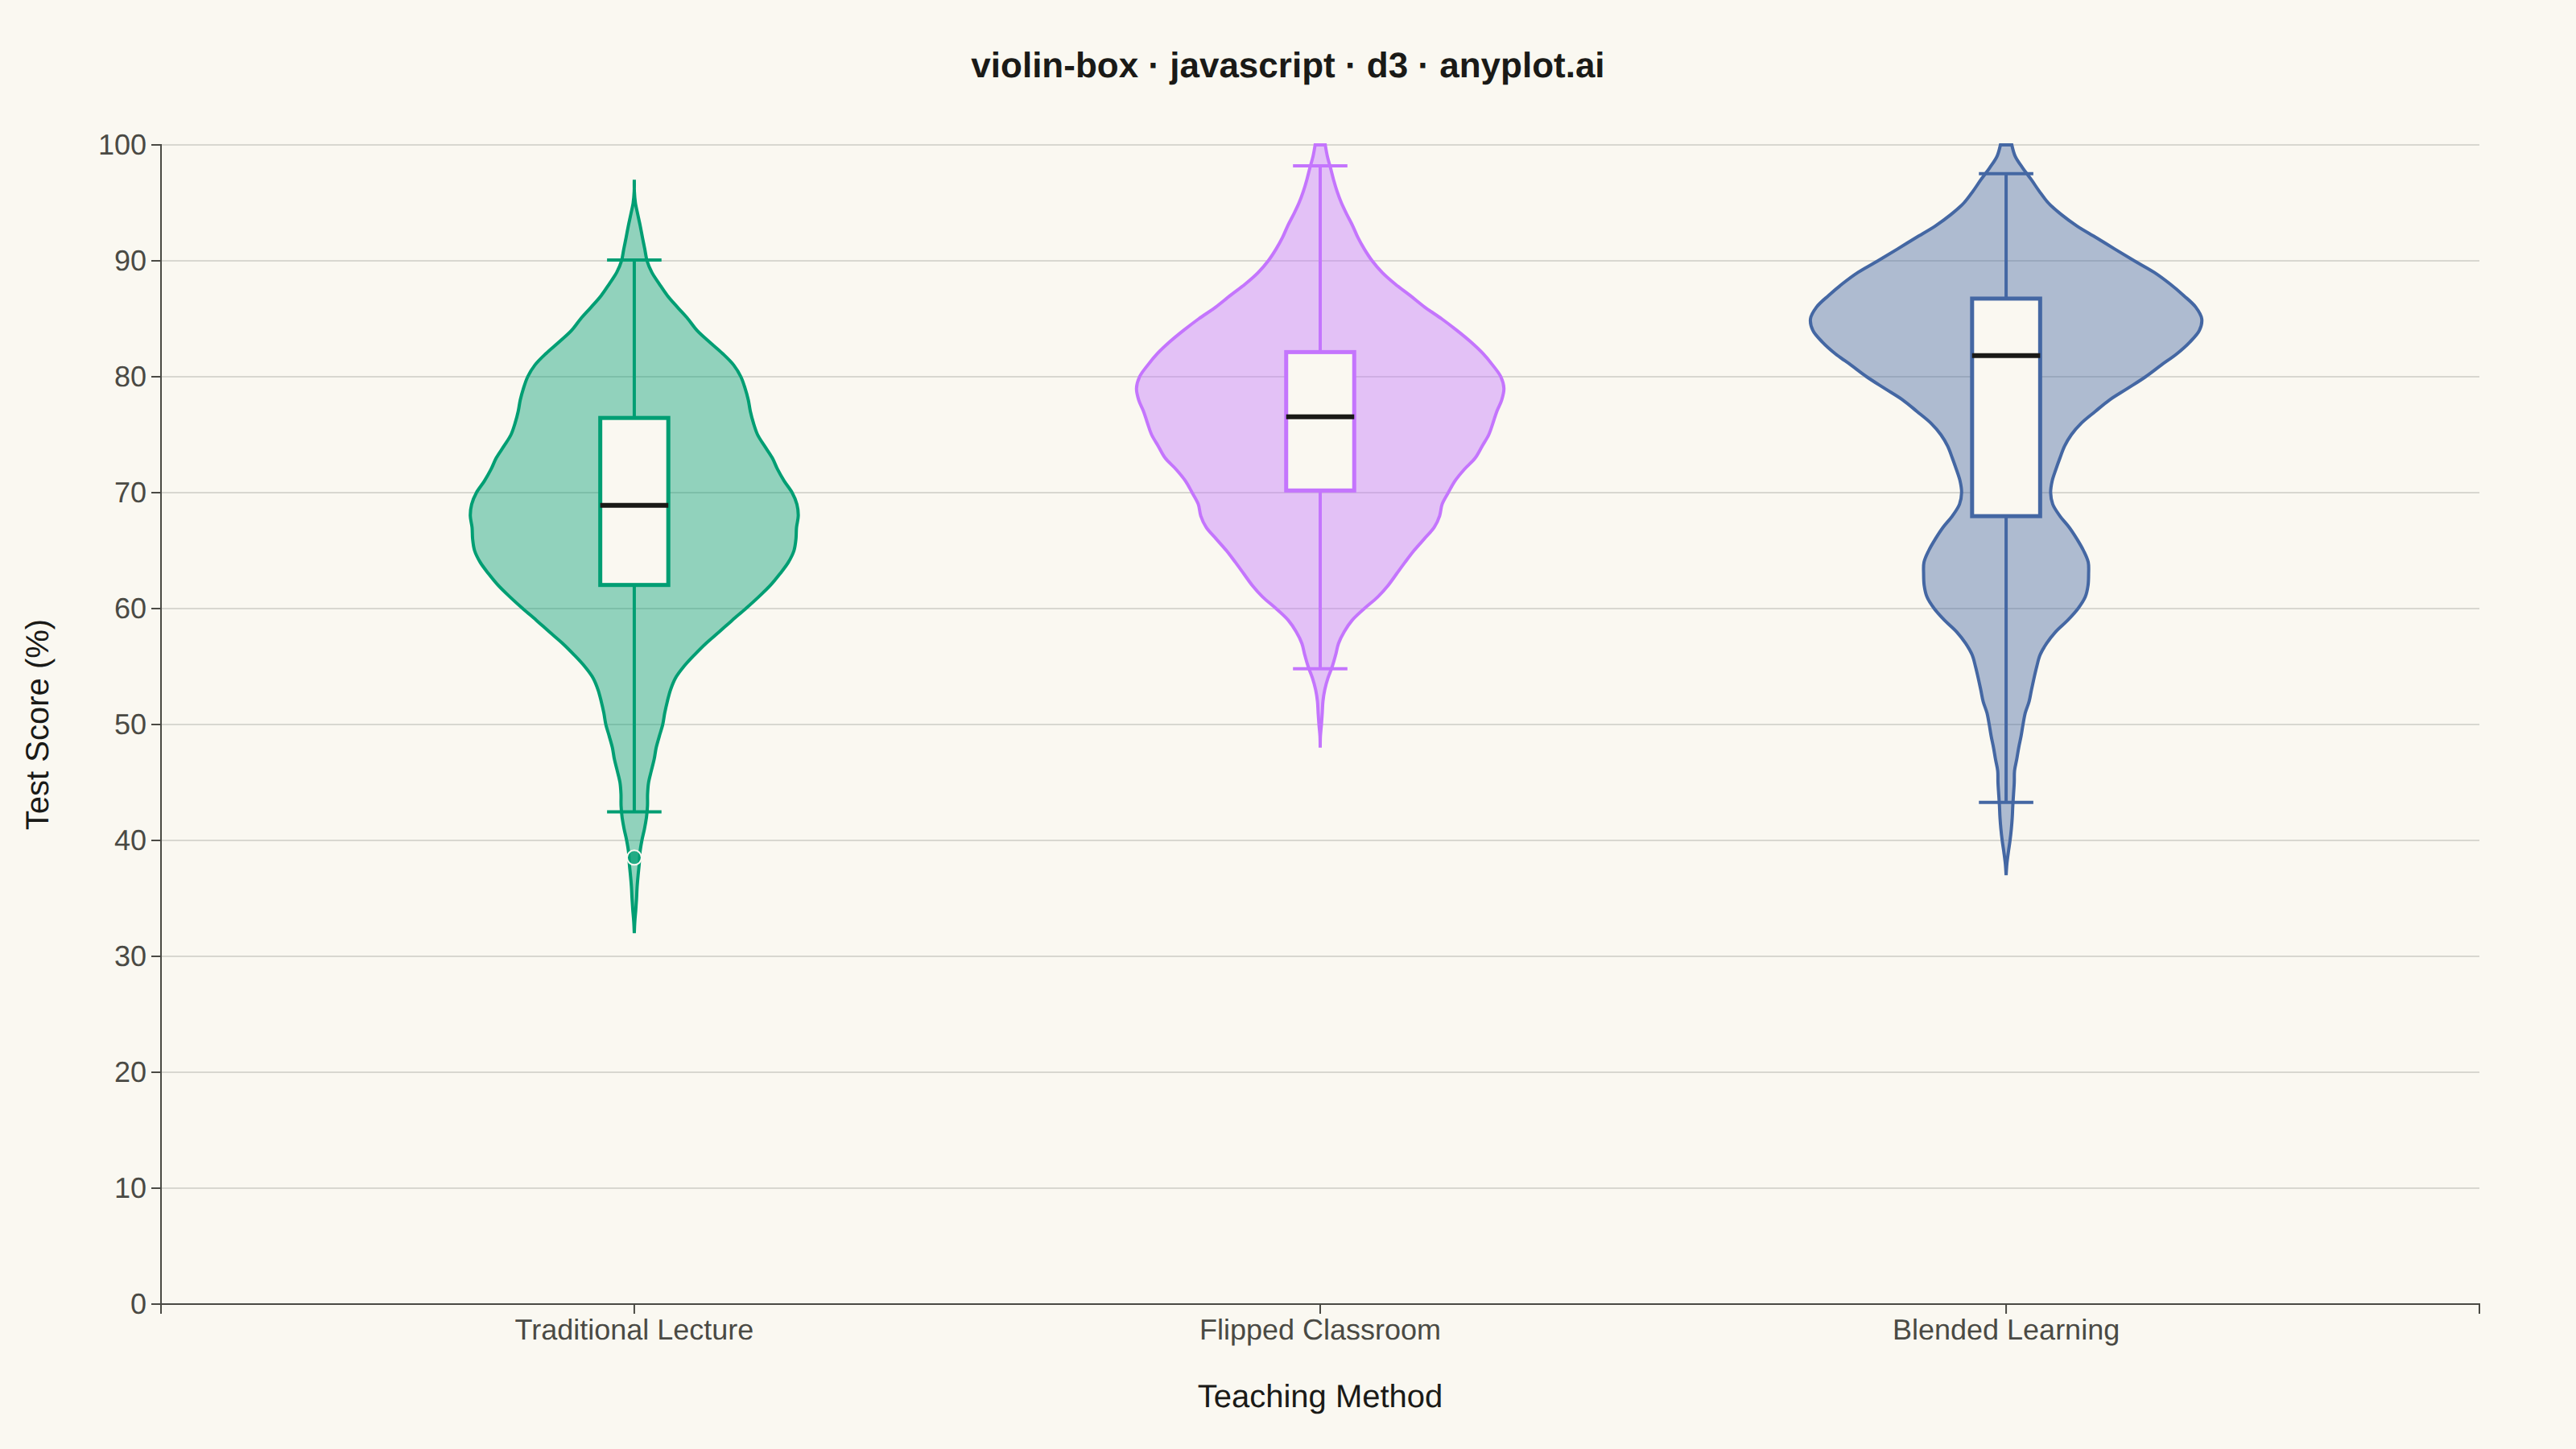
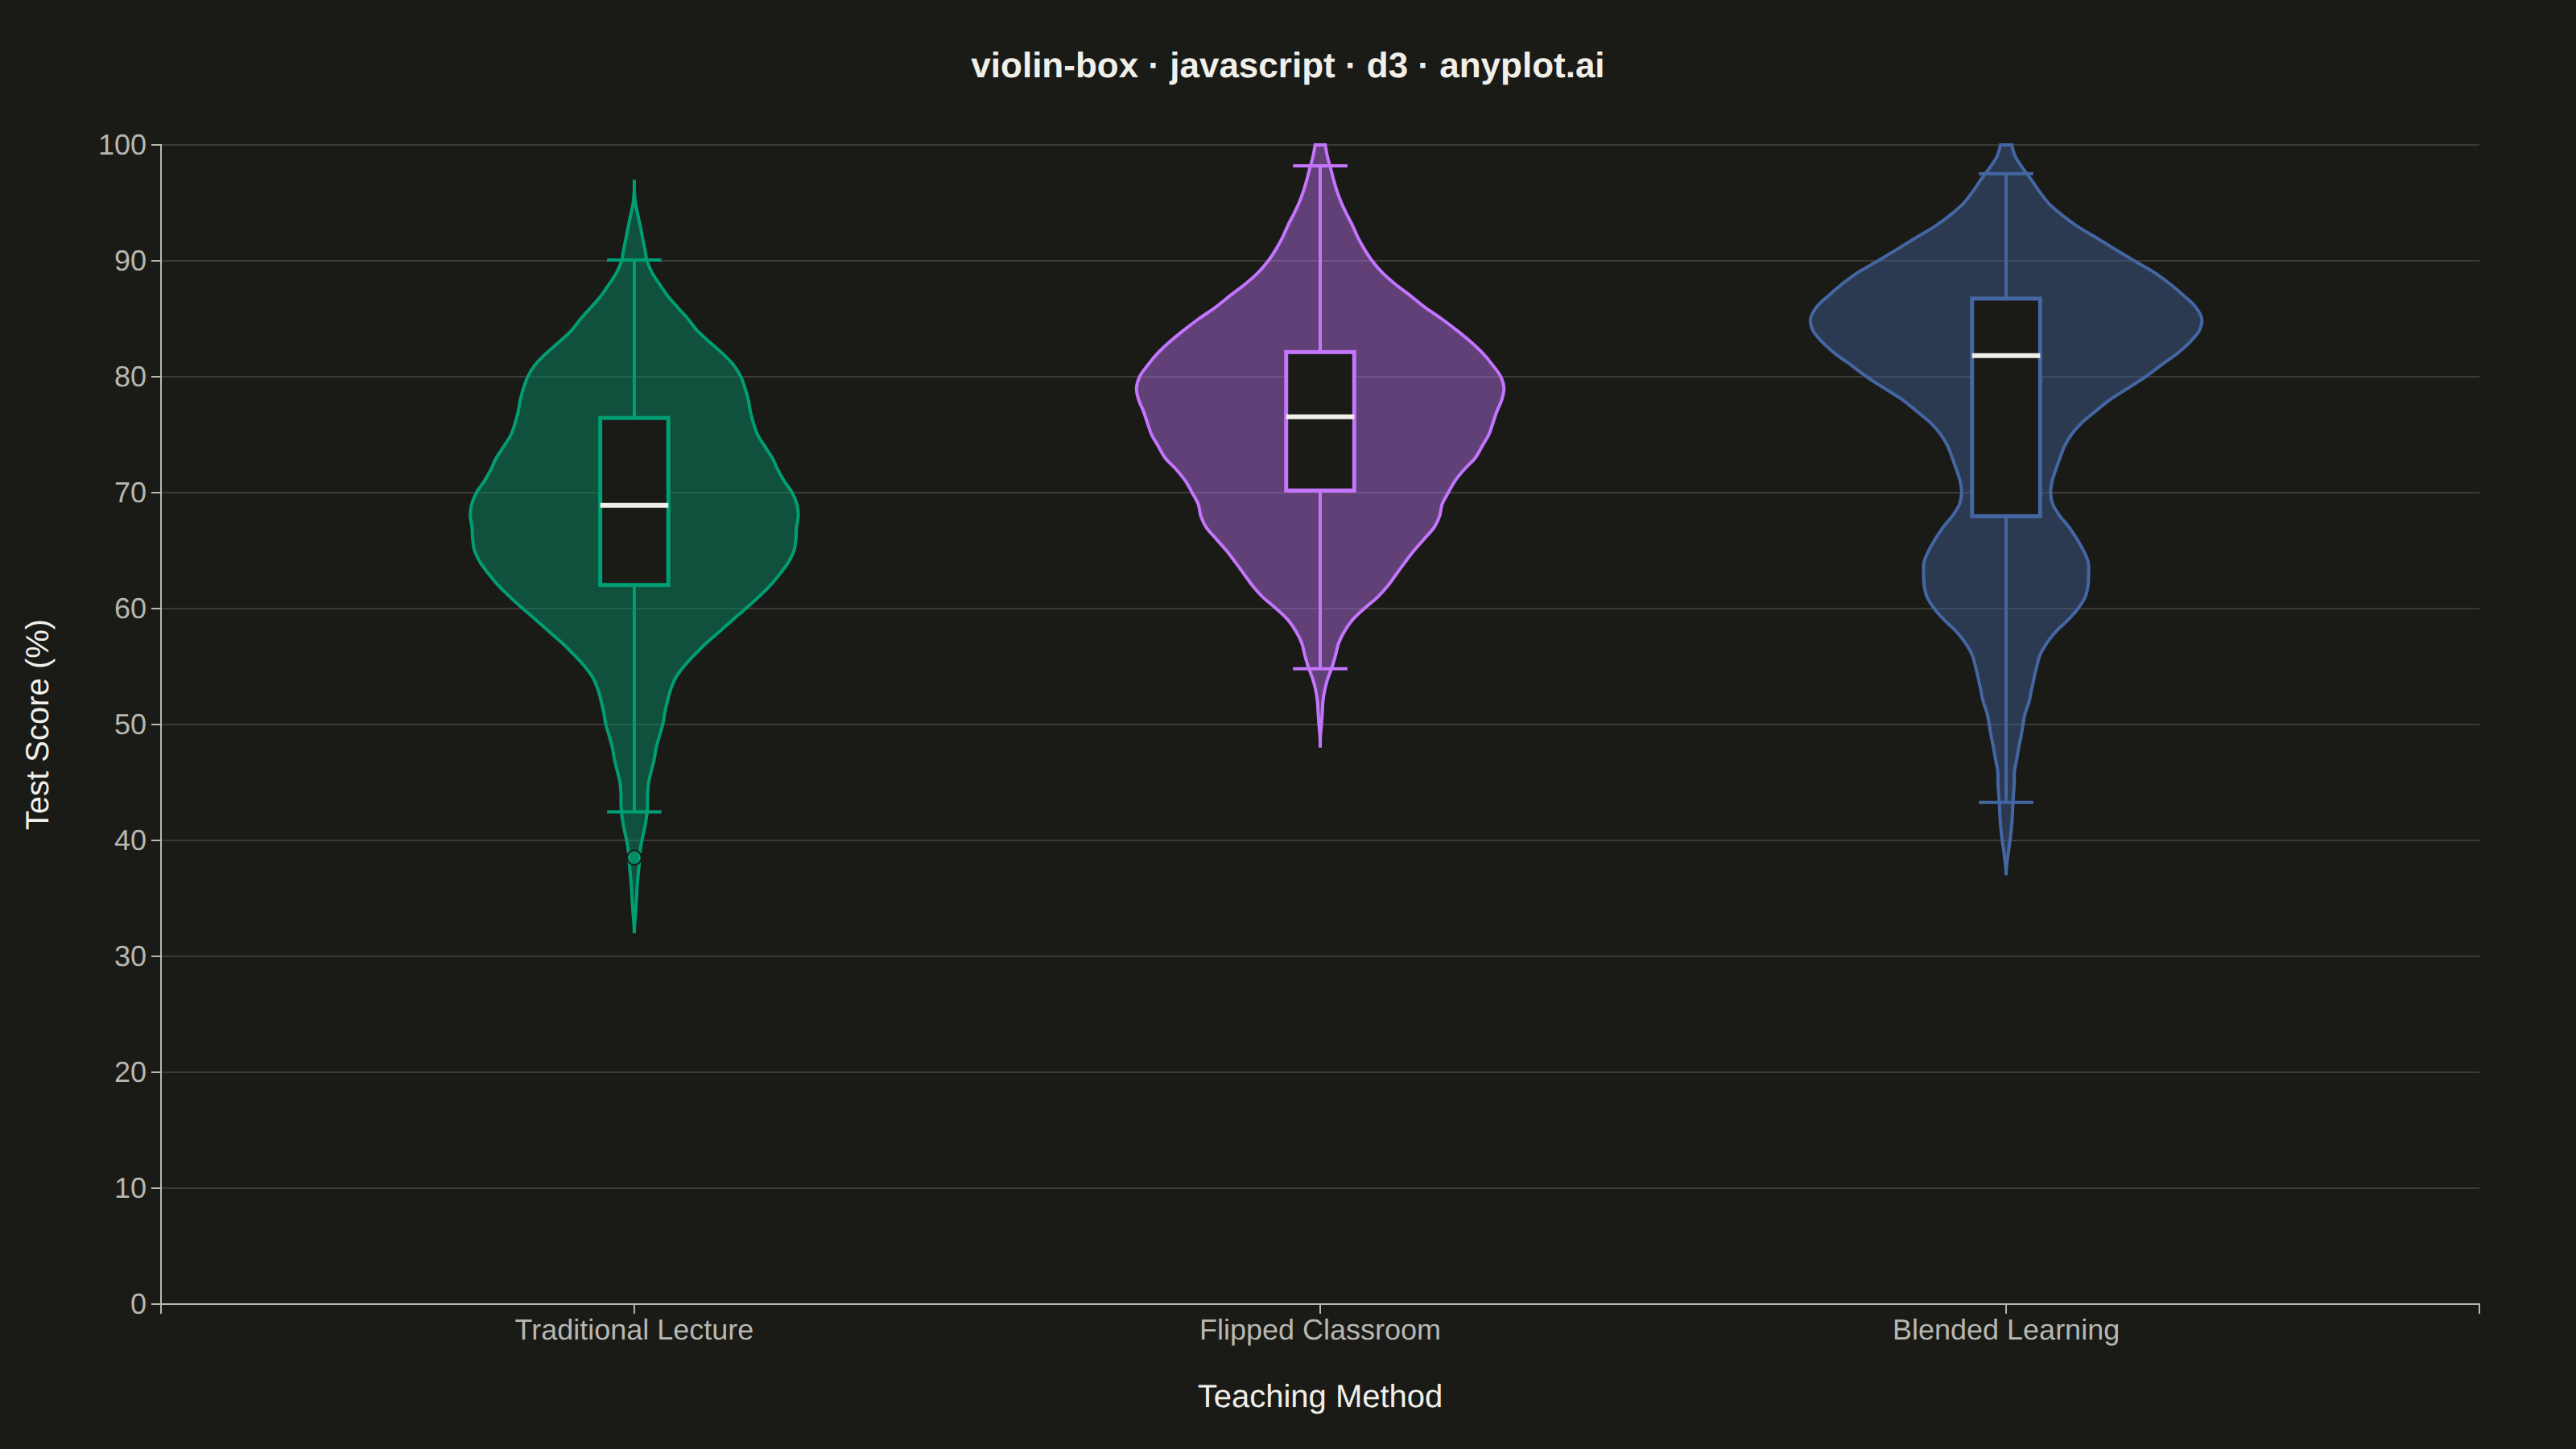
A violin plot with an embedded box plot inside, combining the distribution shape visualization (KDE) with traditional quartile statistics. Shows both the probability density and summary statistics in one plot.
// anyplot.ai
// violin-box: Violin Plot with Embedded Box Plot
// Library: d3 7.9.0 | JavaScript 22.23.2
// Quality: 92/100 | Created: 2026-09-09

const t = window.ANYPLOT_TOKENS;
const { width, height } = window.ANYPLOT_SIZE;
const margin = { top: 90, right: 60, bottom: 90, left: 100 };
const iw = width - margin.left - margin.right;
const ih = height - margin.top - margin.bottom;

// --- Data (in-memory, deterministic) ----------------------------------------
// Test scores across three teaching methods. "Blended Learning" is generated
// as a two-component mixture so its KDE shows two humps that the embedded box
// plot's single median cannot reveal on its own — motivating the combined view.
function makeRng(seed) {
  let state = seed >>> 0;
  return () => {
    state = (state * 1664525 + 1013904223) >>> 0;
    return state / 4294967296;
  };
}
function randomNormal(rng, mean, std) {
  const u1 = Math.max(rng(), 1e-9);
  const u2 = rng();
  const z = Math.sqrt(-2 * Math.log(u1)) * Math.cos(2 * Math.PI * u2);
  return mean + z * std;
}
const rng = makeRng(42);
const pointsPerGroup = 150;
const groupSpecs = [
  { label: "Traditional Lecture", sample: () => randomNormal(rng, 68, 11) },
  { label: "Flipped Classroom", sample: () => randomNormal(rng, 76, 9) },
  {
    label: "Blended Learning",
    sample: () => (rng() < 0.6 ? randomNormal(rng, 85, 6) : randomNormal(rng, 65, 9)),
  },
];

const data = [];
for (const spec of groupSpecs) {
  for (let i = 0; i < pointsPerGroup; i++) {
    data.push({ group: spec.label, value: Math.min(100, Math.max(0, spec.sample())) });
  }
}
const groups = groupSpecs.map((g) => g.label);

// --- Kernel density estimation ----------------------------------------------
function kernelEpanechnikov(bandwidth) {
  return (v) => (Math.abs((v /= bandwidth)) <= 1 ? (0.75 * (1 - v * v)) / bandwidth : 0);
}
function kernelDensityEstimator(kernel, thresholds) {
  return (values) => thresholds.map((x) => [x, d3.mean(values, (v) => kernel(x - v))]);
}
const bandwidth = 6;

// Each group's KDE is evaluated only across its own data extent (padded by the
// kernel bandwidth so the curve tapers to zero smoothly) rather than the full
// [0, 100] axis — otherwise the Epanechnikov kernel's hard cutoff produces an
// exact-zero-width (but still stroked) sliver reaching all the way to the axis
// ends wherever a group's data doesn't span the full score range.
const valuesByGroup = d3.group(data, (d) => d.group);
const densityByGroup = new Map();
let maxDensity = 0;
for (const group of groups) {
  const values = valuesByGroup.get(group).map((d) => d.value);
  const lo = Math.max(0, Math.floor(d3.min(values) - bandwidth));
  const hi = Math.min(100, Math.ceil(d3.max(values) + bandwidth));
  const thresholds = d3.range(lo, hi + 1, 1);
  const density = kernelDensityEstimator(kernelEpanechnikov(bandwidth), thresholds)(values);
  densityByGroup.set(group, density);
  maxDensity = Math.max(maxDensity, d3.max(density, (d) => d[1]));
}

// --- Box-plot summary stats (Tukey whiskers, 1.5×IQR) -----------------------
function computeBoxStats(values) {
  const sorted = values.slice().sort(d3.ascending);
  const q1 = d3.quantileSorted(sorted, 0.25);
  const median = d3.quantileSorted(sorted, 0.5);
  const q3 = d3.quantileSorted(sorted, 0.75);
  const iqr = q3 - q1;
  const lowerFence = q1 - 1.5 * iqr;
  const upperFence = q3 + 1.5 * iqr;
  const inRange = sorted.filter((v) => v >= lowerFence && v <= upperFence);
  return {
    q1,
    median,
    q3,
    whiskerLow: d3.min(inRange),
    whiskerHigh: d3.max(inRange),
    outliers: sorted.filter((v) => v < lowerFence || v > upperFence),
  };
}
const statsByGroup = new Map(groups.map((g) => [g, computeBoxStats(valuesByGroup.get(g).map((d) => d.value))]));

// --- SVG mount ----------------------------------------------------------------
const svg = d3.select("#container").append("svg").attr("width", width).attr("height", height);
const g = svg.append("g").attr("transform", `translate(${margin.left},${margin.top})`);

// --- Scales -------------------------------------------------------------------
const x = d3.scaleBand().domain(groups).range([0, iw]).padding(0.38);
const y = d3.scaleLinear().domain([0, 100]).nice().range([ih, 0]);
const xNum = d3.scaleLinear().domain([0, maxDensity]).range([0, (x.bandwidth() / 2) * 0.92]);

// --- Y gridlines (drawn first, sit behind the data) ---------------------------
g.append("g")
  .call(d3.axisLeft(y).tickSize(-iw).tickFormat(""))
  .call((sel) => sel.select(".domain").remove())
  .selectAll("line")
  .attr("stroke", t.grid);

// --- Violin + box per group ----------------------------------------------------
const violinArea = d3
  .area()
  .curve(d3.curveCatmullRom.alpha(0.5))
  .y((d) => y(d[0]))
  .x0((d) => -xNum(d[1]))
  .x1((d) => xNum(d[1]));

const groupLayers = g
  .selectAll(".group-layer")
  .data(groups)
  .join("g")
  .attr("class", "group-layer")
  .attr("transform", (group) => `translate(${x(group) + x.bandwidth() / 2},0)`);

groupLayers
  .append("path")
  .attr("d", (group) => violinArea(densityByGroup.get(group)))
  .attr("fill", (group, i) => t.palette[i])
  .attr("fill-opacity", 0.42)
  .attr("stroke", (group, i) => t.palette[i])
  .attr("stroke-width", 2);

const boxWidth = x.bandwidth() * 0.16;

// Whiskers (drawn under the box so the box's fill covers the stem cleanly).
groupLayers.each(function (group, i) {
  const layer = d3.select(this);
  const stats = statsByGroup.get(group);
  const color = t.palette[i];

  layer
    .append("line")
    .attr("x1", 0)
    .attr("x2", 0)
    .attr("y1", y(stats.q3))
    .attr("y2", y(stats.whiskerHigh))
    .attr("stroke", color)
    .attr("stroke-width", 2);
  layer
    .append("line")
    .attr("x1", 0)
    .attr("x2", 0)
    .attr("y1", y(stats.q1))
    .attr("y2", y(stats.whiskerLow))
    .attr("stroke", color)
    .attr("stroke-width", 2);
  for (const whiskerValue of [stats.whiskerHigh, stats.whiskerLow]) {
    layer
      .append("line")
      .attr("x1", -boxWidth * 0.4)
      .attr("x2", boxWidth * 0.4)
      .attr("y1", y(whiskerValue))
      .attr("y2", y(whiskerValue))
      .attr("stroke", color)
      .attr("stroke-width", 2);
  }

  layer
    .append("rect")
    .attr("x", -boxWidth / 2)
    .attr("y", y(stats.q3))
    .attr("width", boxWidth)
    .attr("height", y(stats.q1) - y(stats.q3))
    .attr("fill", t.pageBg)
    .attr("stroke", color)
    .attr("stroke-width", 2.5);
  layer
    .append("line")
    .attr("x1", -boxWidth / 2)
    .attr("x2", boxWidth / 2)
    .attr("y1", y(stats.median))
    .attr("y2", y(stats.median))
    .attr("stroke", t.ink)
    .attr("stroke-width", 3);

  layer
    .selectAll(".outlier")
    .data(stats.outliers)
    .join("circle")
    .attr("class", "outlier")
    .attr("cx", 0)
    .attr("cy", (v) => y(v))
    .attr("r", 4.5)
    .attr("fill", color)
    .attr("fill-opacity", 0.75)
    .attr("stroke", t.pageBg)
    .attr("stroke-width", 1);
});

// --- Axes ----------------------------------------------------------------------
const xAxis = g.append("g").attr("transform", `translate(0,${ih})`).call(d3.axisBottom(x));
const yAxis = g.append("g").call(d3.axisLeft(y).tickFormat((v) => `${v}`));
for (const axis of [xAxis, yAxis]) {
  axis.selectAll("text").attr("fill", t.inkSoft).style("font-size", "18px");
  axis.selectAll("line").attr("stroke", t.inkSoft);
  axis.select(".domain").attr("stroke", t.inkSoft);
}

// --- Axis labels -----------------------------------------------------------------
g.append("text")
  .attr("x", iw / 2)
  .attr("y", ih + 64)
  .attr("text-anchor", "middle")
  .attr("fill", t.ink)
  .style("font-size", "20px")
  .text("Teaching Method");

g.append("text")
  .attr("transform", "rotate(-90)")
  .attr("x", -ih / 2)
  .attr("y", -70)
  .attr("text-anchor", "middle")
  .attr("fill", t.ink)
  .style("font-size", "20px")
  .text("Test Score (%)");

// --- Title -------------------------------------------------------------------
svg
  .append("text")
  .attr("x", width / 2)
  .attr("y", 48)
  .attr("text-anchor", "middle")
  .attr("fill", t.ink)
  .style("font-size", "22px")
  .style("font-weight", "600")
  .text("violin-box · javascript · d3 · anyplot.ai");
Runnable source as JSON, for any HTTP client: https://api.anyplot.ai/specs/violin-box/d3/code. Any spec id and library id listed in llms-full.txt fit the same URL shape; every URL below is complete and callable.
{
  "spec_id": "violin-box",
  "language": "javascript",
  "library": "d3",
  "page": "https://anyplot.ai/violin-box/javascript/d3",
  "hub": "https://anyplot.ai/violin-box",
  "code_json": "https://api.anyplot.ai/specs/violin-box/d3/code",
  "spec_json": "https://api.anyplot.ai/specs/violin-box",
  "render_light_png": "https://storage.googleapis.com/anyplot-images/plots/violin-box/javascript/d3/plot-light.png",
  "render_dark_png": "https://storage.googleapis.com/anyplot-images/plots/violin-box/javascript/d3/plot-dark.png",
  "interactive_light_html": "https://storage.googleapis.com/anyplot-images/plots/violin-box/javascript/d3/plot-light.html",
  "interactive_dark_html": "https://storage.googleapis.com/anyplot-images/plots/violin-box/javascript/d3/plot-dark.html",
  "quality_score": 92.0,
  "license": "MIT",
  "guide": "https://anyplot.ai/llms.txt"
}
Part of Violin Plot with Embedded Box Plot on anyplot.ai.