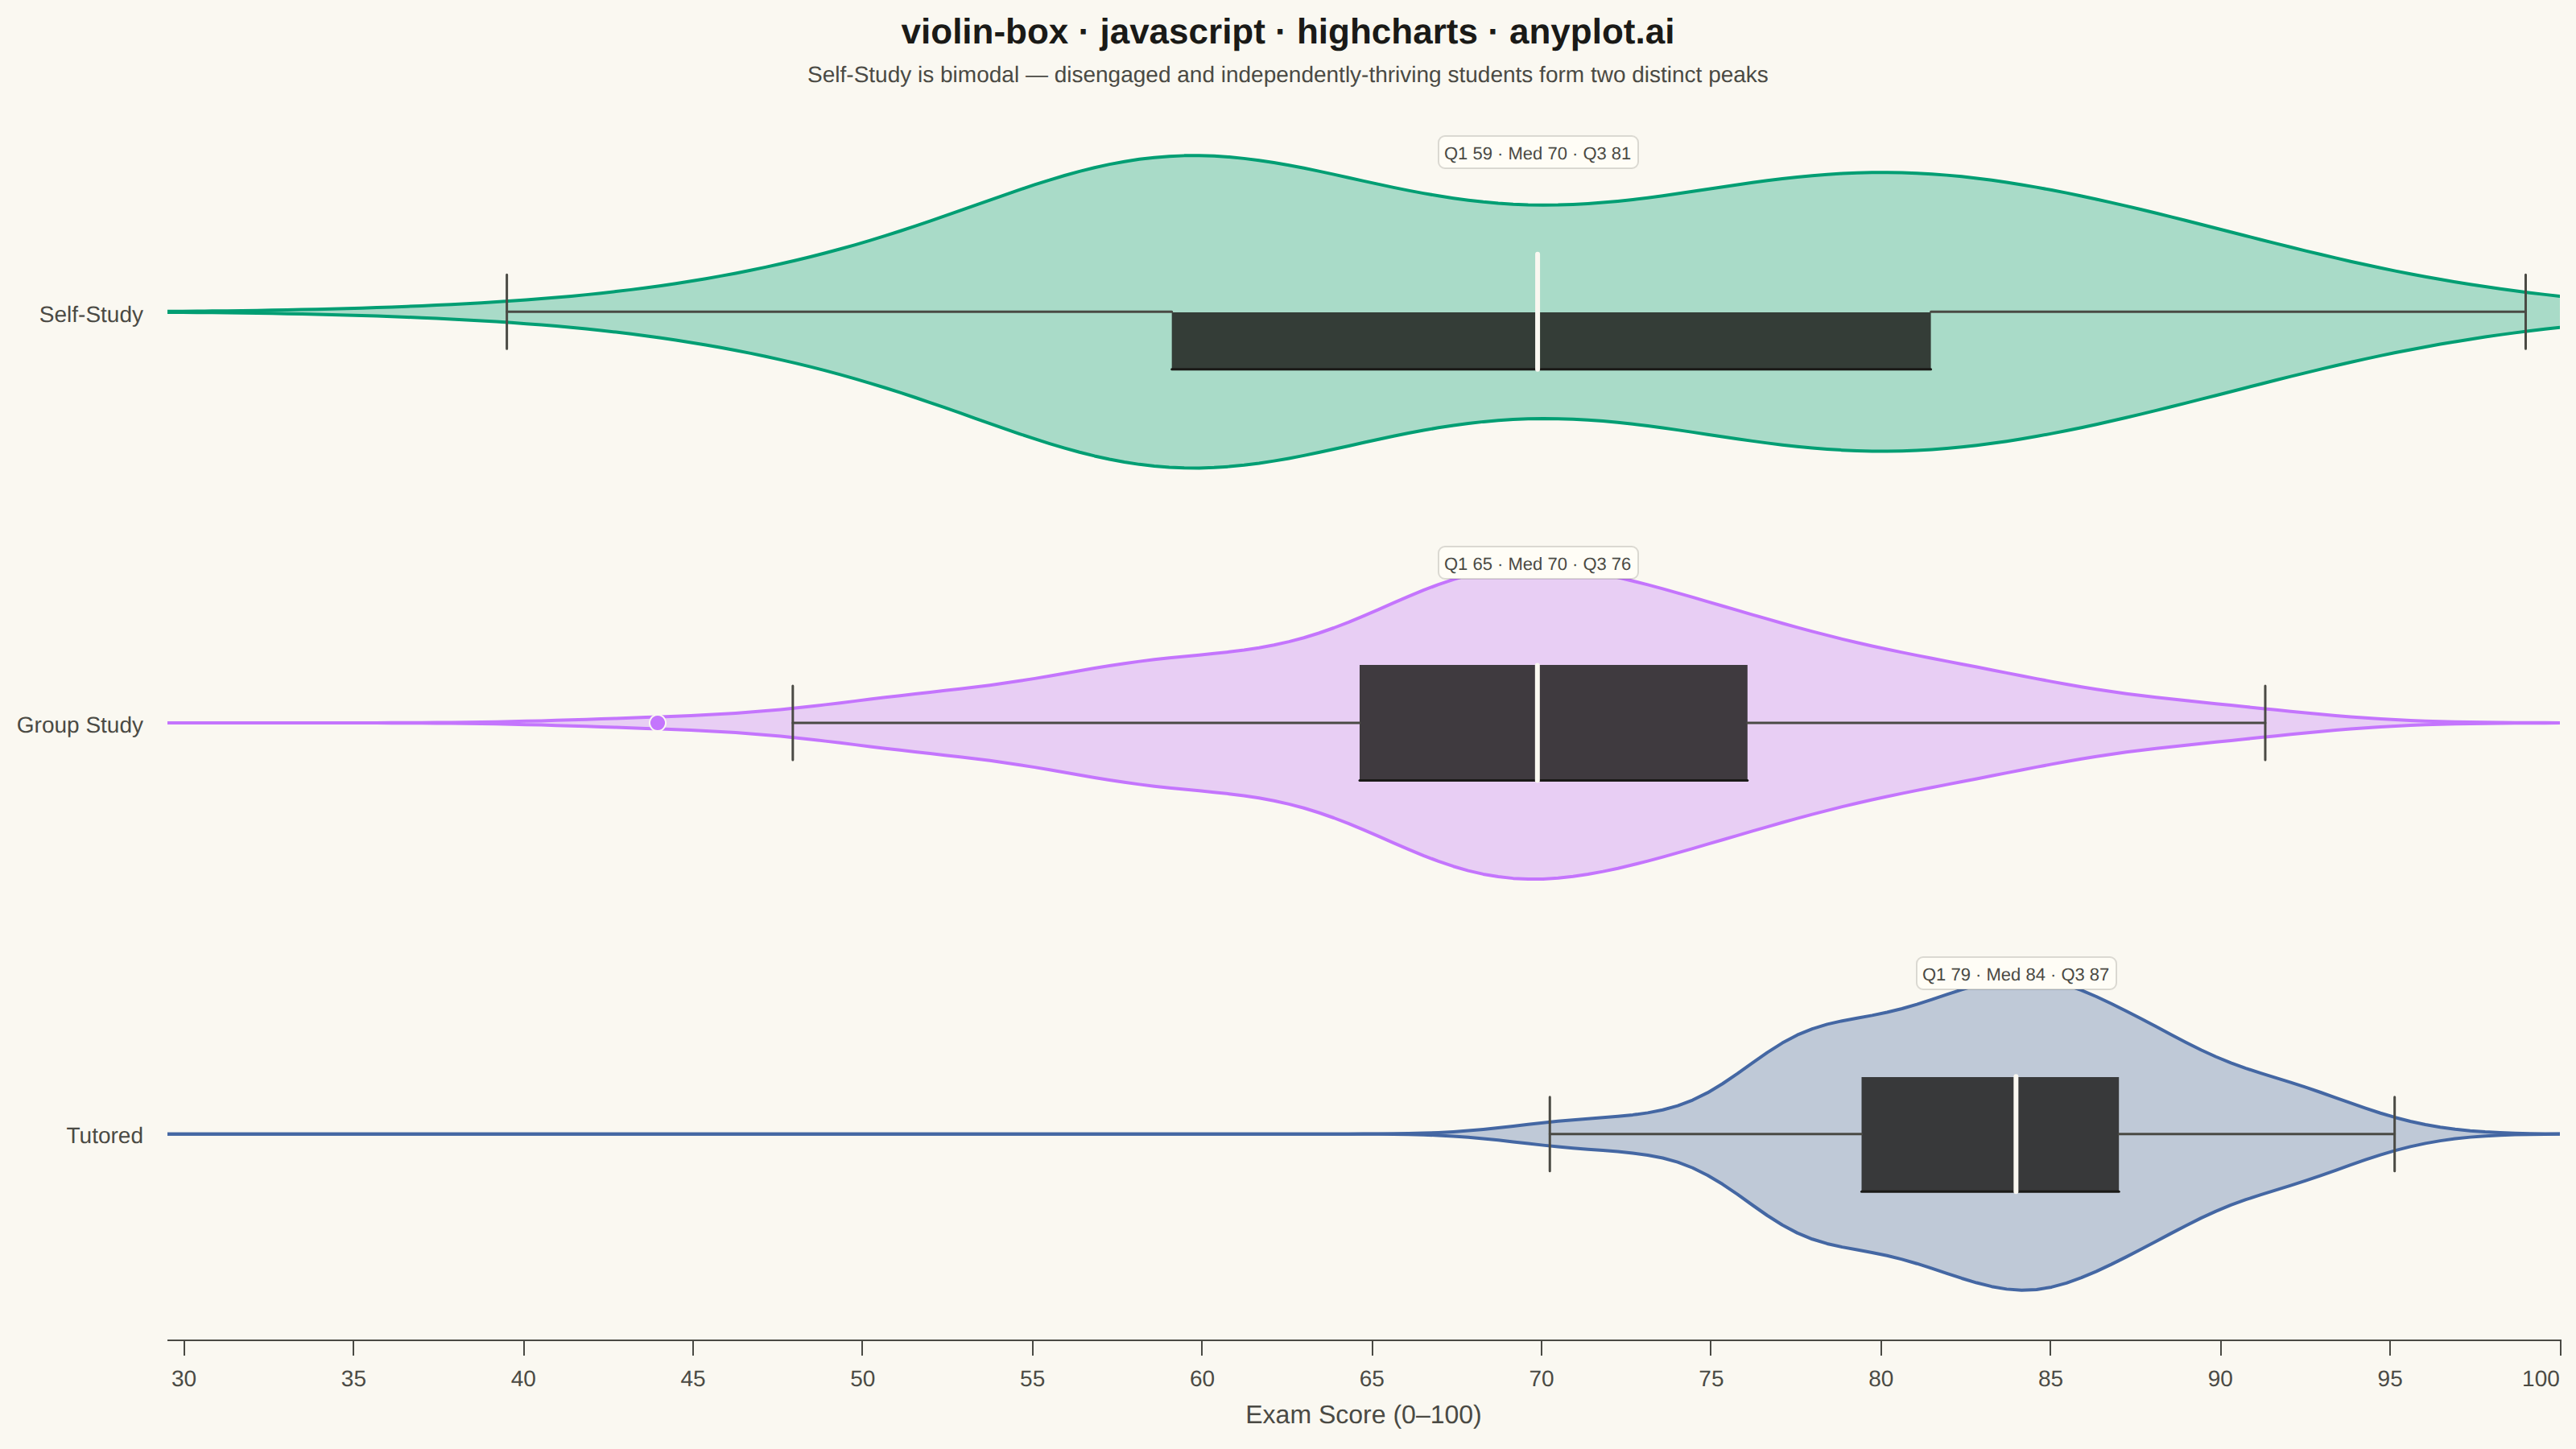
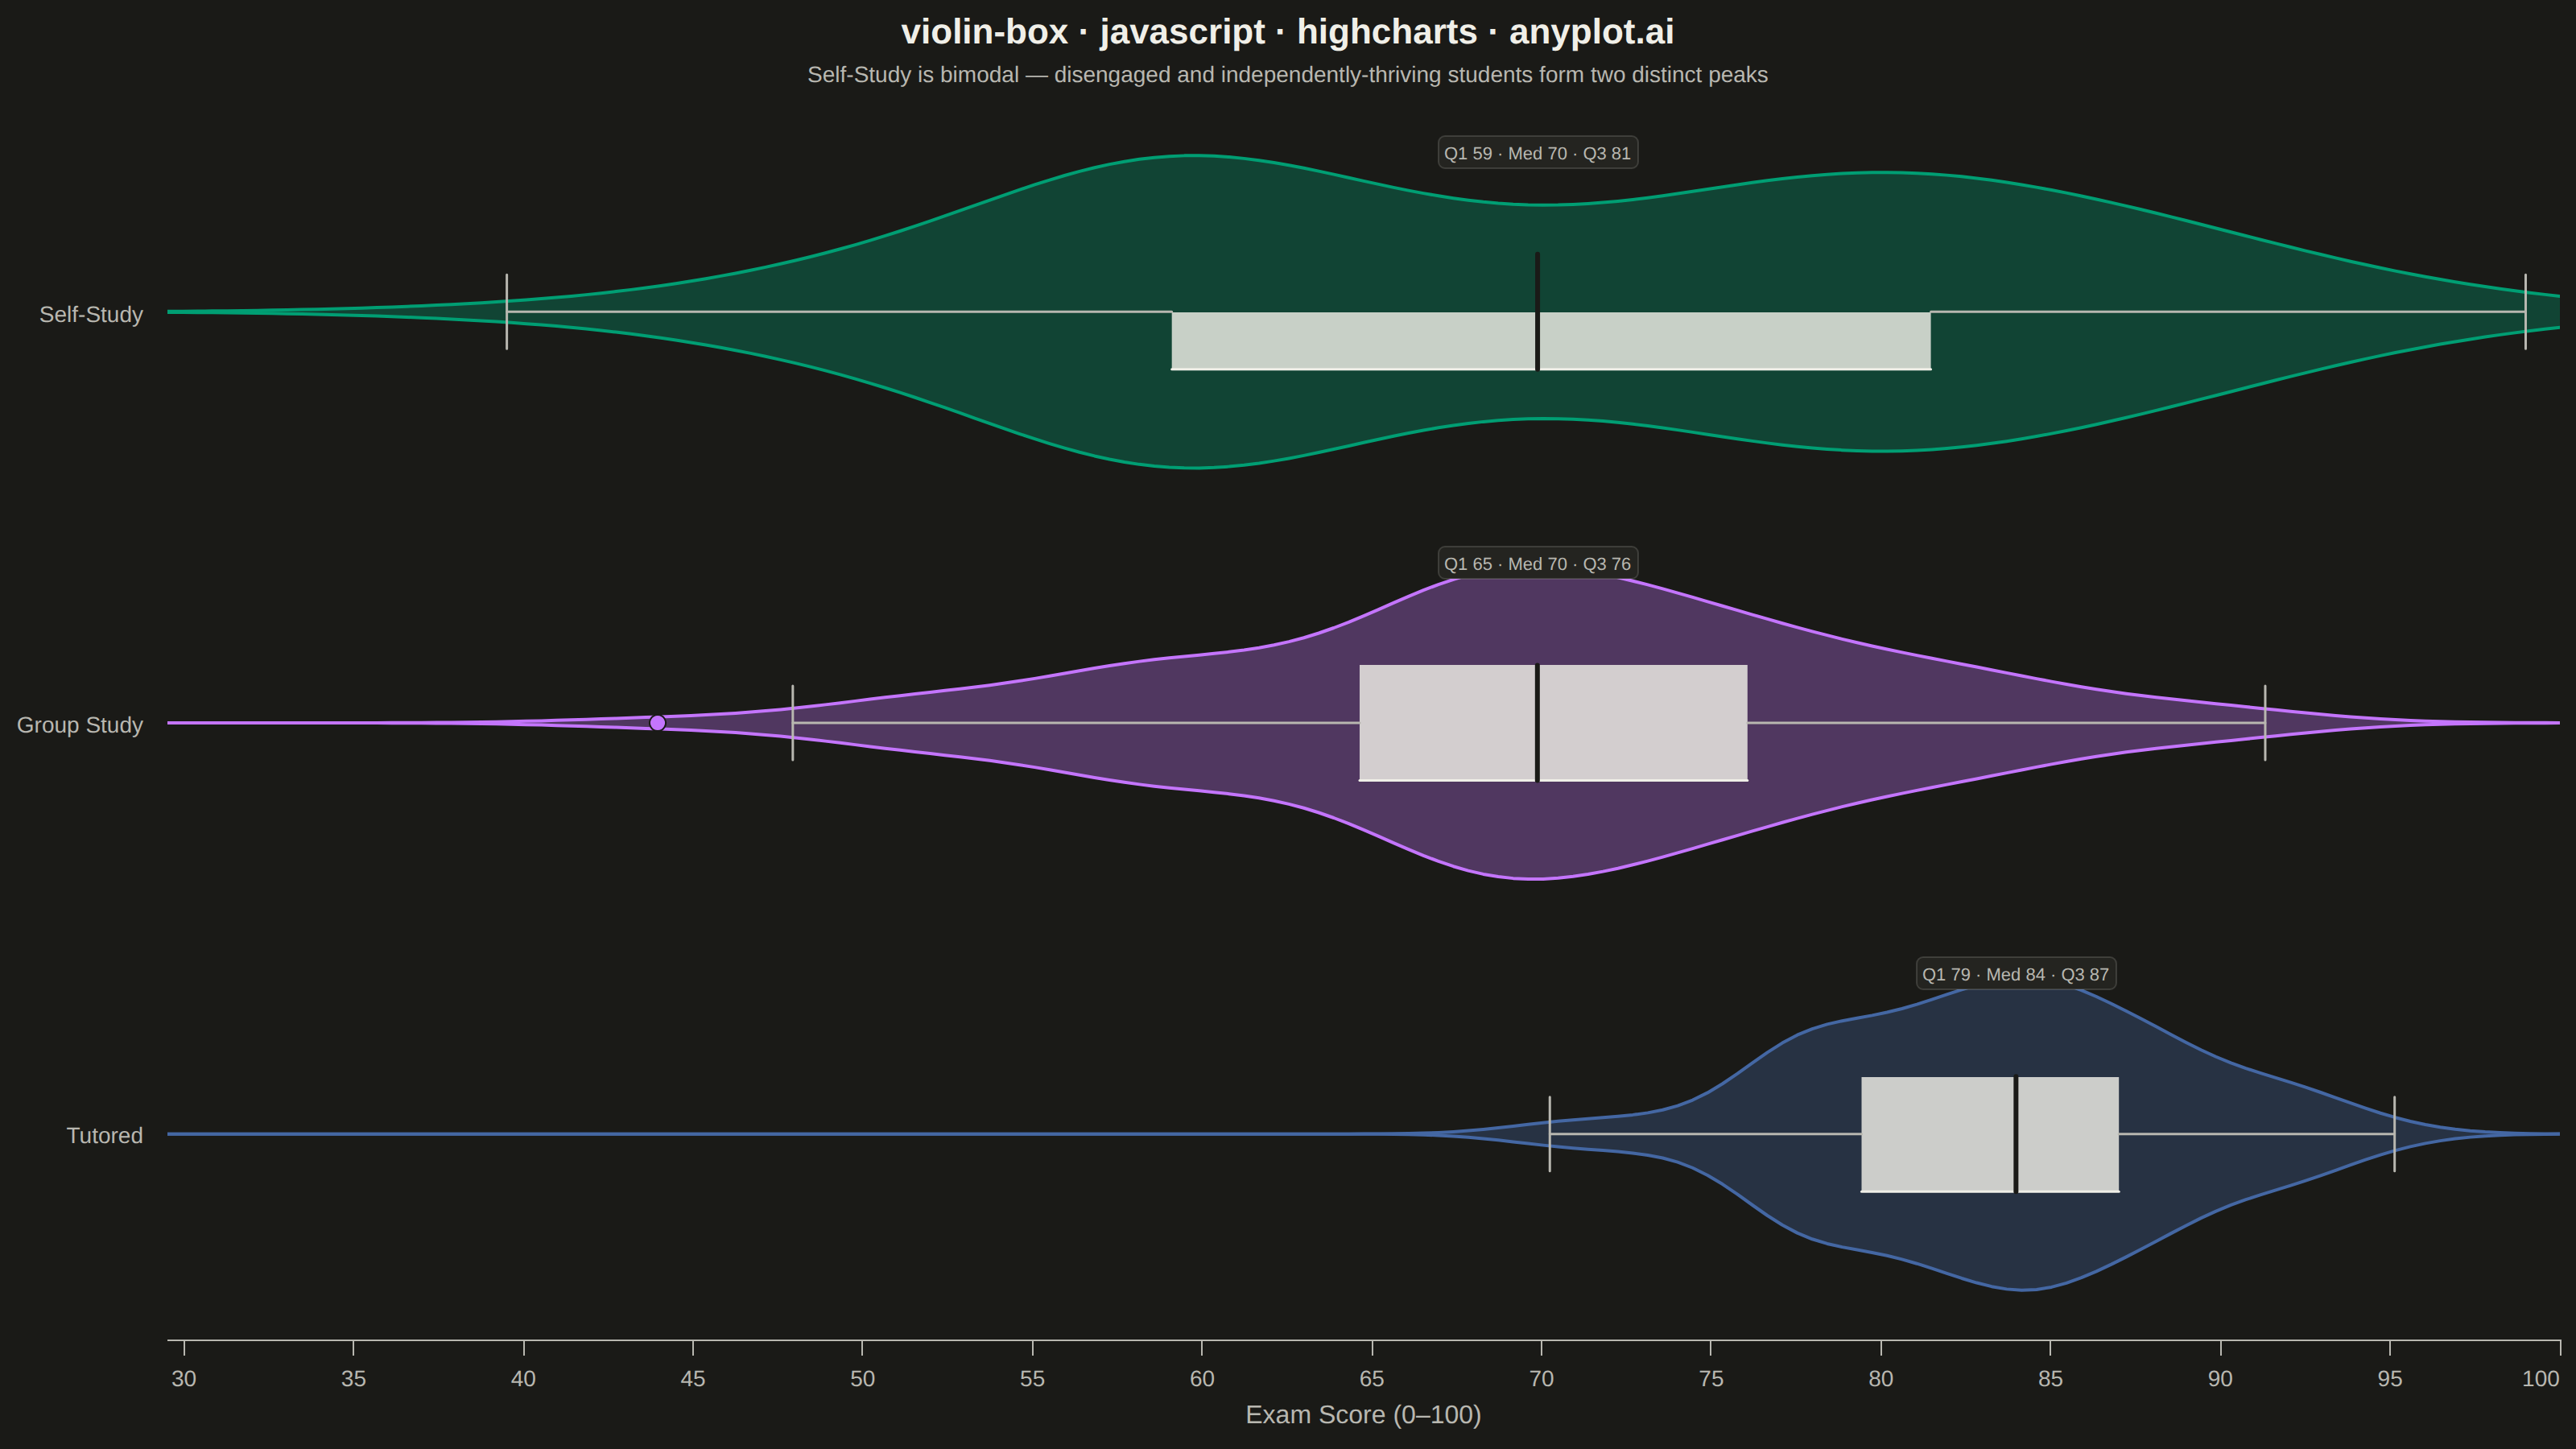
The same plot in 14 other libraries — JavaScript: Chart.js, D3.js, Apache ECharts, MUI X Charts; Python: Altair, Bokeh, lets-plot, Matplotlib, Plotly, plotnine, Pygal, Seaborn; R: ggplot2; Julia: Makie.jl. Compare all 15 side by side: Violin Plot with Embedded Box Plot in Python, R, Julia and JavaScript.
A violin plot with an embedded box plot inside, combining the distribution shape visualization (KDE) with traditional quartile statistics. Shows both the probability density and summary statistics in one plot.
// anyplot.ai
// violin-box: Violin Plot with Embedded Box Plot
// Library: highcharts 12.6.0 | JavaScript 22.23.2
// Quality: 93/100 | Created: 2026-09-09

const t = window.ANYPLOT_TOKENS;

// --- Data (in-memory, deterministic) ----------------------------------------
// Tiny LCG PRNG + Box-Muller — the browser has no seeded RNG.
function makeLcg(seed) {
  let state = seed >>> 0;
  return function () {
    state = (1103515245 * state + 12345) >>> 0;
    return state / 4294967296;
  };
}
const rand = makeLcg(42);
function randNormal() {
  let u1 = 0;
  while (u1 === 0) u1 = rand();
  const u2 = rand();
  return Math.sqrt(-2 * Math.log(u1)) * Math.cos(2 * Math.PI * u2);
}
function normalSample(n, mean, std) {
  const out = [];
  for (let i = 0; i < n; i++) {
    out.push(Math.min(100, Math.max(0, mean + std * randNormal())));
  }
  return out;
}

// Exam scores under 3 study methods. Self-Study is a mix of students who
// never got going and students who thrived alone — a bimodal distribution
// that a violin plot reveals but a bare box plot would hide.
const groups = [
  {
    name: "Self-Study",
    samples: [...normalSample(60, 58, 7), ...normalSample(60, 82, 6)],
  },
  { name: "Group Study", samples: normalSample(120, 72, 9) },
  { name: "Tutored", samples: normalSample(120, 84, 5) },
];

// --- Shared helpers ----------------------------------------------------------
function quantile(sortedArr, q) {
  const pos = (sortedArr.length - 1) * q;
  const base = Math.floor(pos);
  const rest = pos - base;
  return sortedArr[base + 1] !== undefined
    ? sortedArr[base] + rest * (sortedArr[base + 1] - sortedArr[base])
    : sortedArr[base];
}
function boxStats(samples) {
  const sorted = [...samples].sort((a, b) => a - b);
  const q1 = quantile(sorted, 0.25);
  const median = quantile(sorted, 0.5);
  const q3 = quantile(sorted, 0.75);
  const iqr = q3 - q1;
  const lowerFence = q1 - 1.5 * iqr;
  const upperFence = q3 + 1.5 * iqr;
  const inFence = sorted.filter((v) => v >= lowerFence && v <= upperFence);
  return {
    q1,
    median,
    q3,
    whiskerMin: Math.min(...inFence),
    whiskerMax: Math.max(...inFence),
    outliers: sorted.filter((v) => v < lowerFence || v > upperFence),
  };
}
function gaussianKde(samples, grid) {
  const n = samples.length;
  const mean = samples.reduce((a, b) => a + b, 0) / n;
  const variance = samples.reduce((a, b) => a + (b - mean) ** 2, 0) / (n - 1);
  const std = Math.sqrt(variance);
  const sorted = [...samples].sort((a, b) => a - b);
  const iqr = quantile(sorted, 0.75) - quantile(sorted, 0.25);
  const bandwidth = 0.9 * Math.min(std, iqr / 1.34) * Math.pow(n, -0.2);
  return grid.map((x) => {
    let sum = 0;
    for (let j = 0; j < n; j++) {
      const u = (x - samples[j]) / bandwidth;
      sum += Math.exp(-0.5 * u * u);
    }
    return sum / (n * bandwidth * Math.sqrt(2 * Math.PI));
  });
}
function hexToRgba(hex, alpha) {
  const r = parseInt(hex.slice(1, 3), 16);
  const g = parseInt(hex.slice(3, 5), 16);
  const b = parseInt(hex.slice(5, 7), 16);
  return `rgba(${r}, ${g}, ${b}, ${alpha})`;
}

// Shared value grid across all groups so every violin sits on the same scale.
const allScores = groups.flatMap((g) => g.samples);
const gridMin = Math.max(0, Math.min(...allScores) - 10);
const gridMax = Math.min(100, Math.max(...allScores) + 10);
const gridN = 161;
const grid = Array.from(
  { length: gridN },
  (_, i) => gridMin + ((gridMax - gridMin) * i) / (gridN - 1),
);

// --- Build one violin + embedded box plot per group (core series only:  ----
// --- highcharts-more's boxplot/arearange/polygon are not vendored here) ----
const halfWidthMax = 0.38; // violin half-height, in category-row units
const halfBoxHeight = 0.14; // box half-height, centered inside the violin
const capHalf = 0.09; // whisker end-cap half-height

const series = groups.flatMap((g, i) => {
  const baseline = i;
  const color = t.palette[i];

  // Violin: two mirrored `area` curves filling toward the row's baseline —
  // together they trace the closed KDE silhouette without a polygon series.
  const density = gaussianKde(g.samples, grid);
  const maxDensity = Math.max(...density);
  const halfWidth = density.map((v) => (v / maxDensity) * halfWidthMax);
  const upperCurve = grid.map((x, j) => [x, baseline + halfWidth[j]]);
  const lowerCurve = grid.map((x, j) => [x, baseline - halfWidth[j]]);

  // Box plot: a floating rectangle (2-point area with an offset threshold),
  // whiskers/caps (line series with a null-gap over the box), and a median
  // notch — the same primitives `highcharts-more`'s boxplot draws with, built
  // from the core `area`/`line` series instead.
  const st = boxStats(g.samples);
  const gapX = (st.q1 + st.q3) / 2;

  return [
    {
      id: `violin-${i}`,
      name: g.name,
      type: "area",
      data: upperCurve,
      threshold: baseline,
      color,
      fillColor: hexToRgba(color, 0.32),
      lineWidth: 2,
      marker: { enabled: false },
      enableMouseTracking: false,
    },
    {
      linkedTo: `violin-${i}`,
      type: "area",
      data: lowerCurve,
      threshold: baseline,
      color,
      fillColor: hexToRgba(color, 0.32),
      lineWidth: 2,
      marker: { enabled: false },
      enableMouseTracking: false,
      showInLegend: false,
    },
    {
      type: "area",
      data: [
        [st.q1, baseline + halfBoxHeight],
        [st.q3, baseline + halfBoxHeight],
      ],
      threshold: baseline - halfBoxHeight,
      color: t.ink,
      fillColor: hexToRgba(t.ink, 0.82),
      lineWidth: 1.5,
      marker: { enabled: false },
      enableMouseTracking: false,
      showInLegend: false,
    },
    {
      type: "line",
      data: [
        [st.whiskerMin, baseline],
        [st.q1, baseline],
        [gapX, null],
        [st.q3, baseline],
        [st.whiskerMax, baseline],
      ],
      color: t.inkSoft,
      lineWidth: 1.5,
      marker: { enabled: false },
      enableMouseTracking: false,
      showInLegend: false,
    },
    {
      type: "line",
      data: [
        [st.whiskerMin, baseline - capHalf],
        [st.whiskerMin, baseline + capHalf],
        [gapX, null],
        [st.whiskerMax, baseline - capHalf],
        [st.whiskerMax, baseline + capHalf],
      ],
      color: t.inkSoft,
      lineWidth: 1.5,
      marker: { enabled: false },
      enableMouseTracking: false,
      showInLegend: false,
    },
    {
      type: "line",
      data: [
        [st.median, baseline - halfBoxHeight],
        [st.median, baseline + halfBoxHeight],
      ],
      color: t.pageBg,
      lineWidth: 3,
      marker: { enabled: false },
      enableMouseTracking: false,
      showInLegend: false,
    },
    ...(st.outliers.length
      ? [
          {
            type: "scatter",
            data: st.outliers.map((v) => [v, baseline]),
            color,
            marker: {
              symbol: "circle",
              radius: 5,
              fillColor: color,
              lineColor: t.pageBg,
              lineWidth: 1,
            },
            showInLegend: false,
            tooltip: { pointFormat: `${g.name} outlier: <b>{point.x:.1f}</b>` },
          },
        ]
      : []),
    // Stat chip: a Highcharts dataLabel badge (own background/border, not just
    // text) surfacing the box's Q1/median/Q3 numerically — the core-bundle
    // stand-in for highcharts-more's boxplot tooltip, made permanently visible.
    {
      type: "scatter",
      data: [
        {
          x: st.median,
          y: baseline,
          custom: { q1: st.q1, median: st.median, q3: st.q3 },
        },
      ],
      marker: { enabled: false },
      enableMouseTracking: false,
      showInLegend: false,
      dataLabels: {
        enabled: true,
        align: "center",
        verticalAlign: "middle",
        y: -100,
        format: "Q1 {point.custom.q1:.0f} · Med {point.custom.median:.0f} · Q3 {point.custom.q3:.0f}",
        backgroundColor: t.elevatedBg,
        borderColor: t.grid,
        borderWidth: 1,
        borderRadius: 4,
        padding: 4,
        style: {
          color: t.inkSoft,
          fontSize: "11px",
          fontWeight: "500",
          textOutline: "none",
        },
      },
    },
  ];
});

// --- Chart -------------------------------------------------------------------
Highcharts.chart("container", {
  chart: {
    type: "line",
    backgroundColor: "transparent",
    animation: false,
    style: { fontFamily: "inherit" },
  },
  credits: { enabled: false },
  colors: t.palette,
  title: {
    text: "violin-box · javascript · highcharts · anyplot.ai",
    style: { color: t.ink, fontSize: "22px", fontWeight: "600" },
  },
  subtitle: {
    text: "Self-Study is bimodal — disengaged and independently-thriving students form two distinct peaks",
    style: { color: t.inkSoft, fontSize: "14px" },
  },
  xAxis: {
    type: "linear",
    min: gridMin,
    max: gridMax,
    title: {
      text: "Exam Score (0–100)",
      style: { color: t.inkSoft, fontSize: "16px" },
    },
    lineColor: t.inkSoft,
    tickColor: t.inkSoft,
    gridLineColor: t.grid,
    labels: { style: { color: t.inkSoft, fontSize: "14px" } },
  },
  yAxis: {
    type: "category",
    categories: groups.map((g) => g.name),
    min: -0.6,
    max: groups.length - 1 + 0.6,
    tickPositions: groups.map((_, i) => i),
    reversed: true,
    title: { text: null },
    gridLineWidth: 0,
    lineColor: t.inkSoft,
    tickColor: t.inkSoft,
    labels: { style: { color: t.inkSoft, fontSize: "14px" } },
  },
  legend: { enabled: false },
  tooltip: { enabled: true },
  plotOptions: { series: { animation: false } },
  series,
});
Runnable source as JSON, for any HTTP client: https://api.anyplot.ai/specs/violin-box/highcharts/code. Any spec id and library id listed in llms-full.txt fit the same URL shape; every URL below is complete and callable.
{
  "spec_id": "violin-box",
  "language": "javascript",
  "library": "highcharts",
  "page": "https://anyplot.ai/violin-box/javascript/highcharts",
  "hub": "https://anyplot.ai/violin-box",
  "code_json": "https://api.anyplot.ai/specs/violin-box/highcharts/code",
  "spec_json": "https://api.anyplot.ai/specs/violin-box",
  "render_light_png": "https://storage.googleapis.com/anyplot-images/plots/violin-box/javascript/highcharts/plot-light.png",
  "render_dark_png": "https://storage.googleapis.com/anyplot-images/plots/violin-box/javascript/highcharts/plot-dark.png",
  "interactive_light_html": "https://storage.googleapis.com/anyplot-images/plots/violin-box/javascript/highcharts/plot-light.html",
  "interactive_dark_html": "https://storage.googleapis.com/anyplot-images/plots/violin-box/javascript/highcharts/plot-dark.html",
  "quality_score": 93.0,
  "license": "MIT",
  "guide": "https://anyplot.ai/llms.txt"
}
Part of Violin Plot with Embedded Box Plot on anyplot.ai.