The same plot in 14 other libraries — JavaScript: Chart.js, D3.js, Highcharts, MUI X Charts; Python: Altair, Bokeh, lets-plot, Matplotlib, Plotly, plotnine, Pygal, Seaborn; R: ggplot2; Julia: Makie.jl. Compare all 15 side by side: Violin Plot with Embedded Box Plot in Python, R, Julia and JavaScript.
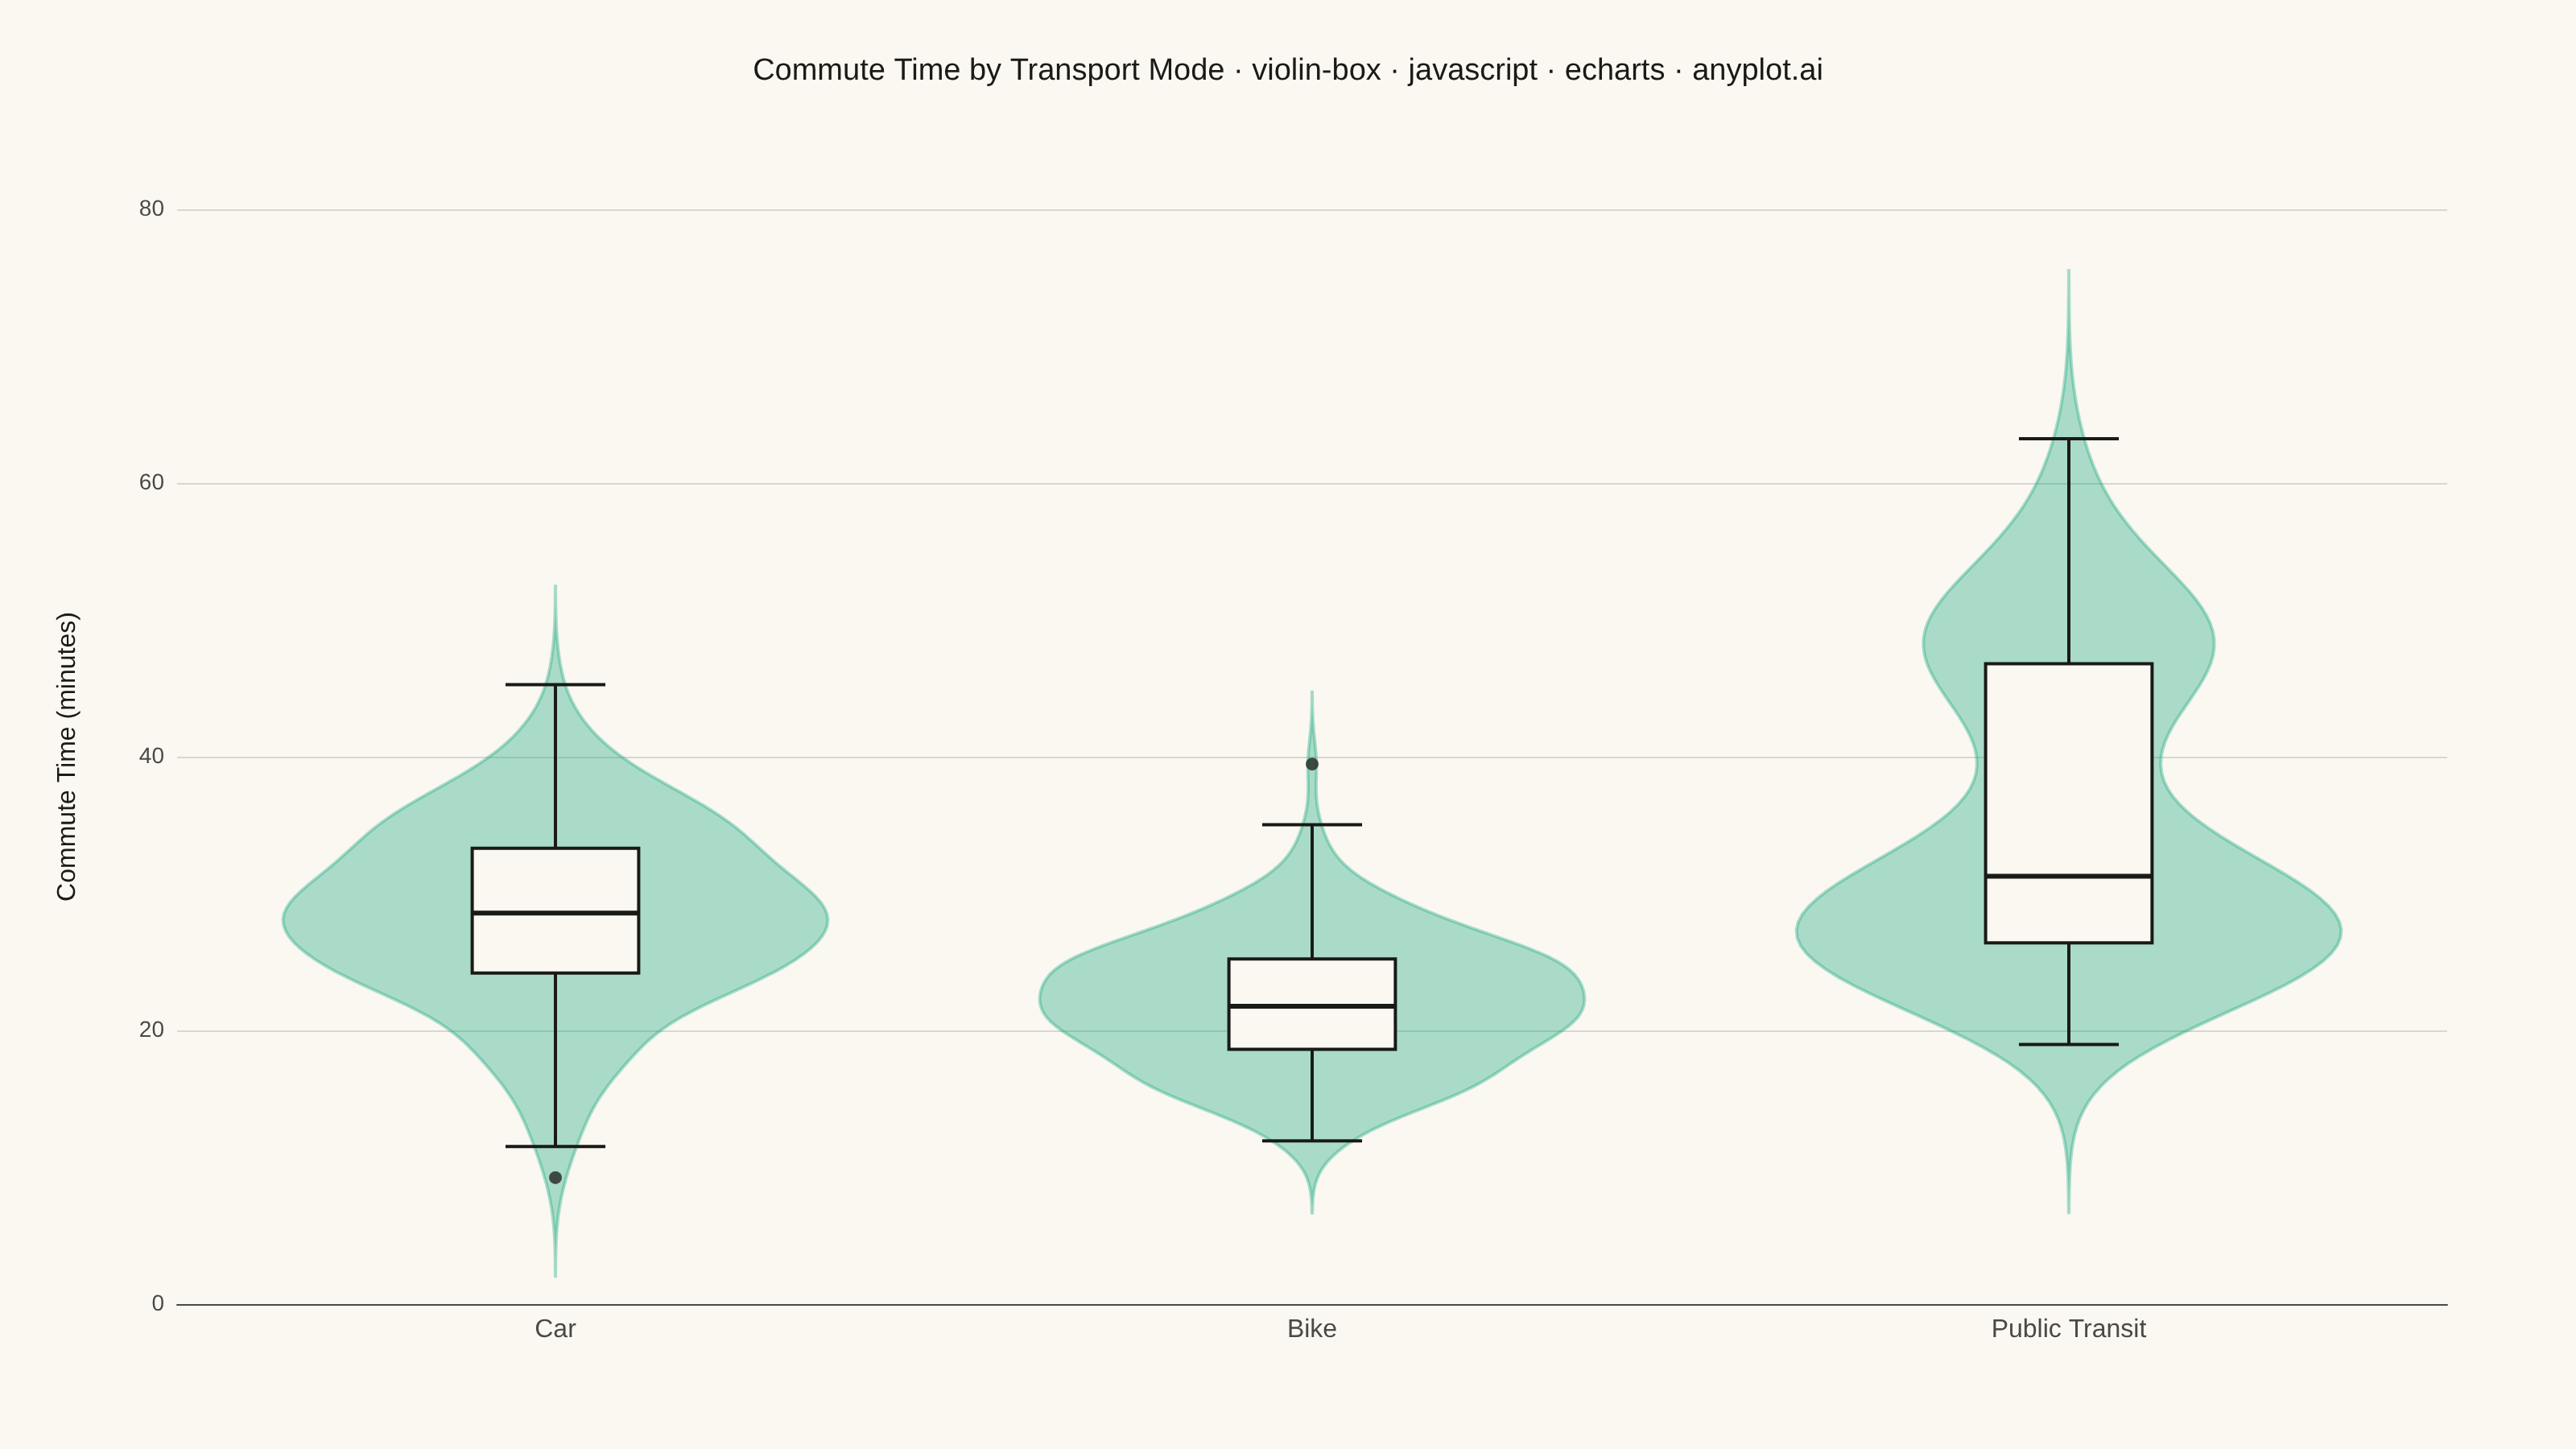
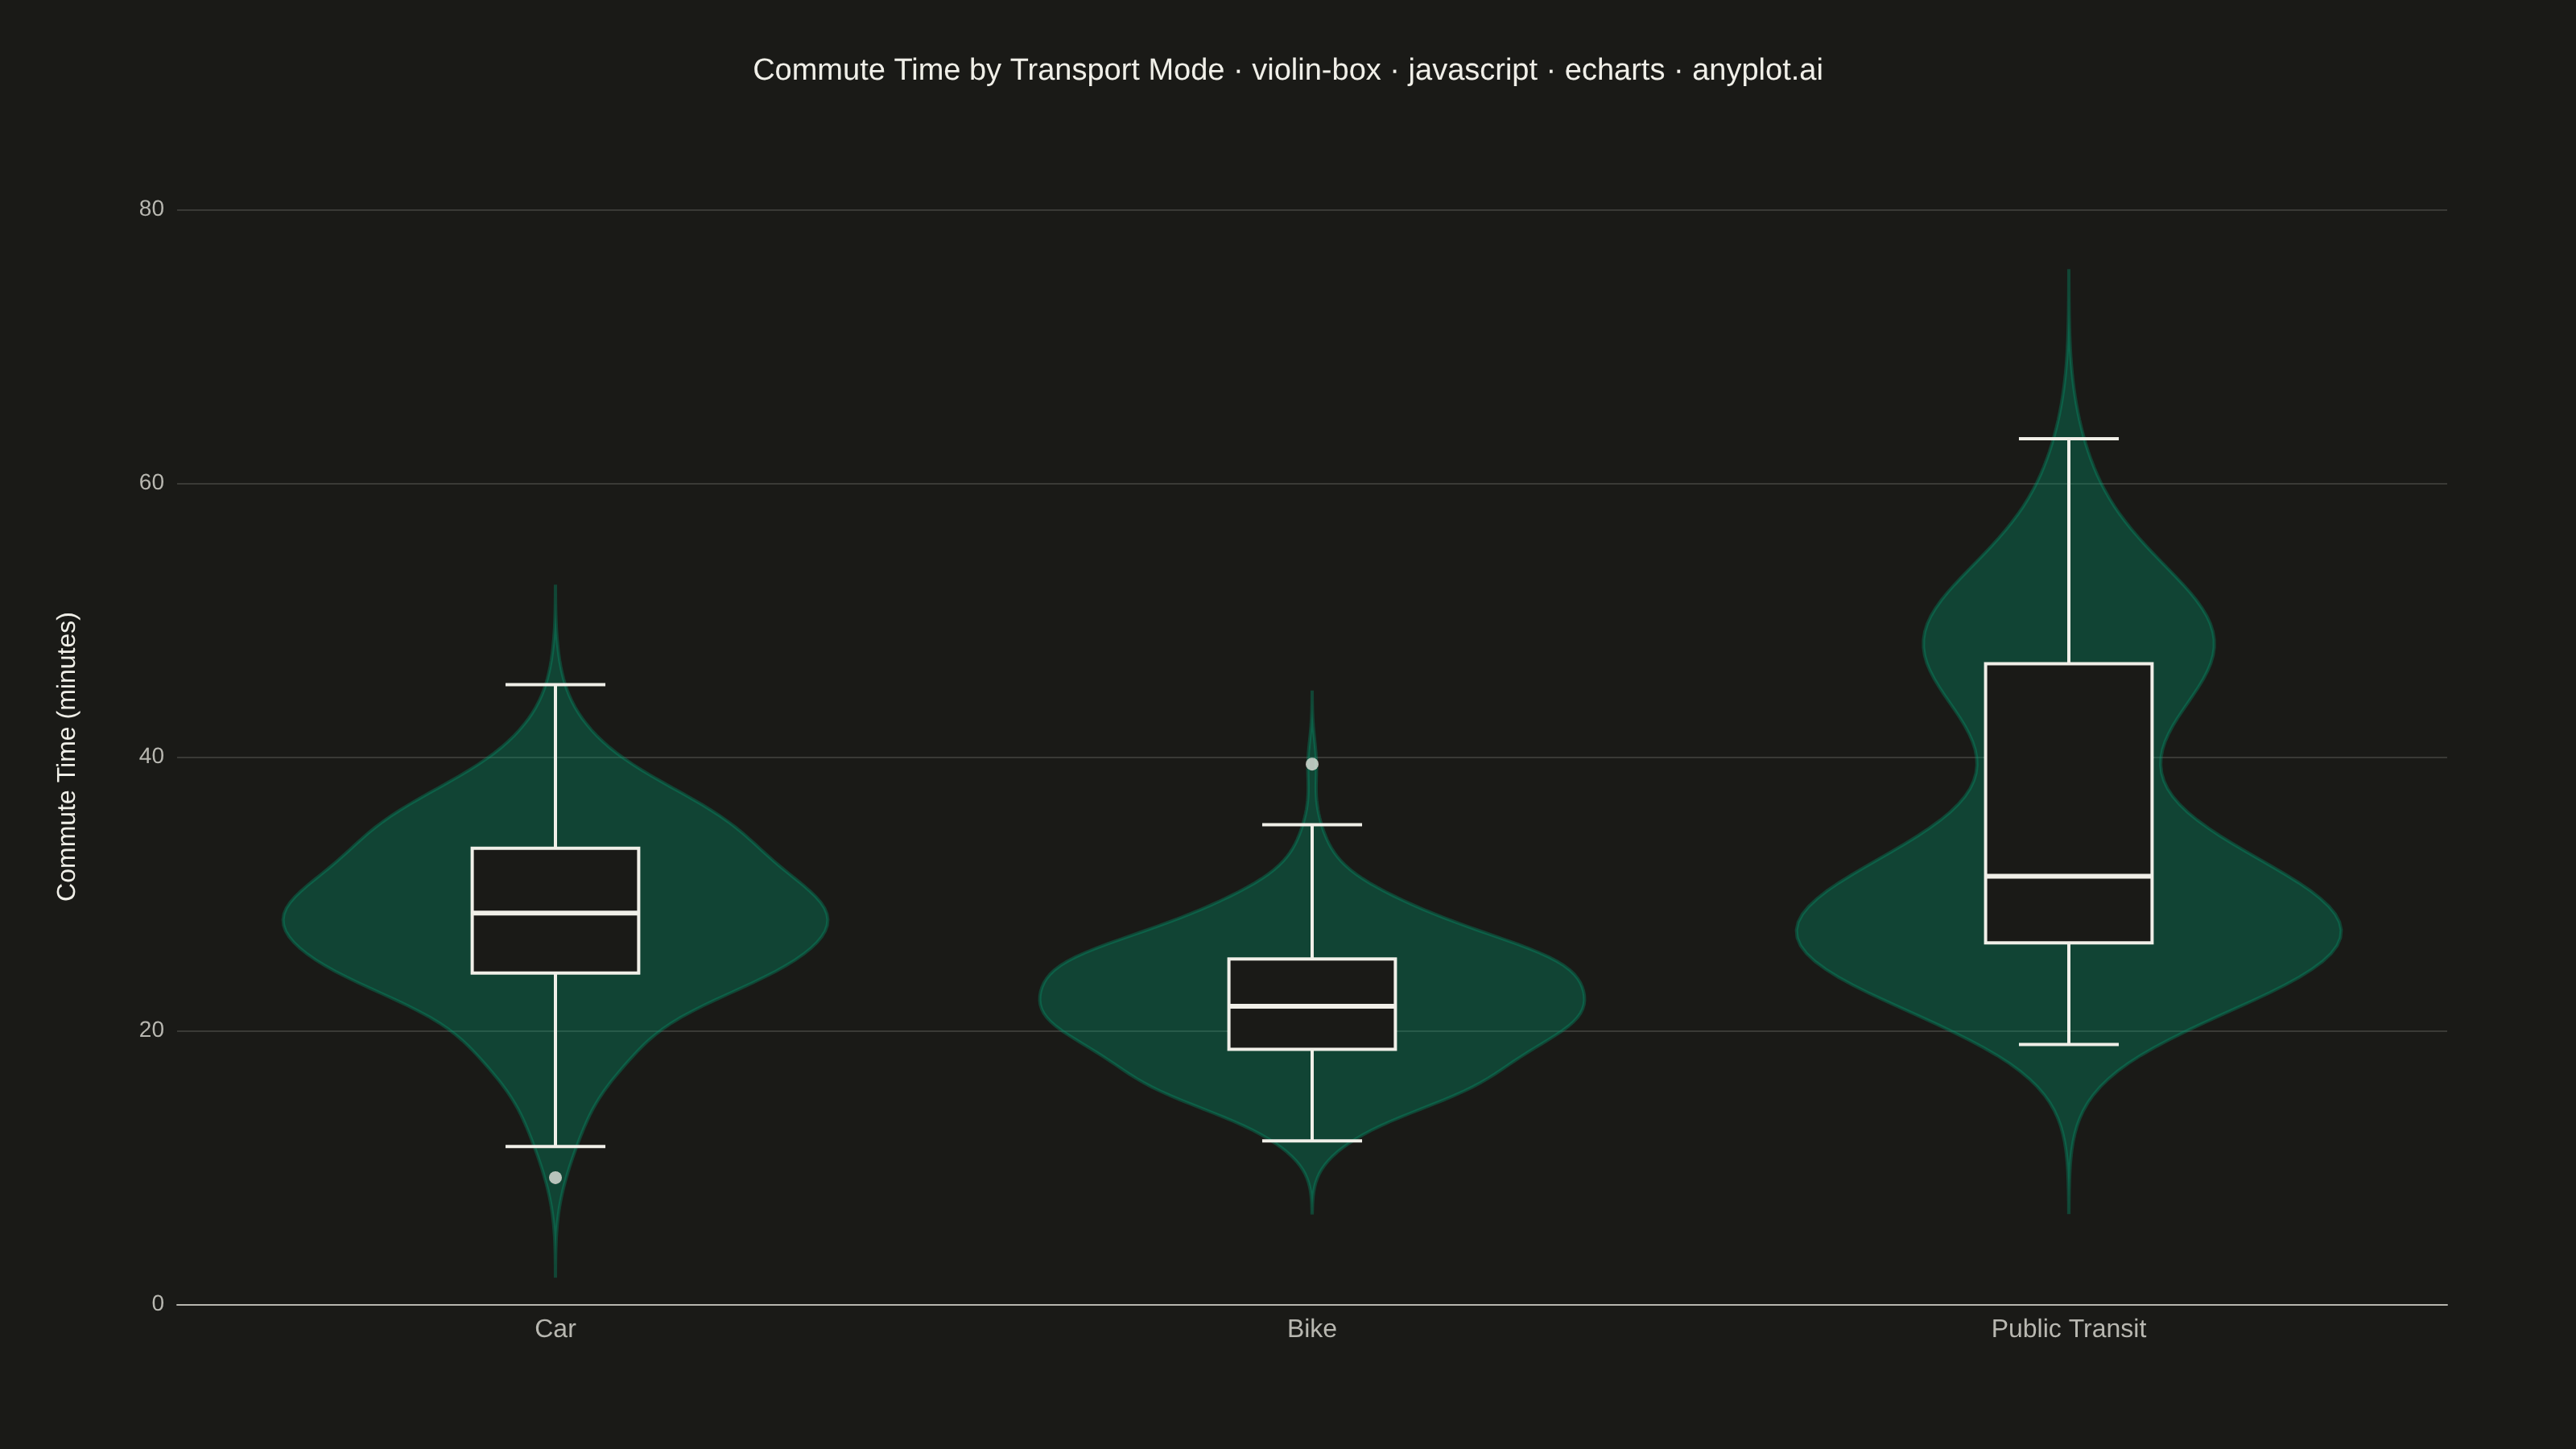
A violin plot with an embedded box plot inside, combining the distribution shape visualization (KDE) with traditional quartile statistics. Shows both the probability density and summary statistics in one plot.
// anyplot.ai
// violin-box: Violin Plot with Embedded Box Plot
// Library: echarts 6.1.0 | JavaScript 22.23.2
// Quality: 90/100 | Created: 2026-09-09

const t = window.ANYPLOT_TOKENS;

// --- Data (in-memory, deterministic) ----------------------------------------
// Commute time (minutes) by transport mode. Public Transit is generated as a
// mix of a direct-route trip and a slower transfer-route trip, producing a
// bimodal distribution the violin's KDE reveals but the box plot alone hides.
function lcg(seed) {
  let state = seed >>> 0;
  return () => {
    state = (state * 1664525 + 1013904223) >>> 0;
    return state / 4294967296;
  };
}
const rand = lcg(42);
function randNormal(mean, std) {
  const u1 = Math.max(rand(), 1e-9);
  const u2 = rand();
  const z = Math.sqrt(-2 * Math.log(u1)) * Math.cos(2 * Math.PI * u2);
  return mean + z * std;
}

const GROUPS = ["Car", "Bike", "Public Transit"];
const N = 200;

const carTimes = Array.from({ length: N }, () => Math.max(2, randNormal(28, 7)));
const bikeTimes = Array.from({ length: N }, () => Math.max(2, randNormal(22, 5)));
const transitTimes = Array.from({ length: N }, () =>
  Math.max(2, rand() < 0.6 ? randNormal(28, 4) : randNormal(48, 6))
);
const dataByGroup = [carTimes, bikeTimes, transitTimes];

// --- Stats helpers ------------------------------------------------------------
function quantile(sorted, p) {
  const idx = p * (sorted.length - 1);
  const lo = Math.floor(idx);
  const hi = Math.ceil(idx);
  if (lo === hi) return sorted[lo];
  return sorted[lo] + (sorted[hi] - sorted[lo]) * (idx - lo);
}

function boxStats(values) {
  const sorted = [...values].sort((a, b) => a - b);
  const q1 = quantile(sorted, 0.25);
  const median = quantile(sorted, 0.5);
  const q3 = quantile(sorted, 0.75);
  const iqr = q3 - q1;
  const lowerFence = q1 - 1.5 * iqr;
  const upperFence = q3 + 1.5 * iqr;
  const inFence = sorted.filter((v) => v >= lowerFence && v <= upperFence);
  const outliers = sorted.filter((v) => v < lowerFence || v > upperFence);
  return { min: inFence[0], q1, median, q3, max: inFence[inFence.length - 1], outliers };
}

// Each violin's KDE is evaluated over its OWN local range (data extent ±3
// bandwidths), not the shared axis range — otherwise the gaussian kernel's
// near-zero-but-nonzero tail stretches every violin into a thin needle all the
// way to the tallest group's max, even for groups with a much smaller range.
function kde(values, gridN, axisMin) {
  const mean = values.reduce((a, b) => a + b, 0) / values.length;
  const variance = values.reduce((a, b) => a + (b - mean) ** 2, 0) / values.length;
  const std = Math.sqrt(variance);
  const bandwidth = 1.06 * std * Math.pow(values.length, -0.2);
  const localMin = Math.max(axisMin, Math.min(...values) - 3 * bandwidth);
  const localMax = Math.max(...values) + 3 * bandwidth;
  const points = [];
  for (let i = 0; i <= gridN; i++) {
    const y = localMin + (i / gridN) * (localMax - localMin);
    let sum = 0;
    for (const v of values) {
      const u = (y - v) / bandwidth;
      sum += Math.exp(-0.5 * u * u);
    }
    points.push({ y, density: sum / (values.length * bandwidth * Math.sqrt(2 * Math.PI)) });
  }
  return points;
}

const gridMin = 0;
const kdeByGroup = dataByGroup.map((vals) => kde(vals, 120, gridMin));
const kdeMax = Math.max(...kdeByGroup.flat().map((p) => p.y));
const gridMax = Math.ceil(kdeMax / 10) * 10;
const statsByGroup = dataByGroup.map(boxStats);

// --- Init ---------------------------------------------------------------------
const chart = echarts.init(document.getElementById("container"));

// --- Custom renderers ----------------------------------------------------------
function renderViolin(params, api) {
  const idx = api.value(0);
  const points = kdeByGroup[idx];
  const maxDensity = Math.max(...points.map((p) => p.density));
  const bandWidth = api.size([1, 0])[0];
  const halfWidthPx = bandWidth * 0.36;

  const left = points.map((p) => {
    const [x, y] = api.coord([idx, p.y]);
    return [x - halfWidthPx * (p.density / maxDensity), y];
  });
  const right = points
    .slice()
    .reverse()
    .map((p) => {
      const [x, y] = api.coord([idx, p.y]);
      return [x + halfWidthPx * (p.density / maxDensity), y];
    });

  return {
    type: "polygon",
    shape: { points: left.concat(right) },
    style: { fill: t.palette[0], opacity: 0.32, stroke: t.palette[0], lineWidth: 2 },
  };
}

function renderBox(params, api) {
  const idx = api.value(0);
  const s = statsByGroup[idx];
  const bandWidth = api.size([1, 0])[0];
  const boxHalfPx = bandWidth * 0.11;

  const centerCoord = api.coord([idx, s.median]);
  const cx = centerCoord[0];
  const [, yMin] = api.coord([idx, s.min]);
  const [, yQ1] = api.coord([idx, s.q1]);
  const [, yMedian] = api.coord([idx, s.median]);
  const [, yQ3] = api.coord([idx, s.q3]);
  const [, yMax] = api.coord([idx, s.max]);

  const whisker = {
    type: "polyline",
    shape: { points: [[cx, yMin], [cx, yQ1], [cx, yQ3], [cx, yMax]] },
    style: { stroke: t.ink, lineWidth: 2, fill: "none" },
  };
  const capMin = {
    type: "line",
    shape: { x1: cx - boxHalfPx * 0.6, y1: yMin, x2: cx + boxHalfPx * 0.6, y2: yMin },
    style: { stroke: t.ink, lineWidth: 2 },
  };
  const capMax = {
    type: "line",
    shape: { x1: cx - boxHalfPx * 0.6, y1: yMax, x2: cx + boxHalfPx * 0.6, y2: yMax },
    style: { stroke: t.ink, lineWidth: 2 },
  };
  const box = {
    type: "rect",
    shape: { x: cx - boxHalfPx, y: yQ3, width: boxHalfPx * 2, height: yQ1 - yQ3 },
    style: { fill: t.pageBg, stroke: t.ink, lineWidth: 2 },
  };
  const medianLine = {
    type: "line",
    shape: { x1: cx - boxHalfPx, y1: yMedian, x2: cx + boxHalfPx, y2: yMedian },
    style: { stroke: t.ink, lineWidth: 3 },
  };

  return { type: "group", children: [whisker, capMin, capMax, box, medianLine] };
}

const outlierData = statsByGroup.flatMap((s, idx) => s.outliers.map((v) => [idx, v]));

// --- Option ---------------------------------------------------------------------
const title = "Commute Time by Transport Mode · violin-box · javascript · echarts · anyplot.ai";

chart.setOption({
  animation: false,
  backgroundColor: "transparent",
  title: {
    text: title,
    left: "center",
    top: 30,
    textStyle: { color: t.ink, fontSize: 19, fontWeight: 500 },
  },
  grid: { left: 110, right: 80, top: 130, bottom: 90 },
  xAxis: {
    type: "category",
    data: GROUPS,
    axisLabel: { color: t.inkSoft, fontSize: 16 },
    axisLine: { lineStyle: { color: t.inkSoft } },
    axisTick: { show: false },
    splitLine: { show: false },
  },
  yAxis: {
    type: "value",
    name: "Commute Time (minutes)",
    nameLocation: "middle",
    nameGap: 60,
    nameTextStyle: { color: t.ink, fontSize: 16 },
    min: gridMin,
    max: gridMax,
    axisLabel: { color: t.inkSoft, fontSize: 14 },
    axisLine: { show: false },
    splitLine: { lineStyle: { color: t.grid } },
  },
  series: [
    {
      type: "custom",
      name: "Distribution",
      renderItem: renderViolin,
      data: GROUPS.map((_, idx) => idx),
      encode: { x: 0 },
      z: 2,
      silent: true,
    },
    {
      type: "custom",
      name: "Quartiles",
      renderItem: renderBox,
      data: GROUPS.map((_, idx) => idx),
      encode: { x: 0 },
      z: 3,
      silent: true,
    },
    {
      type: "scatter",
      name: "Outliers",
      data: outlierData,
      symbolSize: 8,
      itemStyle: { color: t.ink, opacity: 0.75 },
      z: 4,
    },
  ],
});

chart.on("finished", () => {
  window.__anyplotReady = true;
});
Runnable source as JSON, for any HTTP client: https://api.anyplot.ai/specs/violin-box/echarts/code. Any spec id and library id listed in llms-full.txt fit the same URL shape; every URL below is complete and callable.
{
  "spec_id": "violin-box",
  "language": "javascript",
  "library": "echarts",
  "page": "https://anyplot.ai/violin-box/javascript/echarts",
  "hub": "https://anyplot.ai/violin-box",
  "code_json": "https://api.anyplot.ai/specs/violin-box/echarts/code",
  "spec_json": "https://api.anyplot.ai/specs/violin-box",
  "render_light_png": "https://storage.googleapis.com/anyplot-images/plots/violin-box/javascript/echarts/plot-light.png",
  "render_dark_png": "https://storage.googleapis.com/anyplot-images/plots/violin-box/javascript/echarts/plot-dark.png",
  "interactive_light_html": "https://storage.googleapis.com/anyplot-images/plots/violin-box/javascript/echarts/plot-light.html",
  "interactive_dark_html": "https://storage.googleapis.com/anyplot-images/plots/violin-box/javascript/echarts/plot-dark.html",
  "quality_score": 90.0,
  "license": "MIT",
  "guide": "https://anyplot.ai/llms.txt"
}
Part of Violin Plot with Embedded Box Plot on anyplot.ai.