The same plot in 14 other libraries — JavaScript: Chart.js, Apache ECharts, Highcharts, MUI X Charts; Python: Altair, Bokeh, lets-plot, Matplotlib, Plotly, plotnine, Pygal, Seaborn; R: ggplot2; Julia: Makie.jl. Compare all 15 side by side: Wind Rose Chart in Python, R, Julia and JavaScript.
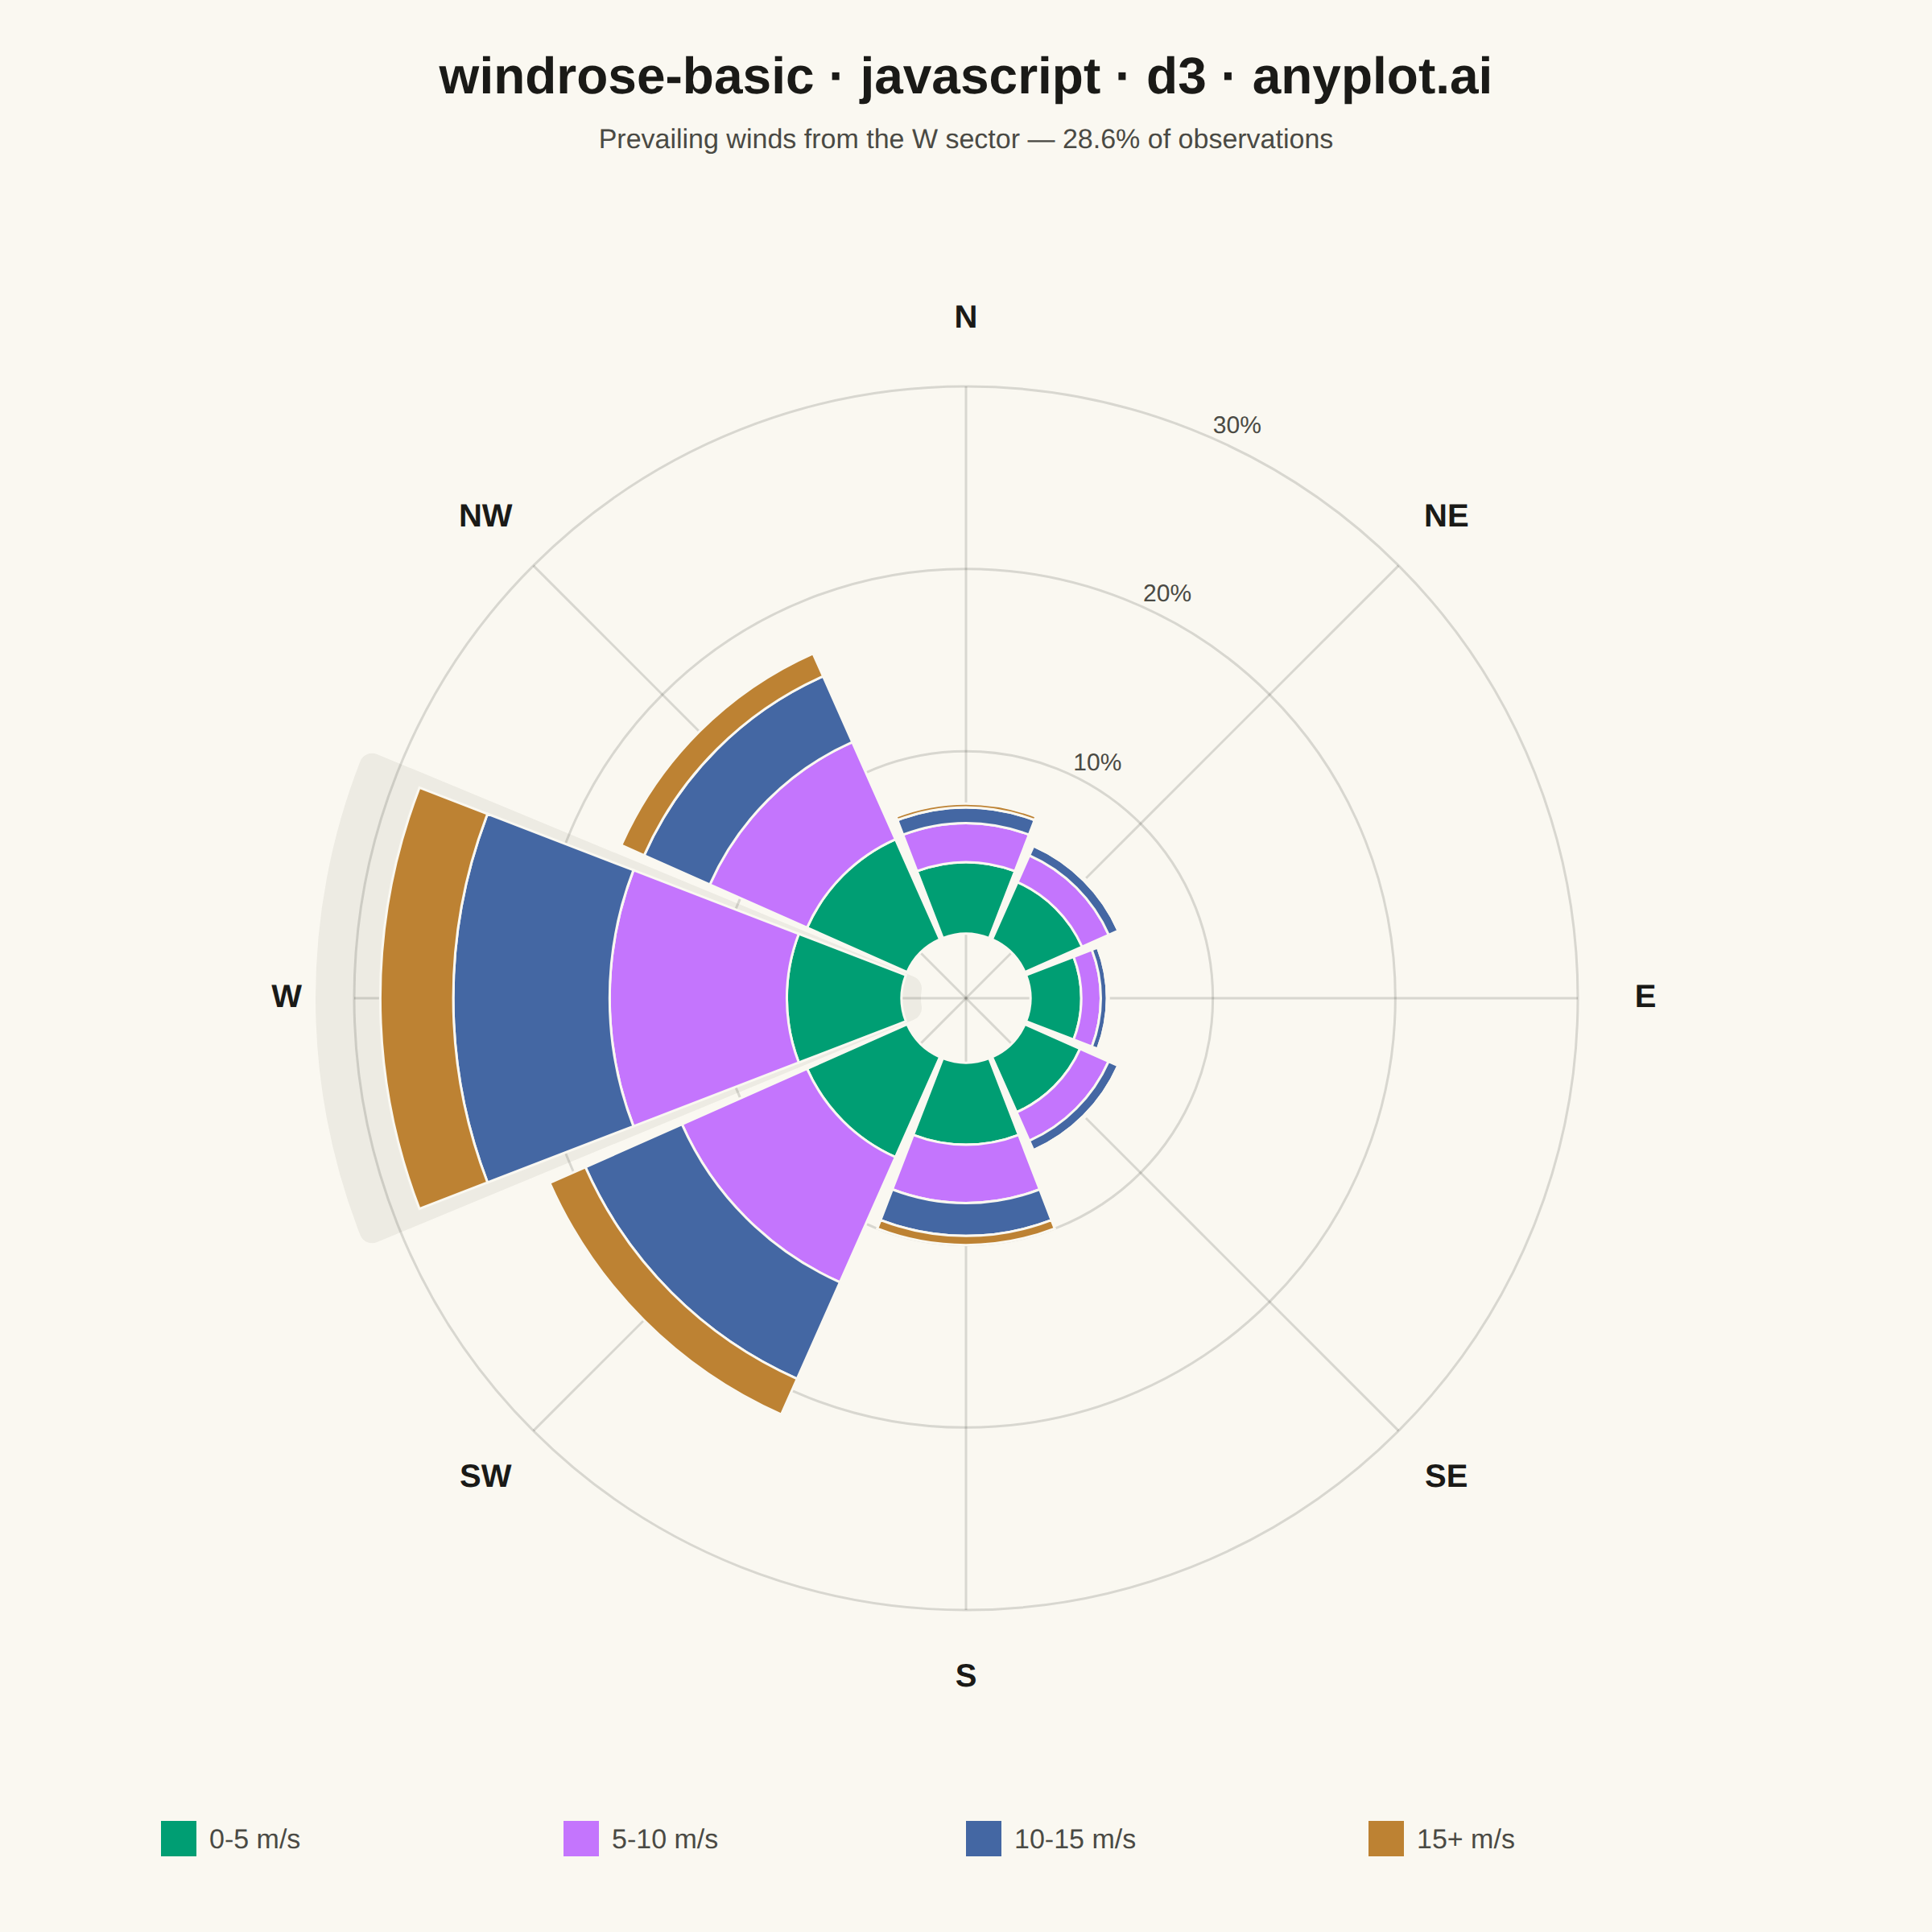
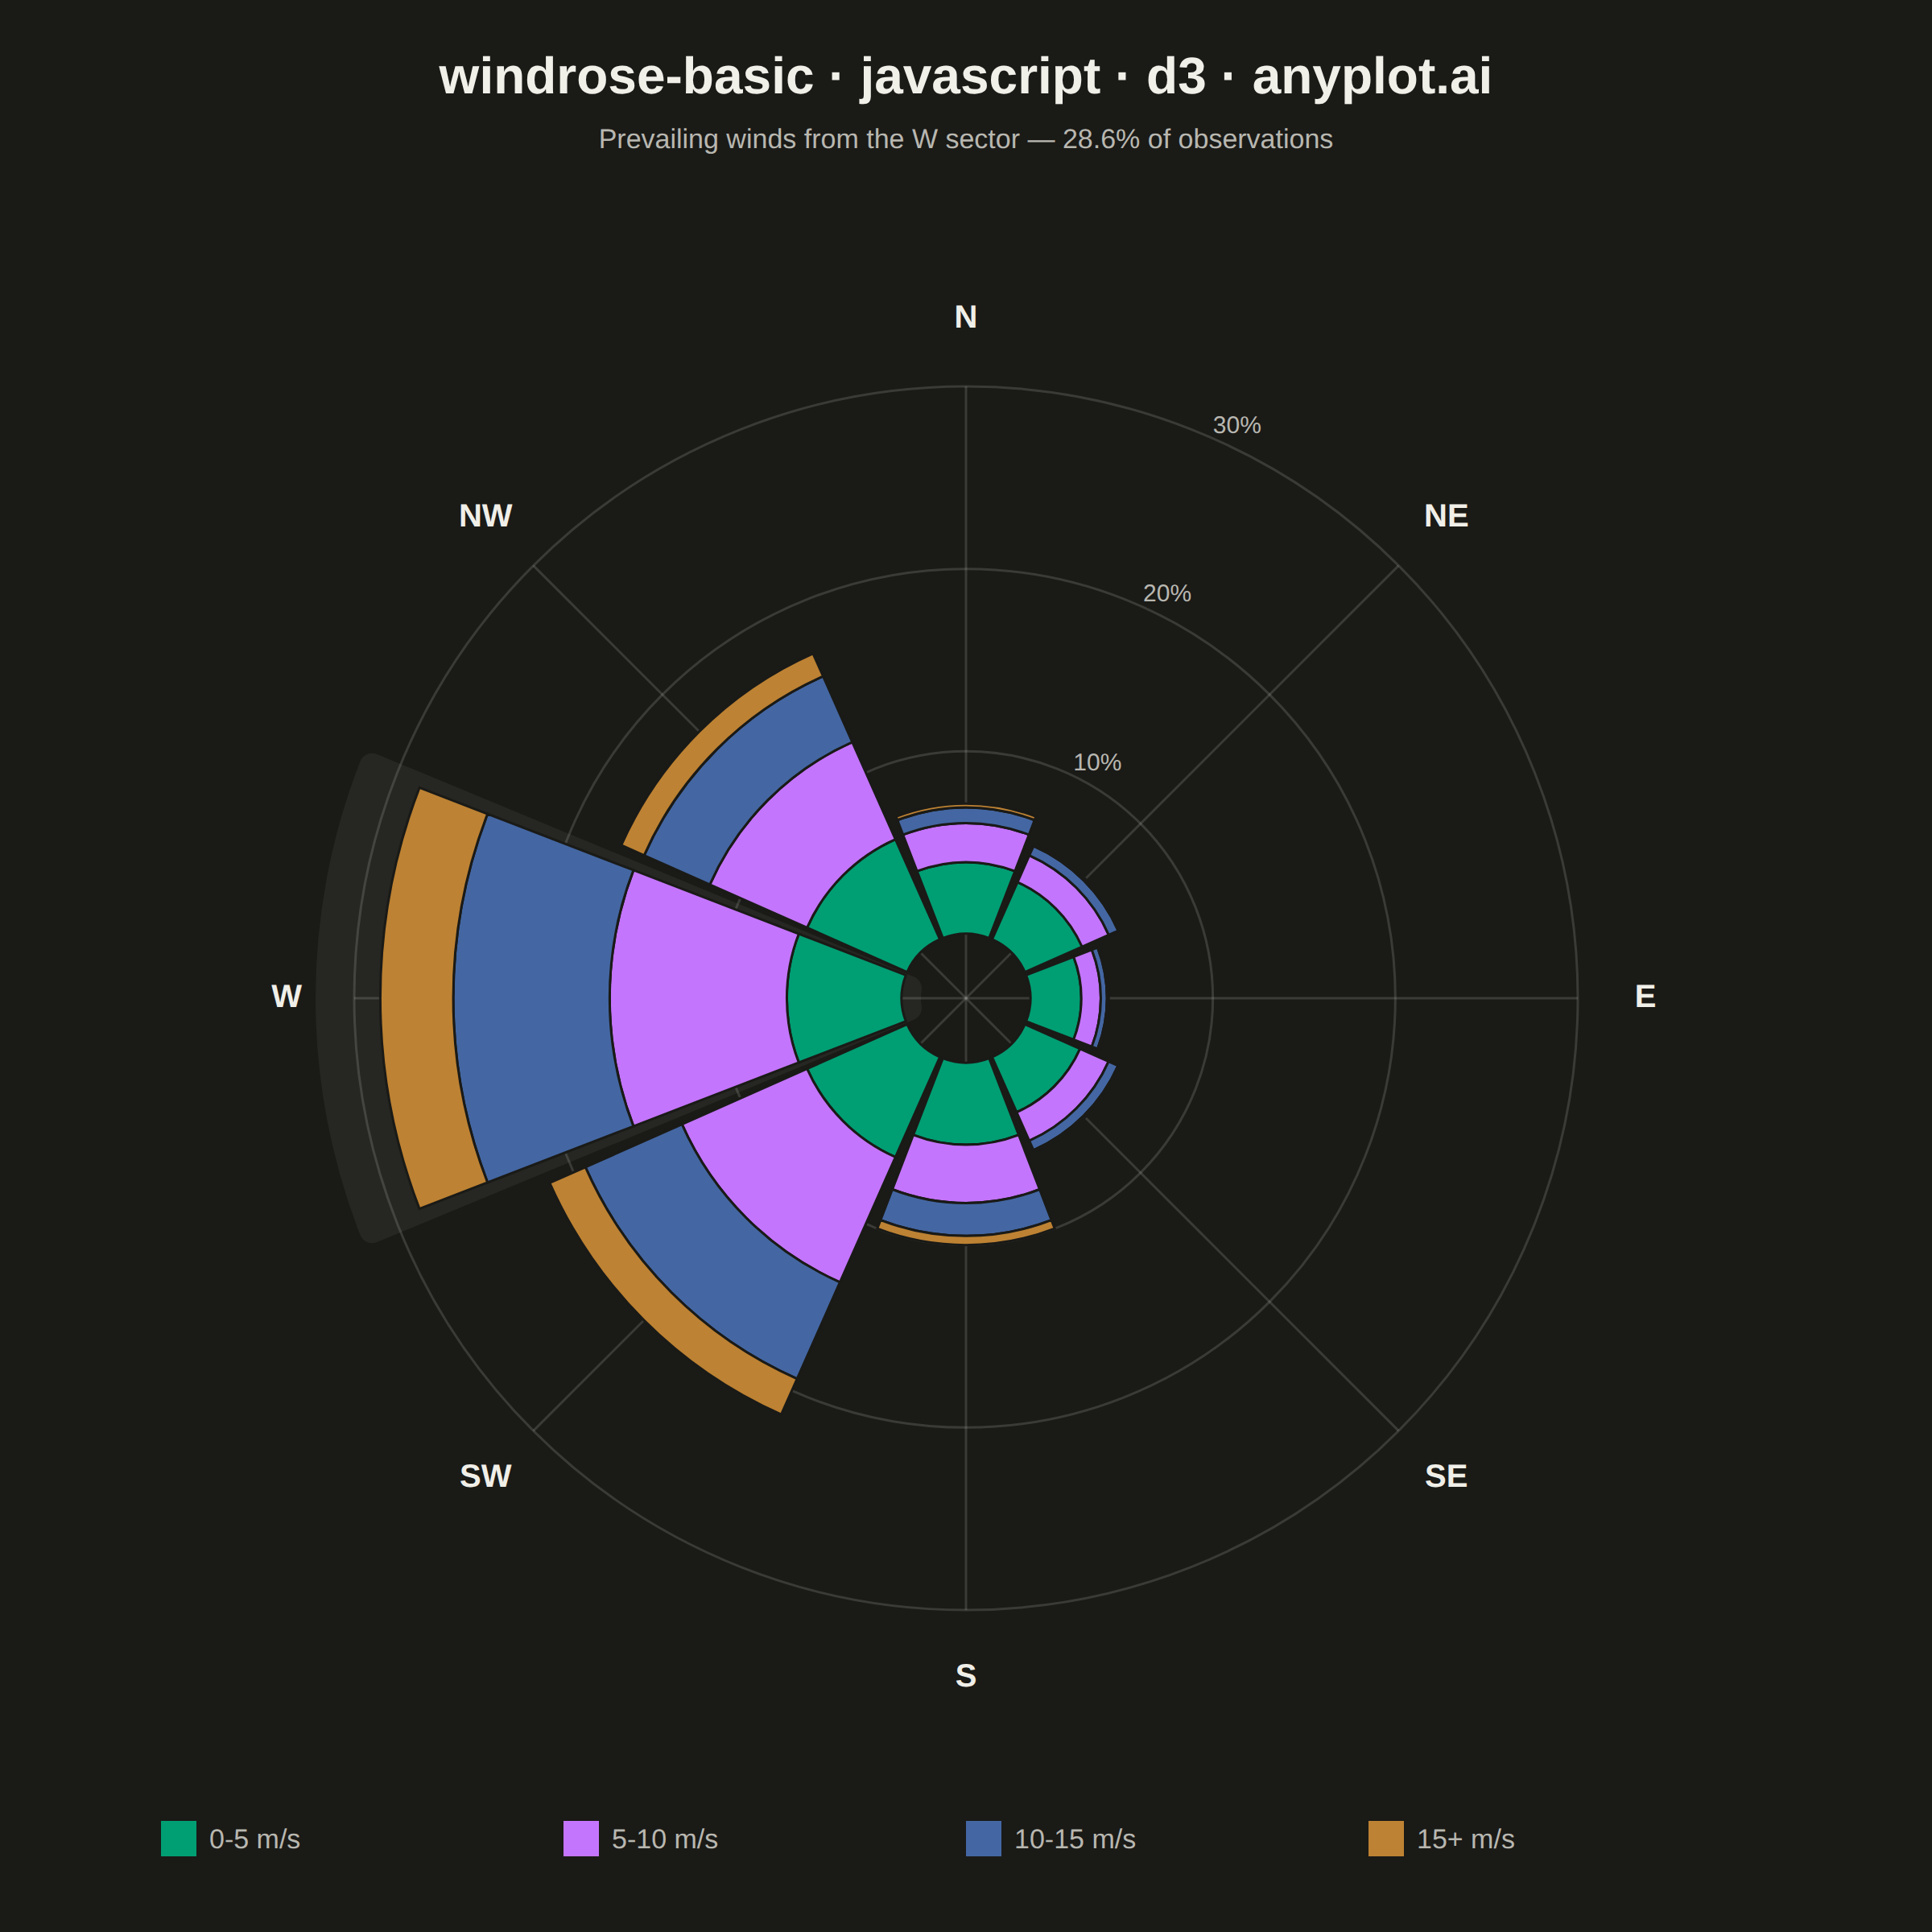
A wind rose displays wind speed and direction data as a polar stacked histogram showing the frequency distribution of wind across compass directions. Each spoke represents a direction sector (typically 8-16 bins), with stacked colored segments indicating different wind speed ranges. This specialized meteorological visualization reveals dominant wind patterns, prevailing directions, and speed distributions simultaneously, making it essential for site assessment and environmental analysis.
// anyplot.ai
// windrose-basic: Wind Rose Chart
// Library: d3 7.9.0 | JavaScript 22.23.1
// Quality: 96/100 | Created: 2026-08-05
//# anyplot-orientation: square

const t = window.ANYPLOT_TOKENS;
const { width, height } = window.ANYPLOT_SIZE;

// --- Data --------------------------------------------------------------
// Hourly wind observations from an offshore wind-farm site-assessment study
// (one year), aggregated into 8 compass sectors x 4 speed bins. Values are
// percent of all observations; direction totals show a prevailing SW/W
// pattern typical of Northern Hemisphere mid-latitude sites.
const directions = ["N", "NE", "E", "SE", "S", "SW", "W", "NW"];
const speedBins = ["0-5 m/s", "5-10 m/s", "10-15 m/s", "15+ m/s"];
const frequency = [
  [3.93, 2.14, 0.86, 0.21], // N
  [3.43, 1.6, 0.57, 0.11], // NE
  [2.79, 1.07, 0.34, 0.09], // E
  [3.31, 1.71, 0.57, 0.11], // SE
  [4.5, 3.2, 1.8, 0.5], // S
  [6.0, 7.5, 5.79, 2.14], // SW
  [6.29, 9.71, 8.57, 4.0], // W
  [6.0, 5.83, 3.94, 1.37], // NW
];

const stackKeys = d3.range(speedBins.length);
const stackRows = directions.map((dir, i) => {
  const row = { dir, i };
  frequency[i].forEach((value, b) => (row[b] = value));
  return row;
});
const segments = d3
  .stack()
  .keys(stackKeys)(stackRows)
  .flatMap((series, b) => series.map((d) => ({ dir: d.data.dir, i: d.data.i, b, seg: [d[0], d[1]] })));

// Dominant direction (highest total frequency) drives the storytelling highlight below.
const dominant = d3.greatest(
  directions.map((dir, i) => ({ dir, i, total: d3.sum(frequency[i]) })),
  (d) => d.total,
);

// --- Scales --------------------------------------------------------------
const cx = width / 2;
const cy = height / 2 + 20;
const outerR = 380;
const innerR = 40;
const gridMax = 30;
const gridTicks = [10, 20, 30];

const radius = d3.scaleLinear().domain([0, gridMax]).range([innerR, outerR]);
const angleStep = (2 * Math.PI) / directions.length;
const padAngle = 0.05;
const color = d3.scaleOrdinal().domain(speedBins).range(t.palette.slice(0, speedBins.length));

// --- SVG mount -------------------------------------------------------------
const svg = d3.select("#container").append("svg").attr("width", width).attr("height", height);
const g = svg.append("g").attr("transform", `translate(${cx},${cy})`);

// --- Dominant-sector highlight (behind grid, drives the storytelling) -------
const highlightArc = d3
  .arc()
  .innerRadius(innerR - 12)
  .outerRadius(outerR + 24)
  .cornerRadius(8)
  .startAngle(dominant.i * angleStep - angleStep / 2)
  .endAngle(dominant.i * angleStep + angleStep / 2);

g.append("path").attr("d", highlightArc).attr("fill", t.ink).attr("opacity", 0.06);

// --- Radial grid circles + percentage labels --------------------------------
const gridGroup = g.append("g");
gridGroup
  .selectAll("circle")
  .data(gridTicks)
  .join("circle")
  .attr("r", (d) => radius(d))
  .attr("fill", "none")
  .attr("stroke", t.grid)
  .attr("stroke-width", 1.5);

const tickAngle = angleStep / 2;
gridGroup
  .selectAll("text")
  .data(gridTicks)
  .join("text")
  .attr("x", (d) => radius(d) * Math.sin(tickAngle) + 8)
  .attr("y", (d) => -radius(d) * Math.cos(tickAngle))
  .attr("fill", t.inkSoft)
  .style("font-size", "15px")
  .text((d) => `${d}%`);

// --- Angular spokes ----------------------------------------------------------
g.append("g")
  .selectAll("line")
  .data(directions)
  .join("line")
  .attr("x1", 0)
  .attr("y1", 0)
  .attr("x2", (_, i) => outerR * Math.sin(i * angleStep))
  .attr("y2", (_, i) => -outerR * Math.cos(i * angleStep))
  .attr("stroke", t.grid)
  .attr("stroke-width", 1.5);

// --- Stacked direction sectors ------------------------------------------------
const arcGen = d3
  .arc()
  .innerRadius((d) => radius(d.seg[0]))
  .outerRadius((d) => radius(d.seg[1]))
  .startAngle((d) => d.i * angleStep - angleStep / 2 + padAngle / 2)
  .endAngle((d) => d.i * angleStep + angleStep / 2 - padAngle / 2);

g.append("g")
  .selectAll("path")
  .data(segments)
  .join("path")
  .attr("d", arcGen)
  .attr("fill", (d) => color(speedBins[d.b]))
  .attr("stroke", t.pageBg)
  .attr("stroke-width", 1.5);

// --- Compass direction labels --------------------------------------------------
const labelR = outerR + 42;
g.append("g")
  .selectAll("text")
  .data(directions)
  .join("text")
  .attr("x", (_, i) => labelR * Math.sin(i * angleStep))
  .attr("y", (_, i) => -labelR * Math.cos(i * angleStep))
  .attr("text-anchor", "middle")
  .attr("dominant-baseline", "middle")
  .attr("fill", t.ink)
  .style("font-size", "20px")
  .style("font-weight", "600")
  .text((d) => d);

// --- Title + storytelling subtitle -------------------------------------------
svg
  .append("text")
  .attr("x", width / 2)
  .attr("y", 58)
  .attr("text-anchor", "middle")
  .attr("fill", t.ink)
  .style("font-size", "32px")
  .style("font-weight", "600")
  .text("windrose-basic · javascript · d3 · anyplot.ai");

svg
  .append("text")
  .attr("x", width / 2)
  .attr("y", 92)
  .attr("text-anchor", "middle")
  .attr("fill", t.inkSoft)
  .style("font-size", "17px")
  .text(`Prevailing winds from the ${dominant.dir} sector — ${dominant.total.toFixed(1)}% of observations`);

// --- Legend (speed-bin swatches) --------------------------------------------
const legendY = height - 56;
const slotWidth = 250;
const legendStartX = width / 2 - (slotWidth * speedBins.length) / 2;

const legend = svg.append("g");
legend
  .selectAll("rect")
  .data(speedBins)
  .join("rect")
  .attr("x", (_, i) => legendStartX + i * slotWidth)
  .attr("y", legendY - 13)
  .attr("width", 22)
  .attr("height", 22)
  .attr("fill", (d) => color(d));

legend
  .selectAll("text")
  .data(speedBins)
  .join("text")
  .attr("x", (_, i) => legendStartX + i * slotWidth + 30)
  .attr("y", legendY + 4)
  .attr("fill", t.inkSoft)
  .style("font-size", "17px")
  .text((d) => d);
Runnable source as JSON, for any HTTP client: https://api.anyplot.ai/specs/windrose-basic/d3/code. Any spec id and library id listed in llms-full.txt fit the same URL shape; every URL below is complete and callable.
{
  "spec_id": "windrose-basic",
  "language": "javascript",
  "library": "d3",
  "page": "https://anyplot.ai/windrose-basic/javascript/d3",
  "hub": "https://anyplot.ai/windrose-basic",
  "code_json": "https://api.anyplot.ai/specs/windrose-basic/d3/code",
  "spec_json": "https://api.anyplot.ai/specs/windrose-basic",
  "render_light_png": "https://storage.googleapis.com/anyplot-images/plots/windrose-basic/javascript/d3/plot-light.png",
  "render_dark_png": "https://storage.googleapis.com/anyplot-images/plots/windrose-basic/javascript/d3/plot-dark.png",
  "interactive_light_html": "https://storage.googleapis.com/anyplot-images/plots/windrose-basic/javascript/d3/plot-light.html",
  "interactive_dark_html": "https://storage.googleapis.com/anyplot-images/plots/windrose-basic/javascript/d3/plot-dark.html",
  "quality_score": 96.0,
  "license": "MIT",
  "guide": "https://anyplot.ai/llms.txt"
}
Part of Wind Rose Chart on anyplot.ai.