The same plot in 14 other libraries — Python: Altair, Bokeh, lets-plot, Matplotlib, Plotly, plotnine, Pygal, Seaborn; R: ggplot2; JavaScript: Chart.js, D3.js, Apache ECharts, Highcharts, MUI X Charts. Compare all 15 side by side: Wind Rose Chart in Python, R, Julia and JavaScript.
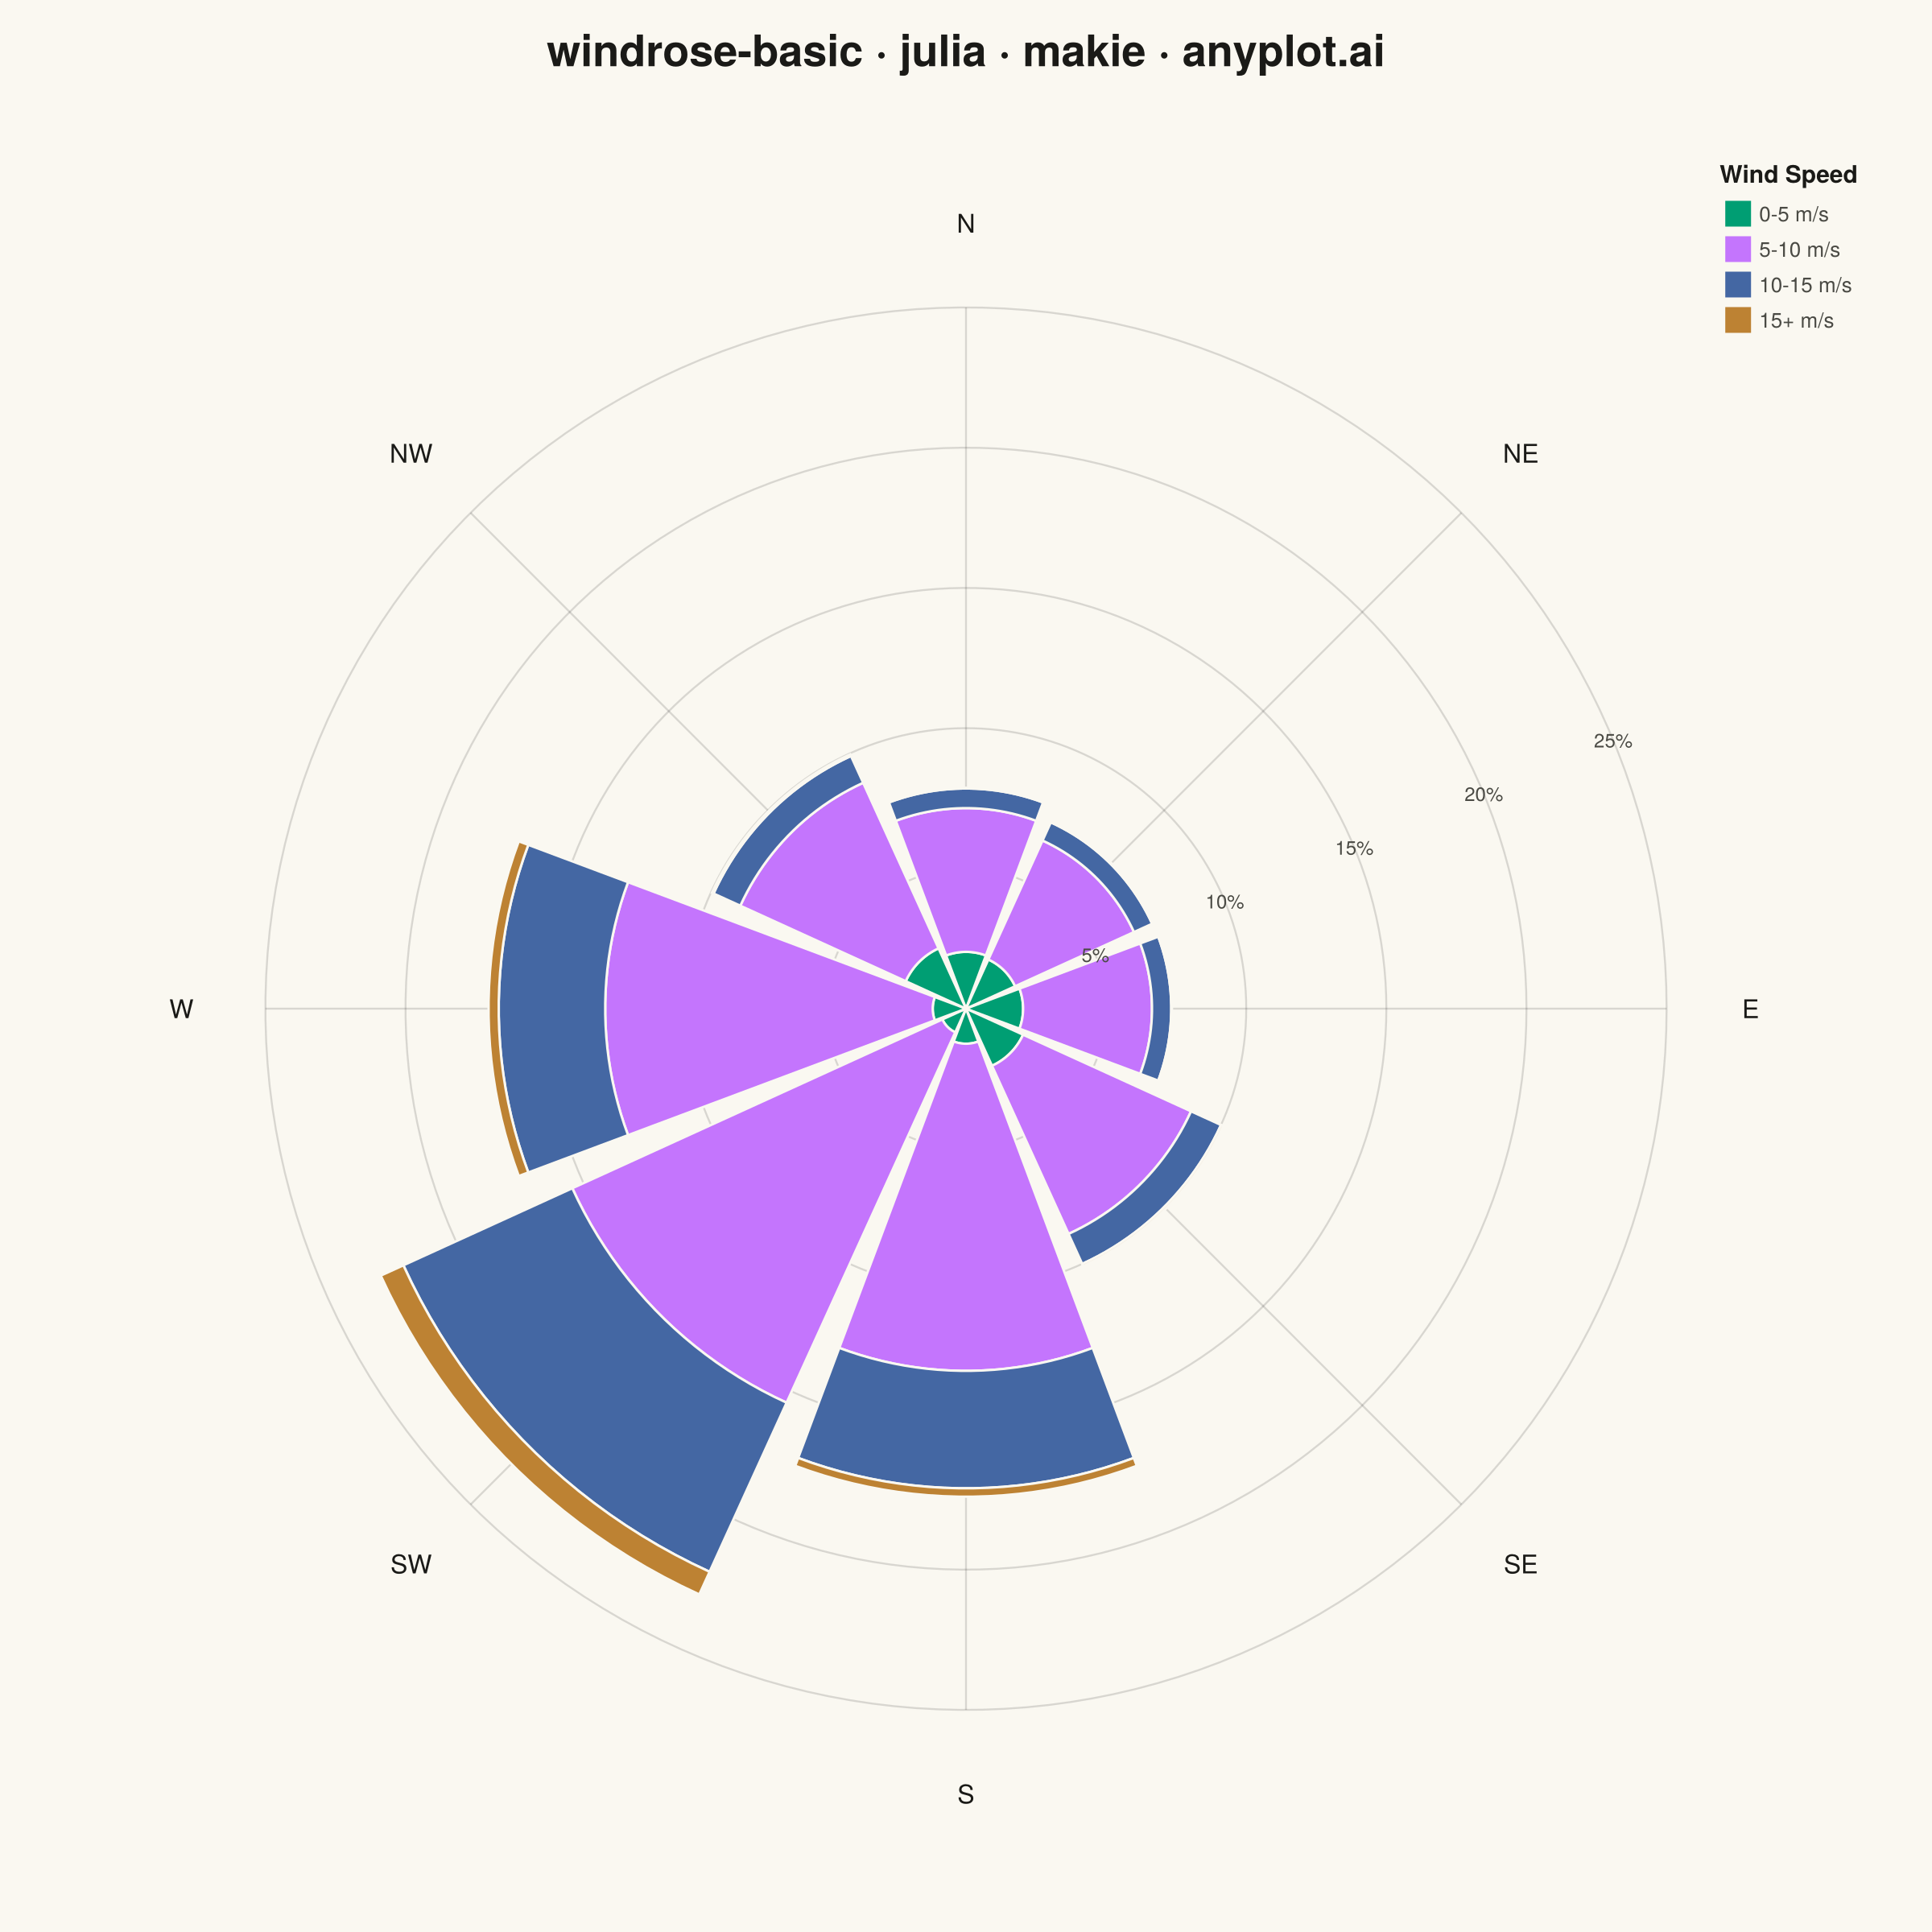
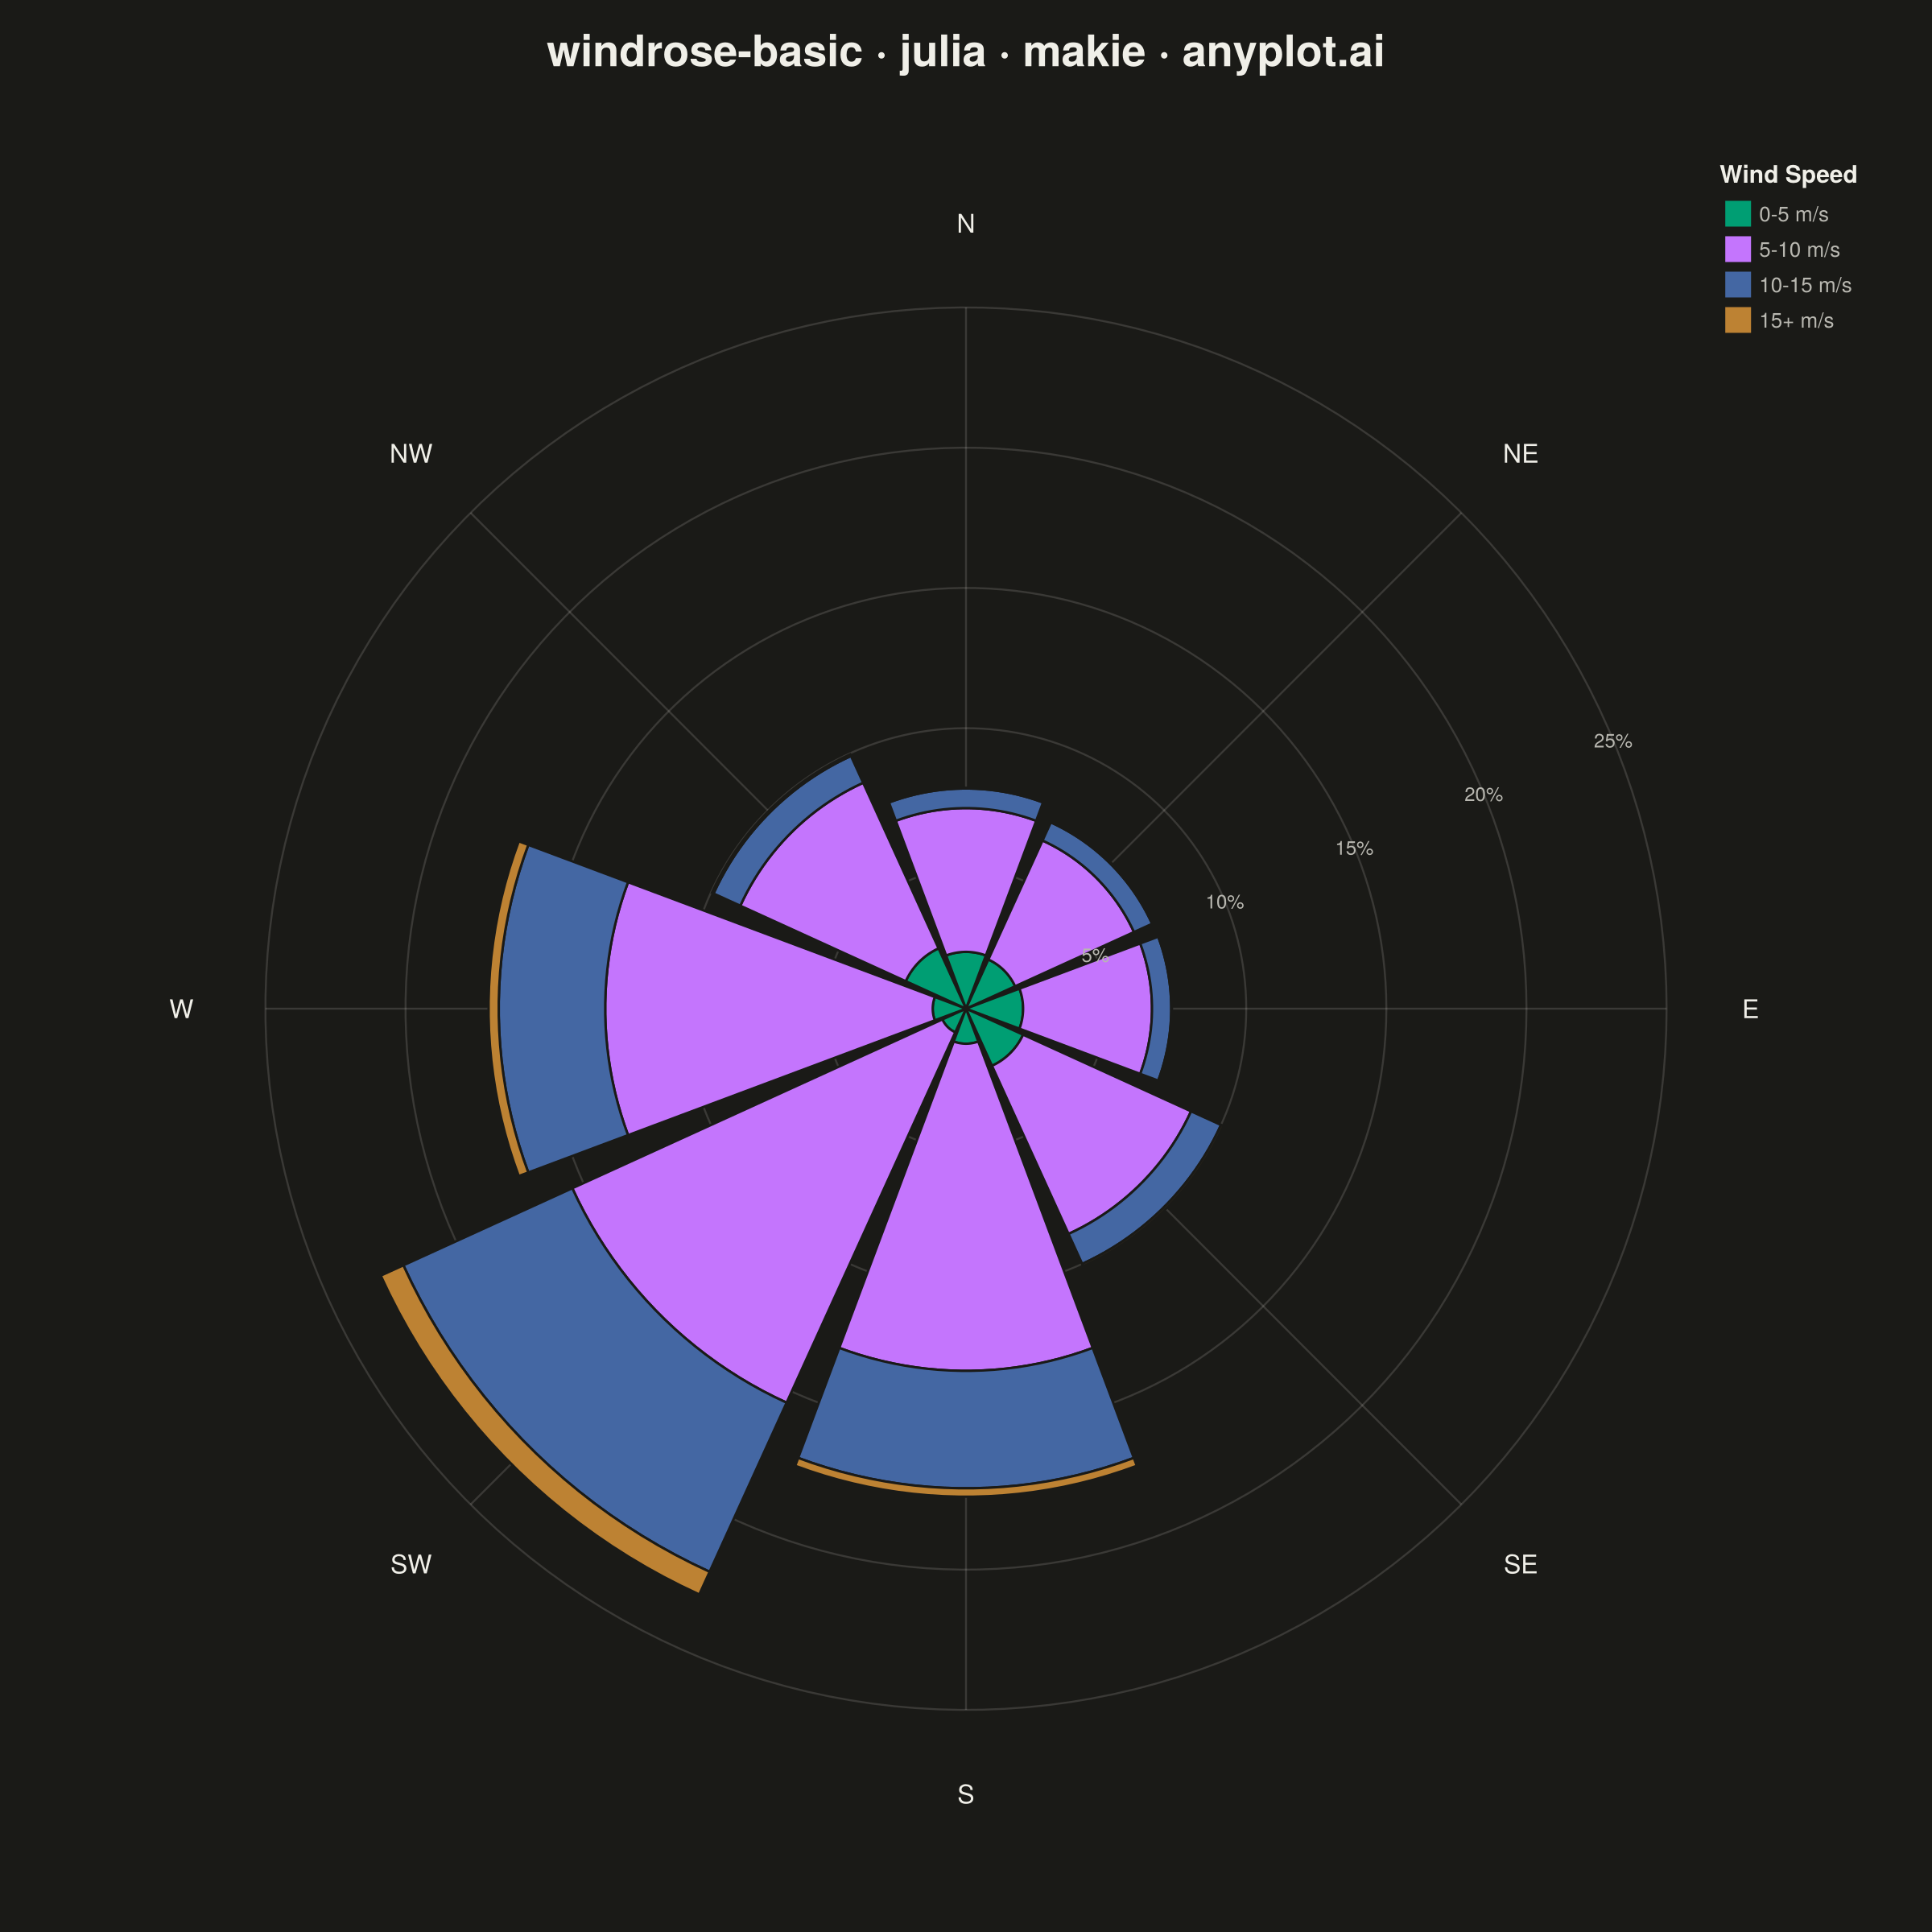
A wind rose displays wind speed and direction data as a polar stacked histogram showing the frequency distribution of wind across compass directions. Each spoke represents a direction sector (typically 8-16 bins), with stacked colored segments indicating different wind speed ranges. This specialized meteorological visualization reveals dominant wind patterns, prevailing directions, and speed distributions simultaneously, making it essential for site assessment and environmental analysis.
# anyplot.ai
# windrose-basic: Wind Rose Chart
# Library: makie 0.21.9 | Julia 1.11.9
# Quality: 90/100 | Created: 2026-08-05

using CairoMakie
using Colors
using Random

Random.seed!(42)

# --- Theme tokens -------------------------------------------------------------
THEME       = get(ENV, "ANYPLOT_THEME", "light")
PAGE_BG     = THEME == "light" ? colorant"#FAF8F1" : colorant"#1A1A17"
ELEVATED_BG = THEME == "light" ? colorant"#FFFDF6" : colorant"#242420"
INK         = THEME == "light" ? colorant"#1A1A17" : colorant"#F0EFE8"
INK_SOFT    = THEME == "light" ? colorant"#4A4A44" : colorant"#B8B7B0"
GRID        = RGBAf(red(INK), green(INK), blue(INK), 0.15)

IMPRINT_PALETTE = [
    colorant"#009E73", colorant"#C475FD", colorant"#4467A3", colorant"#BD8233",
    colorant"#AE3030", colorant"#2ABCCD", colorant"#954477", colorant"#99B314",
]

# --- Data ---------------------------------------------------------------------
# Simulated year of hourly wind observations at a coastal weather station,
# with a prevailing southwesterly flow plus a uniform background component.
n_obs = 8000
prevailing_deg = 225.0

n_prevailing = round(Int, 0.40 * n_obs)
n_background = n_obs - n_prevailing
directions = mod.(
    vcat(
        prevailing_deg .+ 45.0 .* randn(n_prevailing),
        360.0 .* rand(n_background),
    ),
    360.0,
)

alignment = max.(cosd.(directions .- prevailing_deg), 0.0)
speeds = clamp.(
    3.5 .+ 4.0 .* abs.(randn(n_obs)) .+ 5.0 .* alignment .* rand(n_obs),
    0.2, 30.0,
)

dir_labels = ["N", "NE", "E", "SE", "S", "SW", "W", "NW"]
n_dirs = length(dir_labels)
sector_width = 360.0 / n_dirs
dir_bin = [Int(mod(round(d / sector_width), n_dirs)) + 1 for d in directions]

speed_labels = ["0-5 m/s", "5-10 m/s", "10-15 m/s", "15+ m/s"]
n_speed = length(speed_labels)
speed_bin_of(s) = s < 5.0 ? 1 : (s < 10.0 ? 2 : (s < 15.0 ? 3 : 4))

freq = zeros(Float64, n_dirs, n_speed)
for (d, s) in zip(dir_bin, speeds)
    freq[d, speed_bin_of(s)] += 1.0
end
freq .= 100.0 .* freq ./ n_obs

# --- Geometry helpers -----------------------------------------------------------
# North at top, angles increasing clockwise (meteorological convention).
compass_to_screen(deg) = pi / 2 - deg2rad(deg)

function wedge_points(center_deg, half_width_deg, r0, r1; n = 24)
    a_hi = compass_to_screen(center_deg + half_width_deg)
    a_lo = compass_to_screen(center_deg - half_width_deg)
    outer = [Point2f(r1 * cos(a), r1 * sin(a)) for a in range(a_hi, a_lo, length = n)]
    inner = [Point2f(r0 * cos(a), r0 * sin(a)) for a in range(a_lo, a_hi, length = n)]
    return vcat(outer, inner)
end

# --- Plot -------------------------------------------------------------------
title_str = "windrose-basic · julia · makie · anyplot.ai"

fig = Figure(size = (1200, 1200), fontsize = 14, backgroundcolor = PAGE_BG)

ax = Axis(
    fig[1, 1];
    title = title_str,
    titlesize = 27,
    titlecolor = INK,
    titlegap = 22,
    backgroundcolor = PAGE_BG,
    aspect = DataAspect(),
)
hidedecorations!(ax)
hidespines!(ax)

r_max_data = maximum(sum(freq, dims = 2))
ring_step = 5.0
n_rings = ceil(Int, r_max_data / ring_step)
r_axis_max = n_rings * ring_step

# Radial grid rings (drawn first, beneath the data)
for k in 1:n_rings
    r = k * ring_step
    ring = [Point2f(r * cos(a), r * sin(a)) for a in range(0, 2pi, length = 200)]
    lines!(ax, ring, color = GRID, linewidth = 1.2)
end

# Direction spokes
for d in 0:(n_dirs - 1)
    a = compass_to_screen(d * sector_width)
    lines!(
        ax,
        [Point2f(0, 0), Point2f(r_axis_max * cos(a), r_axis_max * sin(a))],
        color = GRID, linewidth = 1.2,
    )
end

# Stacked wedges — one per direction sector, speed bins stacked outward
gap_deg = 4.0
half_width = sector_width / 2 - gap_deg / 2

for d in 1:n_dirs
    center = (d - 1) * sector_width
    r_cum = 0.0
    for s in 1:n_speed
        r0 = r_cum
        r1 = r_cum + freq[d, s]
        if freq[d, s] > 0
            poly!(
                ax, wedge_points(center, half_width, r0, r1),
                color = IMPRINT_PALETTE[s],
                strokecolor = PAGE_BG, strokewidth = 1.5,
            )
        end
        r_cum = r1
    end
end

# Radial (frequency) tick labels along the shared boundary of whichever two
# adjacent sectors carry the least combined data, centered exactly on that
# boundary line so the text never drifts sideways into a wedge's fill.
sector_totals = vec(sum(freq, dims = 2))
gap_idx = argmin([sector_totals[d] + sector_totals[mod1(d + 1, n_dirs)] for d in 1:n_dirs])
gap_angle = compass_to_screen((gap_idx - 0.5) * sector_width)
for k in 1:n_rings
    r = k * ring_step
    text!(
        ax, r * cos(gap_angle), r * sin(gap_angle);
        text = "$(round(Int, r))%",
        fontsize = 12, color = INK_SOFT, align = (:center, :center),
    )
end

# Compass direction labels around the outer ring
for d in 0:(n_dirs - 1)
    a = compass_to_screen(d * sector_width)
    label_r = r_axis_max * 1.12
    text!(
        ax, label_r * cos(a), label_r * sin(a);
        text = dir_labels[d + 1], fontsize = 16, color = INK, align = (:center, :center),
    )
end

limits!(ax, -r_axis_max * 1.28, r_axis_max * 1.28, -r_axis_max * 1.28, r_axis_max * 1.28)

# Legend floats inside the axis itself (not a separate grid column) so the
# polar chart is centered on the full square canvas; it lands in the corner
# with the least wedge data, putting otherwise-empty space to use.
Legend(
    fig[1, 1],
    [PolyElement(color = IMPRINT_PALETTE[s]) for s in 1:n_speed],
    speed_labels,
    "Wind Speed";
    tellwidth = false, tellheight = false, halign = :right, valign = :top,
    margin = (0, 24, 0, 24),
    titlecolor = INK, labelcolor = INK_SOFT,
    titlesize = 15, labelsize = 13,
    backgroundcolor = ELEVATED_BG, framevisible = false,
    patchsize = (16, 16), rowgap = 6,
)

# --- Save -------------------------------------------------------------------
save("plot-$(THEME).png", fig; px_per_unit = 2)
Runnable source as JSON, for any HTTP client: https://api.anyplot.ai/specs/windrose-basic/makie/code. Any spec id and library id listed in llms-full.txt fit the same URL shape; every URL below is complete and callable.
{
  "spec_id": "windrose-basic",
  "language": "julia",
  "library": "makie",
  "page": "https://anyplot.ai/windrose-basic/julia/makie",
  "hub": "https://anyplot.ai/windrose-basic",
  "code_json": "https://api.anyplot.ai/specs/windrose-basic/makie/code",
  "spec_json": "https://api.anyplot.ai/specs/windrose-basic",
  "render_light_png": "https://storage.googleapis.com/anyplot-images/plots/windrose-basic/julia/makie/plot-light.png",
  "render_dark_png": "https://storage.googleapis.com/anyplot-images/plots/windrose-basic/julia/makie/plot-dark.png",
  "quality_score": 90.0,
  "license": "MIT",
  "guide": "https://anyplot.ai/llms.txt"
}
Part of Wind Rose Chart on anyplot.ai.