The same plot in 14 other libraries — JavaScript: Chart.js, D3.js, Apache ECharts, Highcharts; Python: Altair, Bokeh, lets-plot, Matplotlib, Plotly, plotnine, Pygal, Seaborn; R: ggplot2; Julia: Makie.jl. Compare all 15 side by side: Wind Rose Chart in Python, R, Julia and JavaScript.
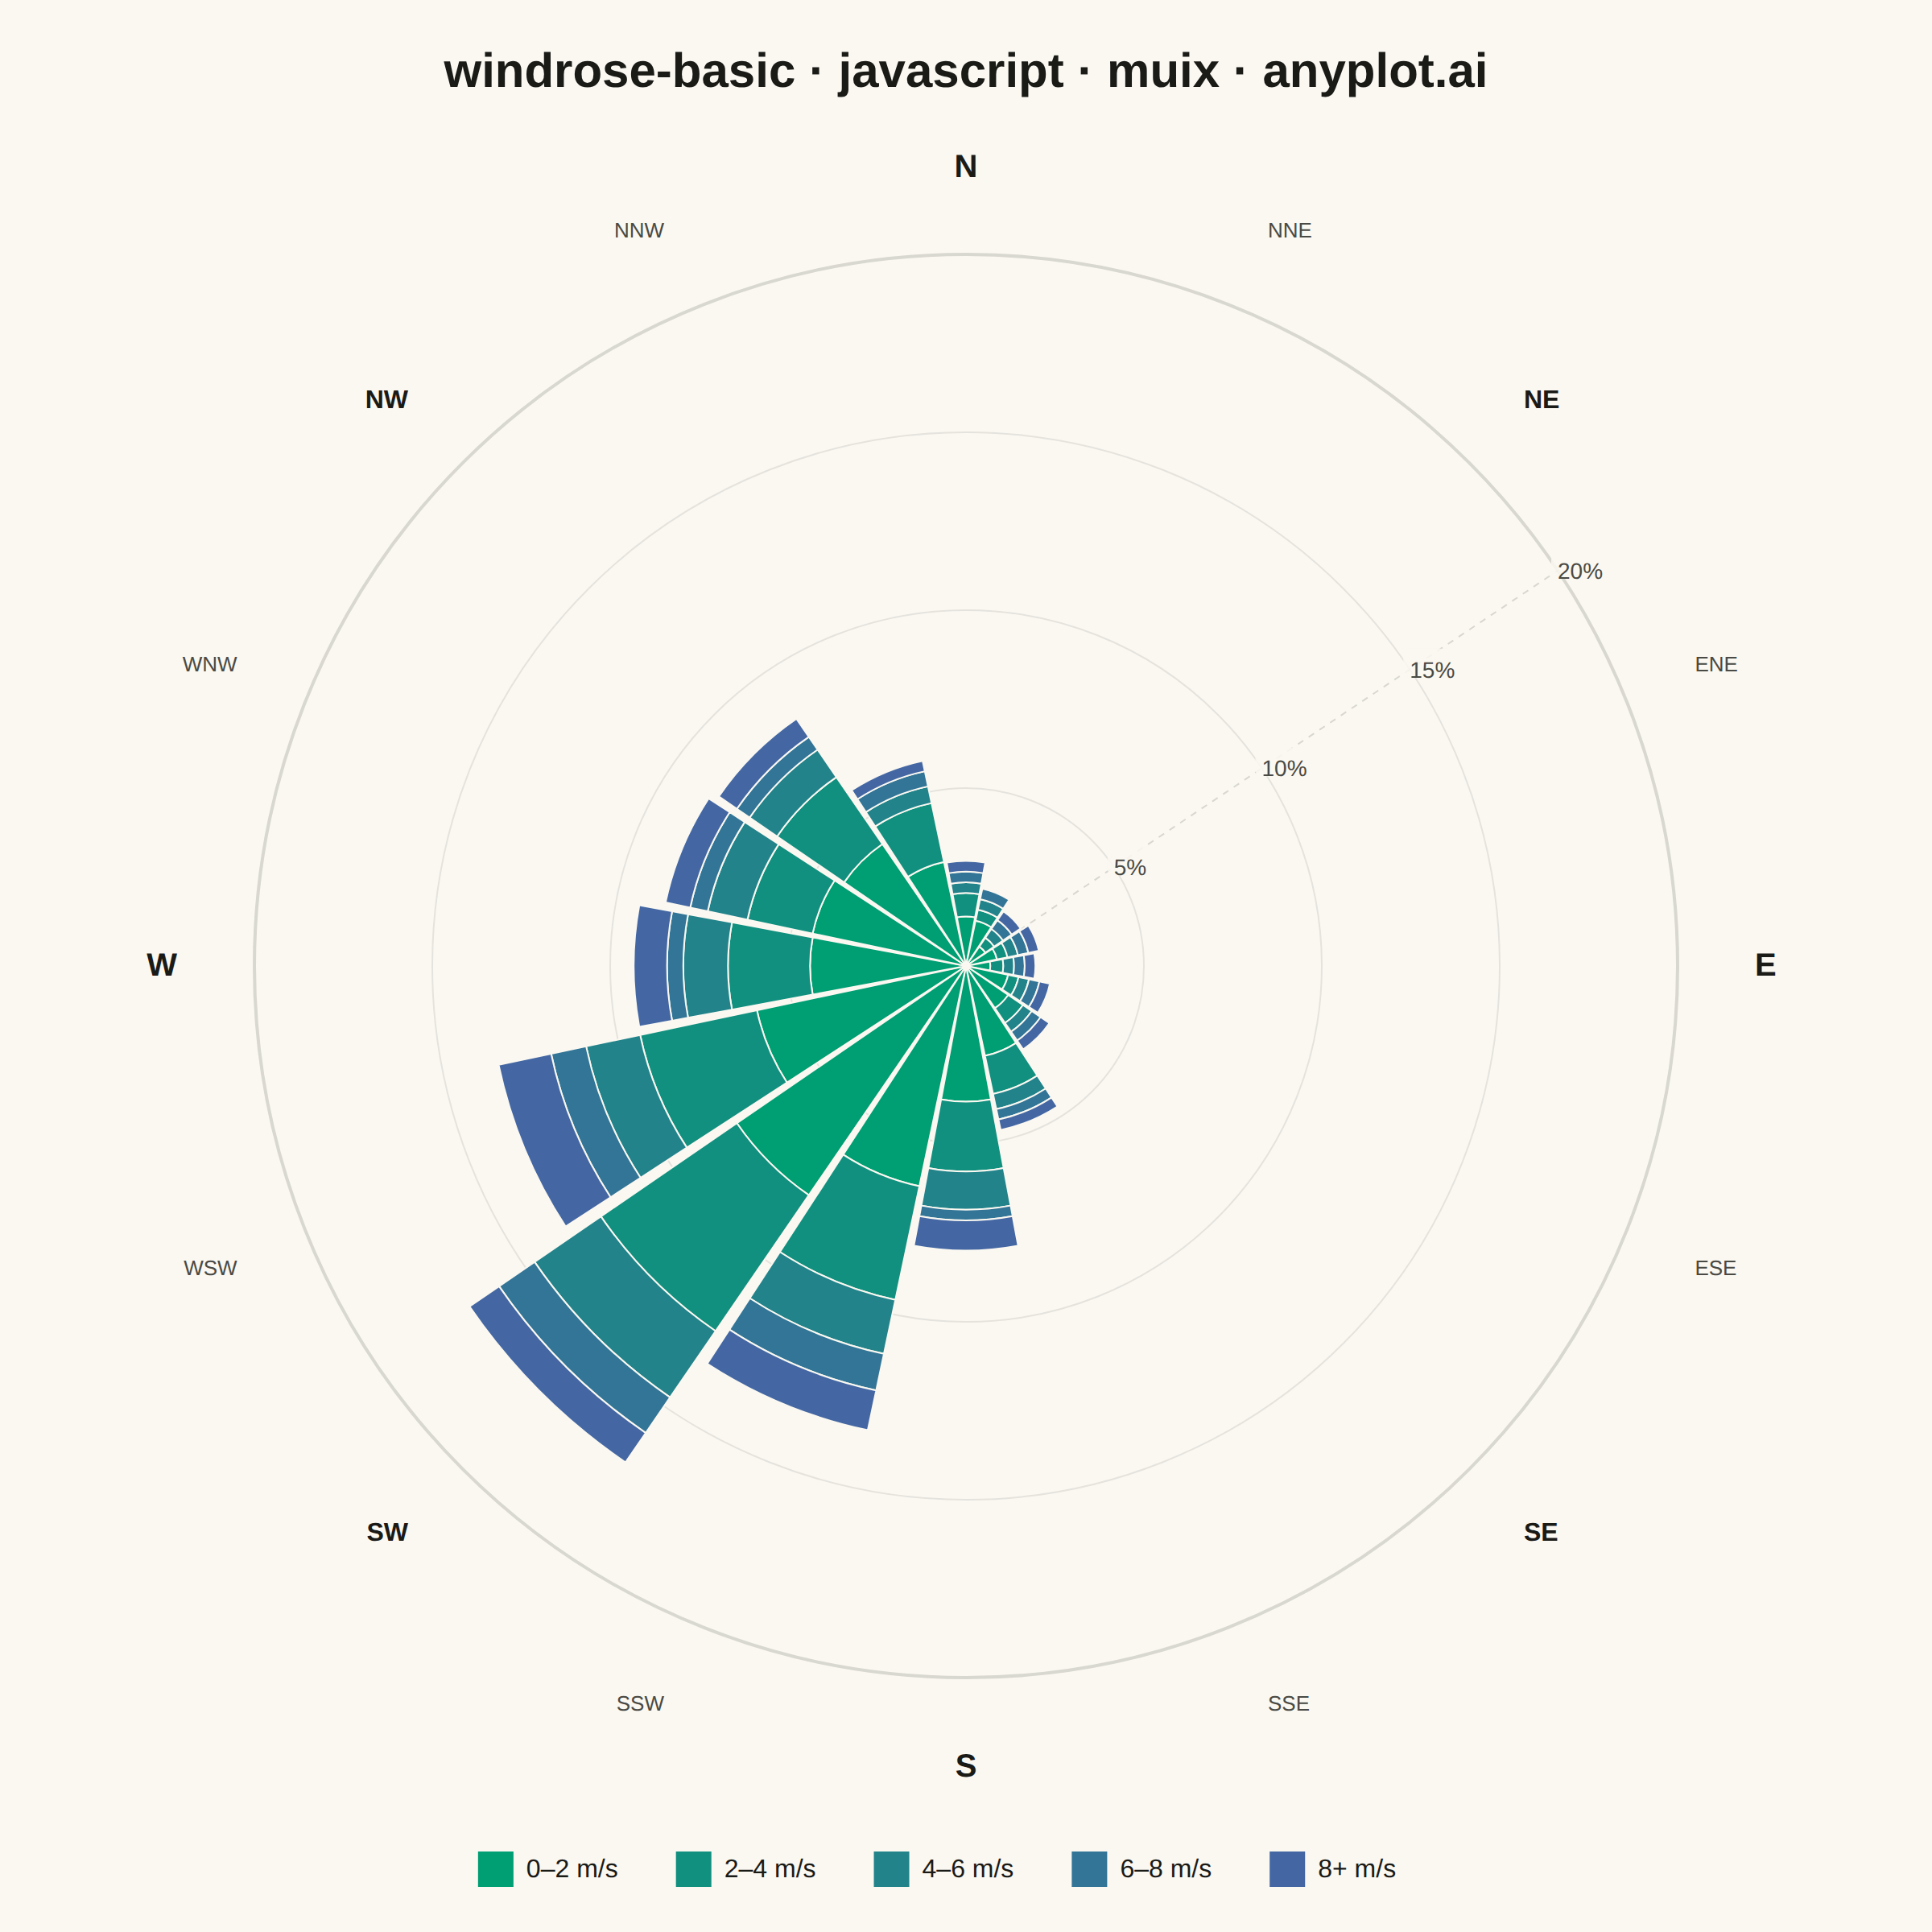
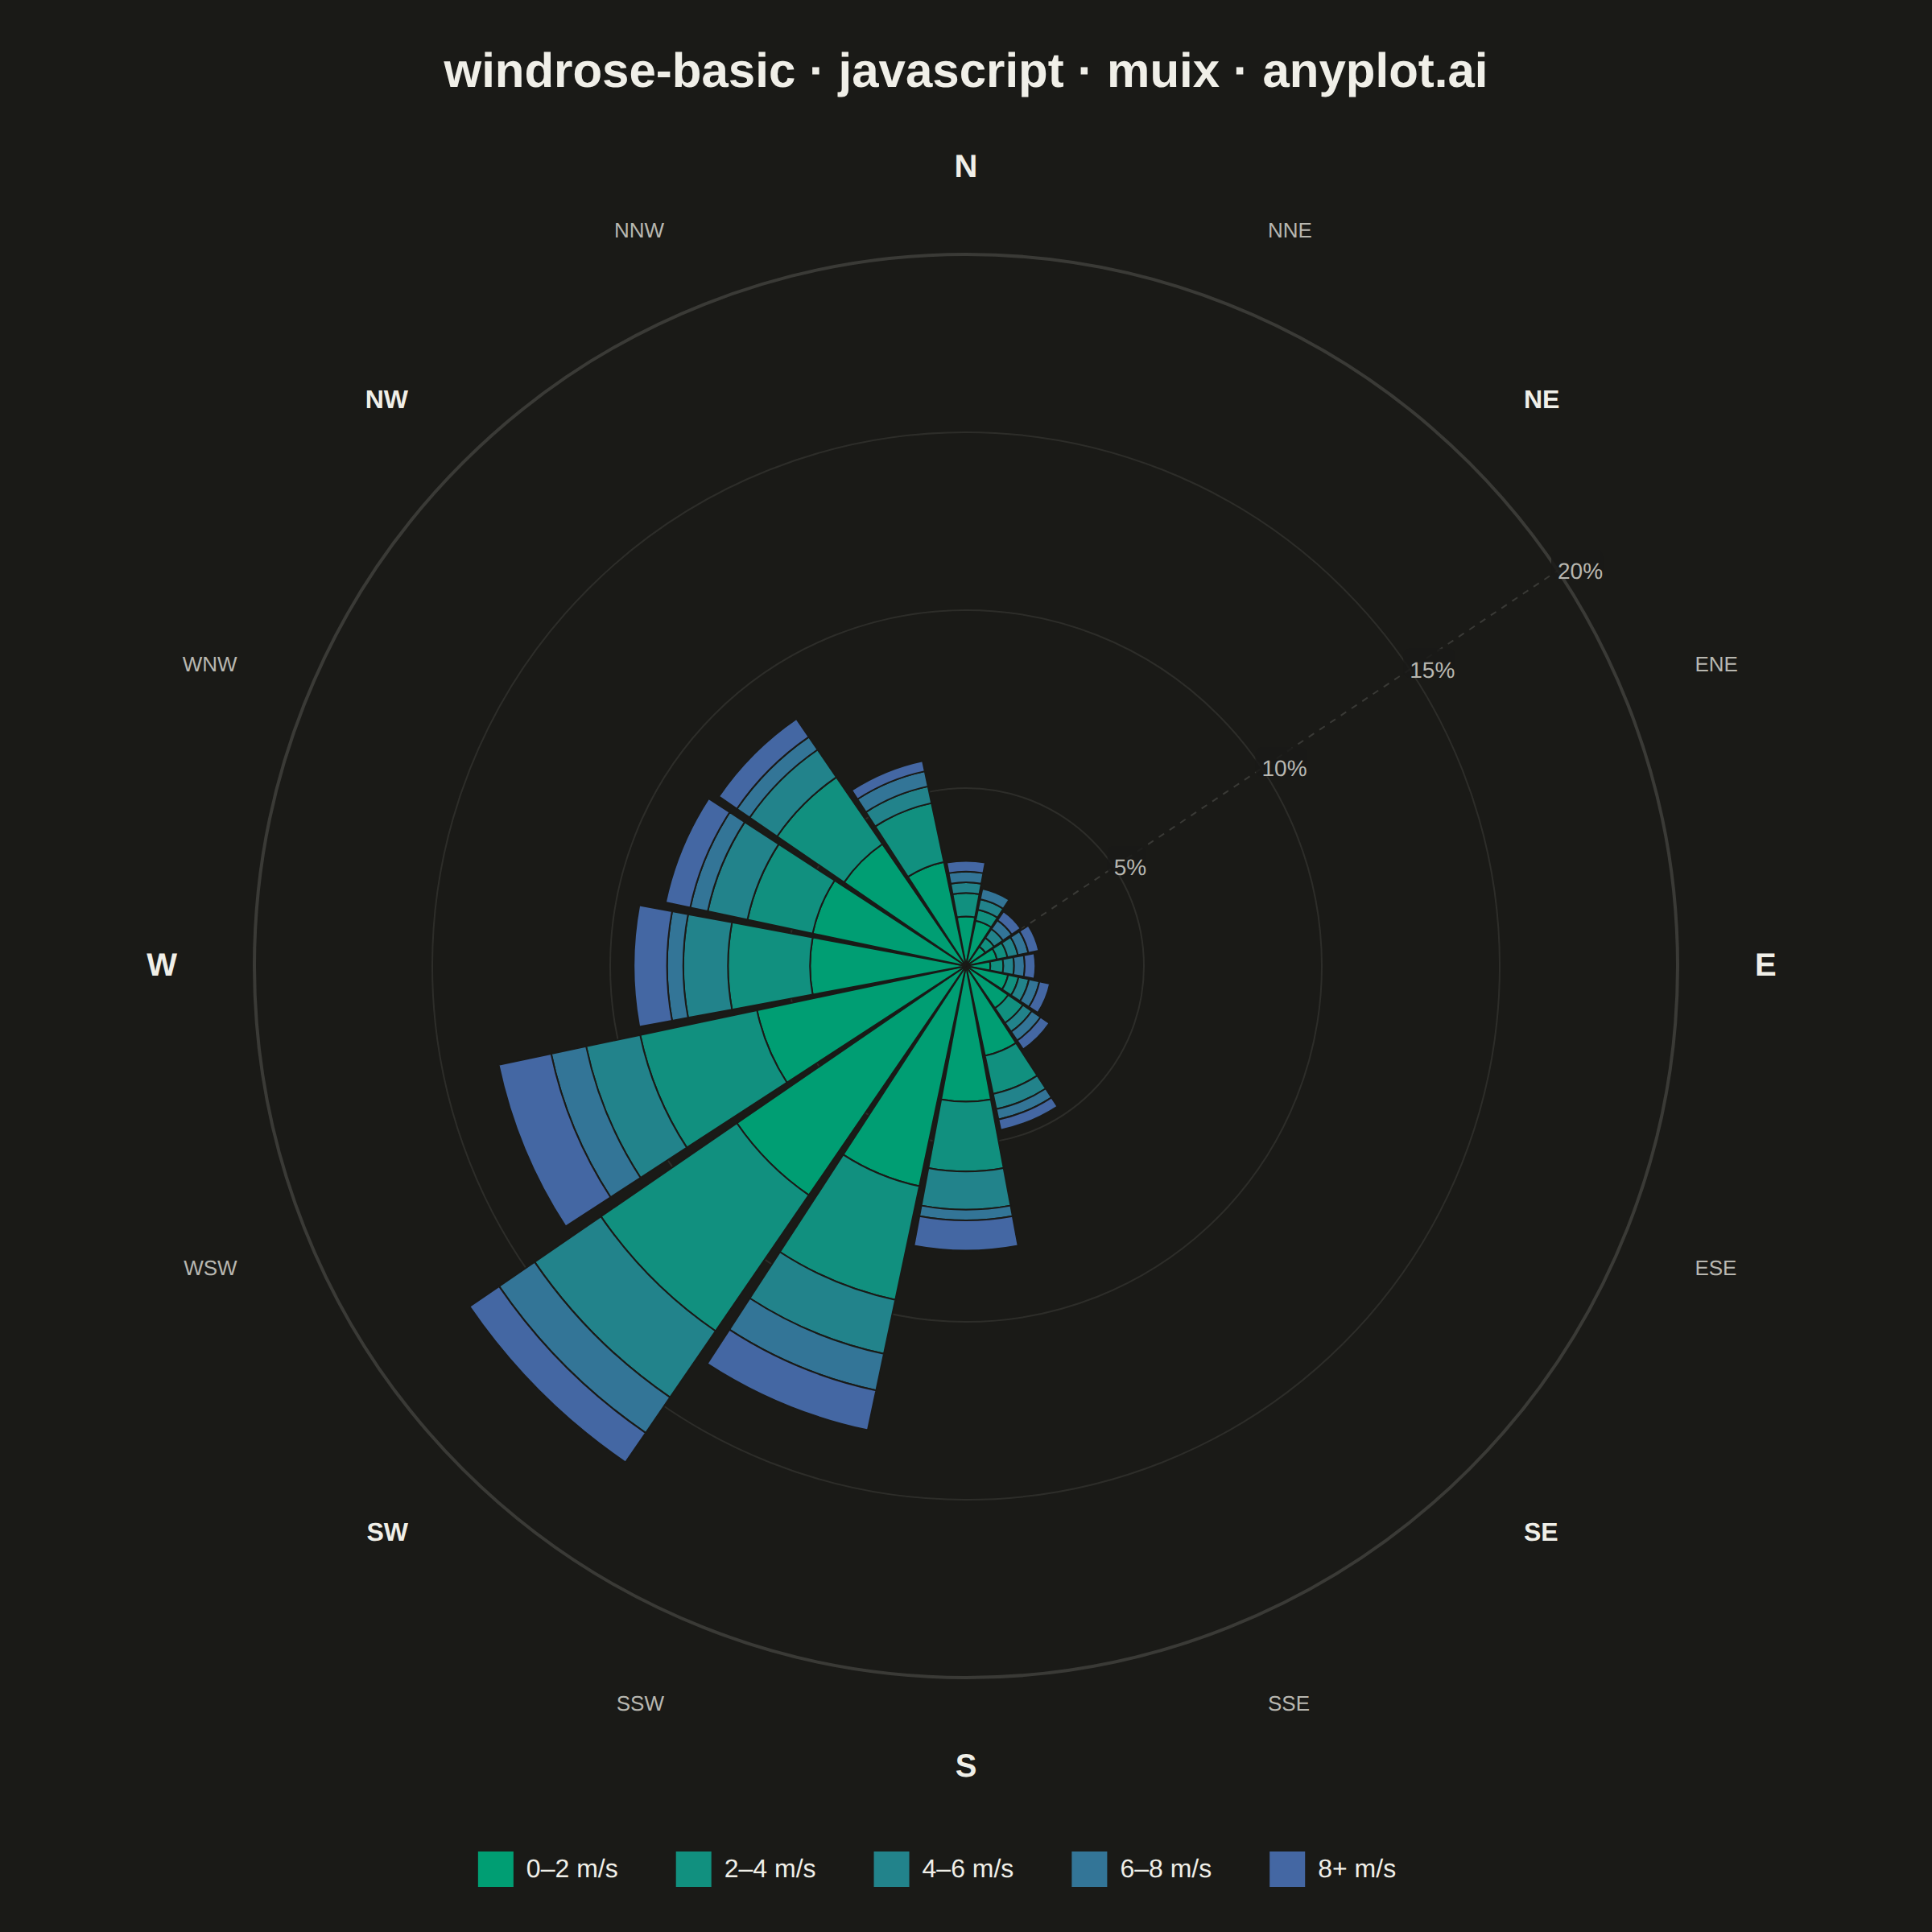
A wind rose displays wind speed and direction data as a polar stacked histogram showing the frequency distribution of wind across compass directions. Each spoke represents a direction sector (typically 8-16 bins), with stacked colored segments indicating different wind speed ranges. This specialized meteorological visualization reveals dominant wind patterns, prevailing directions, and speed distributions simultaneously, making it essential for site assessment and environmental analysis.
// anyplot.ai
// windrose-basic: Wind Rose Chart
// Library: muix 7.29.1 | JavaScript 22.23.1
// Quality: 92/100 | Created: 2026-08-05
//# anyplot-orientation: square
// anyplot.ai
// windrose-basic: Wind Rose Chart
// Library: MUI X Charts | React | Node 22
// License: @mui/x-charts — MIT (community). Pro/Premium are out of scope.
// Quality: pending | Created: 2026-08-05
import { ChartContainer } from "@mui/x-charts/ChartContainer";
import { useDrawingArea } from "@mui/x-charts/hooks";
import { ChartsLegend } from "@mui/x-charts/ChartsLegend";
import { ChartsTooltip } from "@mui/x-charts/ChartsTooltip";
import { useInteractionItemProps } from "@mui/x-charts/internals";

// @mui/x-charts 7.x community has no polar / radial-bar chart component, so the
// wind rose is composed on MUI X's own charting surface: ChartContainer supplies
// the sized <svg> + drawing area, and useDrawingArea() gives the plot rect the
// polar geometry is mapped onto — real stacked-sector geometry, not faked chrome.
// The 5 speed bins are still registered as genuine (unrendered) MUI X `bar`
// series so the native <ChartsLegend> and <ChartsTooltip> read real series data;
// useInteractionItemProps wires our hand-drawn wedges into MUI X's own
// interaction/highlight system instead of faking a legend or tooltip.

const t = window.ANYPLOT_TOKENS;
const size = window.ANYPLOT_SIZE;

// Theme-adaptive chrome (ThemeProvider handles MUI text; these are for our SVG).
const INK = t.ink;
const INK_SOFT = t.inkSoft;
const GRID = t.grid;
const PAGE_BG = t.pageBg;

// --- Fixed-seed PRNG (mulberry32) — Math.random() is not reproducible --------
function mulberry32(a) {
  return function () {
    a |= 0;
    a = (a + 0x6d2b79f5) | 0;
    let x = Math.imul(a ^ (a >>> 15), 1 | a);
    x = (x + Math.imul(x ^ (x >>> 7), 61 | x)) ^ x;
    return ((x ^ (x >>> 14)) >>> 0) / 4294967296;
  };
}
const rand = mulberry32(42);
const randNormal = () => {
  const u1 = Math.max(rand(), 1e-6); // guard log(0); mulberry32 can return exactly 0
  const u2 = rand();
  return Math.sqrt(-2 * Math.log(u1)) * Math.cos(2 * Math.PI * u2);
};

// --- Data: one year (hourly) of wind observations at a coastal weather station,
// binned into 16 compass sectors × 5 speed classes ---------------------------
const DIRECTIONS = [
  "N",
  "NNE",
  "NE",
  "ENE",
  "E",
  "ESE",
  "SE",
  "SSE",
  "S",
  "SSW",
  "SW",
  "WSW",
  "W",
  "WNW",
  "NW",
  "NNW",
];
const SPEED_BINS = [
  [0, 2],
  [2, 4],
  [4, 6],
  [6, 8],
  [8, Infinity],
];
const SPEED_LABELS = ["0–2 m/s", "2–4 m/s", "4–6 m/s", "6–8 m/s", "8+ m/s"];
const PREVAILING_DEG = 225; // prevailing wind from the southwest
const SECONDARY_DEG = 315; // secondary regime: brisk northwesterly gusts
const N_SAMPLES = 4380; // hourly readings across half a year

const counts = DIRECTIONS.map(() => SPEED_BINS.map(() => 0));
for (let i = 0; i < N_SAMPLES; i += 1) {
  const regime = rand();
  let direction;
  let speedScale;
  if (regime < 0.6) {
    direction = PREVAILING_DEG + randNormal() * 36;
    speedScale = 3.4;
  } else if (regime < 0.78) {
    direction = SECONDARY_DEG + randNormal() * 24;
    speedScale = 3.0;
  } else {
    direction = rand() * 360;
    speedScale = 1.7;
  }
  direction = ((direction % 360) + 360) % 360;
  const speed = -Math.log(1 - rand()) * speedScale;
  const dirIdx = Math.round(direction / 22.5) % DIRECTIONS.length;
  const speedIdx = SPEED_BINS.findIndex(
    ([lo, hi]) => speed >= lo && speed < hi,
  );
  counts[dirIdx][speedIdx] += 1;
}
const freqPct = counts.map((row) => row.map((c) => (c / N_SAMPLES) * 100));
const cumPct = freqPct.map((row) => {
  const out = [];
  row.reduce((sum, v, i) => (out[i] = sum + v), 0);
  return out;
});
const maxTotal = Math.max(...cumPct.map((row) => row[row.length - 1]));
const RING_MAX = Math.ceil(maxTotal / 5) * 5;
const RINGS = [RING_MAX * 0.25, RING_MAX * 0.5, RING_MAX * 0.75, RING_MAX];

// Minimum-radius floor: near-zero direction sectors (E/ENE/NE/ESE/SE) still get
// a legible sliver per present speed bin, so calm directions don't collapse into
// indistinguishable slivers. Only used for wedge geometry — the real freqPct
// values (below) still drive the legend/tooltip, so displayed numbers stay honest.
const MIN_SLICE_PCT = RING_MAX * 0.015;
const renderPct = freqPct.map((row) =>
  row.map((v) => (v > 0 ? Math.max(v, MIN_SLICE_PCT) : 0)),
);
const renderCumPct = renderPct.map((row) => {
  const out = [];
  row.reduce((sum, v, i) => (out[i] = sum + v), 0);
  return out;
});

// --- Sequential Imprint colours (calm → strong) — never a library gradient ---
const hexToRgb = (hex) => {
  const v = parseInt(hex.slice(1), 16);
  return [(v >> 16) & 255, (v >> 8) & 255, v & 255];
};
const lerpHex = (from, to, f) => {
  const [r1, g1, b1] = hexToRgb(from);
  const [r2, g2, b2] = hexToRgb(to);
  const mix = (a, b) => Math.round(a + (b - a) * f);
  return `rgb(${mix(r1, r2)}, ${mix(g1, g2)}, ${mix(b1, b2)})`;
};
const SPEED_COLORS = SPEED_BINS.map((_, i) =>
  lerpHex(t.seq[0], t.seq[1], i / (SPEED_BINS.length - 1)),
);

// Real MUI X `bar` series (one per speed bin, values = true freqPct per
// direction) — never rendered by a <BarPlot>, but registered on ChartContainer
// so <ChartsLegend> and <ChartsTooltip> below are driven by genuine series
// data/colors rather than hand-drawn chrome.
const BAR_SERIES = SPEED_BINS.map((_, speedIdx) => ({
  id: `speed-${speedIdx}`,
  type: "bar",
  label: SPEED_LABELS[speedIdx],
  color: SPEED_COLORS[speedIdx],
  data: freqPct.map((row) => row[speedIdx]),
  valueFormatter: (v) => (v == null ? "" : `${v.toFixed(1)}%`),
}));

// Direction i's centre angle is i·22.5° clockwise from north; SVG's 0° points
// at 3 o'clock, so shift by -90° before converting to radians.
const toRad = (deg) => ((deg - 90) * Math.PI) / 180;

const annularSectorPath = (cx, cy, rInner, rOuter, startDeg, endDeg) => {
  const a0 = toRad(startDeg);
  const a1 = toRad(endDeg);
  const pt = (r, a) => [cx + r * Math.cos(a), cy + r * Math.sin(a)];
  const [x1, y1] = pt(rOuter, a0);
  const [x2, y2] = pt(rOuter, a1);
  if (rInner <= 0.01) {
    return `M ${cx} ${cy} L ${x1} ${y1} A ${rOuter} ${rOuter} 0 0 1 ${x2} ${y2} Z`;
  }
  const [x3, y3] = pt(rInner, a1);
  const [x4, y4] = pt(rInner, a0);
  return `M ${x1} ${y1} A ${rOuter} ${rOuter} 0 0 1 ${x2} ${y2} L ${x3} ${y3} A ${rInner} ${rInner} 0 0 0 ${x4} ${y4} Z`;
};

const SECTOR_SPAN = 360 / DIRECTIONS.length;
const SECTOR_GAP = 1.4; // degrees of padding between adjacent wedges
const TICK_ANGLE = SECTOR_SPAN * 2.5; // reference axis sits in the NE/ENE gap

// --- Wind rose layer: rendered as children inside MUI X's ChartsSurface -------
function WindRoseLayer() {
  const area = useDrawingArea();
  const getInteractionProps = useInteractionItemProps();
  const cx = area.left + area.width / 2;
  const cy = area.top + area.height / 2;
  const half = Math.min(area.width, area.height) / 2;
  const R = half - 62; // data radius; the margin to `half` holds compass labels
  const labelR = half - 14;
  const scaleR = (value) => (value / RING_MAX) * R;

  return (
    <g>
      {/* Frequency rings — outer solid, inner lighter so the grid stays subtle */}
      {RINGS.map((level) => (
        <circle
          key={`ring-${level}`}
          cx={cx}
          cy={cy}
          r={scaleR(level)}
          fill="none"
          stroke={GRID}
          strokeWidth={level === RING_MAX ? 2 : 1}
          strokeOpacity={level === RING_MAX ? 1 : 0.6}
        />
      ))}

      {/* Reference axis for the frequency-percent ticks, clear of any wedge */}
      <line
        x1={cx}
        y1={cy}
        x2={cx + R * Math.cos(toRad(TICK_ANGLE))}
        y2={cy + R * Math.sin(toRad(TICK_ANGLE))}
        stroke={GRID}
        strokeWidth={1}
        strokeDasharray="4 4"
      />
      {RINGS.map((level) => {
        const r = scaleR(level);
        const x = cx + r * Math.cos(toRad(TICK_ANGLE));
        const y = cy + r * Math.sin(toRad(TICK_ANGLE));
        const label = `${Math.round(level)}%`;
        return (
          <g key={`tick-${level}`}>
            <rect
              x={x - 4}
              y={y - 13}
              width={label.length * 8 + 8}
              height={18}
              rx={4}
              fill={PAGE_BG}
              opacity={0.85}
            />
            <text
              x={x}
              y={y}
              fill={INK_SOFT}
              fontSize={14}
              textAnchor="start"
              dominantBaseline="central"
            >
              {label}
            </text>
          </g>
        );
      })}

      {/* Stacked speed-bin wedges — one annular sector per direction/speed pair */}
      {DIRECTIONS.map((_, dirIdx) => {
        const centerDeg = dirIdx * SECTOR_SPAN;
        const startDeg = centerDeg - SECTOR_SPAN / 2 + SECTOR_GAP / 2;
        const endDeg = centerDeg + SECTOR_SPAN / 2 - SECTOR_GAP / 2;
        let inner = 0;
        return SPEED_BINS.map((_, speedIdx) => {
          const outer = renderCumPct[dirIdx][speedIdx];
          const isZero = outer <= inner;
          const path = isZero
            ? null
            : annularSectorPath(
                cx,
                cy,
                scaleR(inner),
                scaleR(outer),
                startDeg,
                endDeg,
              );
          inner = outer;
          if (isZero) return null;
          return (
            <path
              key={`wedge-${dirIdx}-${speedIdx}`}
              d={path}
              fill={SPEED_COLORS[speedIdx]}
              stroke={PAGE_BG}
              strokeWidth={1}
              {...getInteractionProps({
                type: "bar",
                seriesId: `speed-${speedIdx}`,
                dataIndex: dirIdx,
              })}
            />
          );
        });
      })}

      {/* Compass labels — cardinal / intercardinal / secondary type hierarchy */}
      {DIRECTIONS.map((label, i) => {
        const a = toRad(i * SECTOR_SPAN);
        const cos = Math.cos(a);
        const sin = Math.sin(a);
        const anchor = cos > 0.15 ? "start" : cos < -0.15 ? "end" : "middle";
        const baseline =
          sin > 0.5 ? "hanging" : sin < -0.5 ? "auto" : "central";
        const isCardinal = i % 4 === 0;
        const isIntercardinal = i % 4 === 2;
        const fontSize = isCardinal ? 20 : isIntercardinal ? 16 : 13;
        return (
          <text
            key={`label-${label}`}
            x={cx + labelR * cos}
            y={cy + labelR * sin}
            fill={isCardinal || isIntercardinal ? INK : INK_SOFT}
            fontSize={fontSize}
            fontWeight={isCardinal ? 700 : isIntercardinal ? 600 : 400}
            textAnchor={anchor}
            dominantBaseline={baseline}
          >
            {label}
          </text>
        );
      })}
    </g>
  );
}

// --- Title drawn on the surface (legend is the native <ChartsLegend> below) --
function Title() {
  return (
    <text
      x={size.width / 2}
      y={54}
      fill={INK}
      fontSize={30}
      fontWeight={700}
      textAnchor="middle"
    >
      windrose-basic · javascript · muix · anyplot.ai
    </text>
  );
}

// --- Chart (default-exported component — the harness mounts it) --------------
export default function Chart() {
  return (
    <ChartContainer
      width={size.width}
      height={size.height}
      series={BAR_SERIES}
      xAxis={[{ id: "direction", scaleType: "band", data: DIRECTIONS }]}
      margin={{ top: 96, bottom: 96, left: 70, right: 70 }}
      skipAnimation
    >
      <Title />
      <WindRoseLayer />
      <ChartsLegend
        position={{ vertical: "bottom", horizontal: "middle" }}
        labelStyle={{ fontSize: 16 }}
        itemMarkWidth={22}
        itemMarkHeight={22}
        markGap={8}
        itemGap={36}
      />
      <ChartsTooltip trigger="item" />
    </ChartContainer>
  );
}
Runnable source as JSON, for any HTTP client: https://api.anyplot.ai/specs/windrose-basic/muix/code. Any spec id and library id listed in llms-full.txt fit the same URL shape; every URL below is complete and callable.
{
  "spec_id": "windrose-basic",
  "language": "javascript",
  "library": "muix",
  "page": "https://anyplot.ai/windrose-basic/javascript/muix",
  "hub": "https://anyplot.ai/windrose-basic",
  "code_json": "https://api.anyplot.ai/specs/windrose-basic/muix/code",
  "spec_json": "https://api.anyplot.ai/specs/windrose-basic",
  "render_light_png": "https://storage.googleapis.com/anyplot-images/plots/windrose-basic/javascript/muix/plot-light.png",
  "render_dark_png": "https://storage.googleapis.com/anyplot-images/plots/windrose-basic/javascript/muix/plot-dark.png",
  "interactive_light_html": "https://storage.googleapis.com/anyplot-images/plots/windrose-basic/javascript/muix/plot-light.html",
  "interactive_dark_html": "https://storage.googleapis.com/anyplot-images/plots/windrose-basic/javascript/muix/plot-dark.html",
  "quality_score": 92.0,
  "license": "MIT",
  "guide": "https://anyplot.ai/llms.txt"
}
Part of Wind Rose Chart on anyplot.ai.