The same plot in 14 other libraries — JavaScript: Chart.js, D3.js, Highcharts, MUI X Charts; Python: Altair, Bokeh, lets-plot, Matplotlib, Plotly, plotnine, Pygal, Seaborn; R: ggplot2; Julia: Makie.jl. Compare all 15 side by side: Wind Rose Chart in Python, R, Julia and JavaScript.
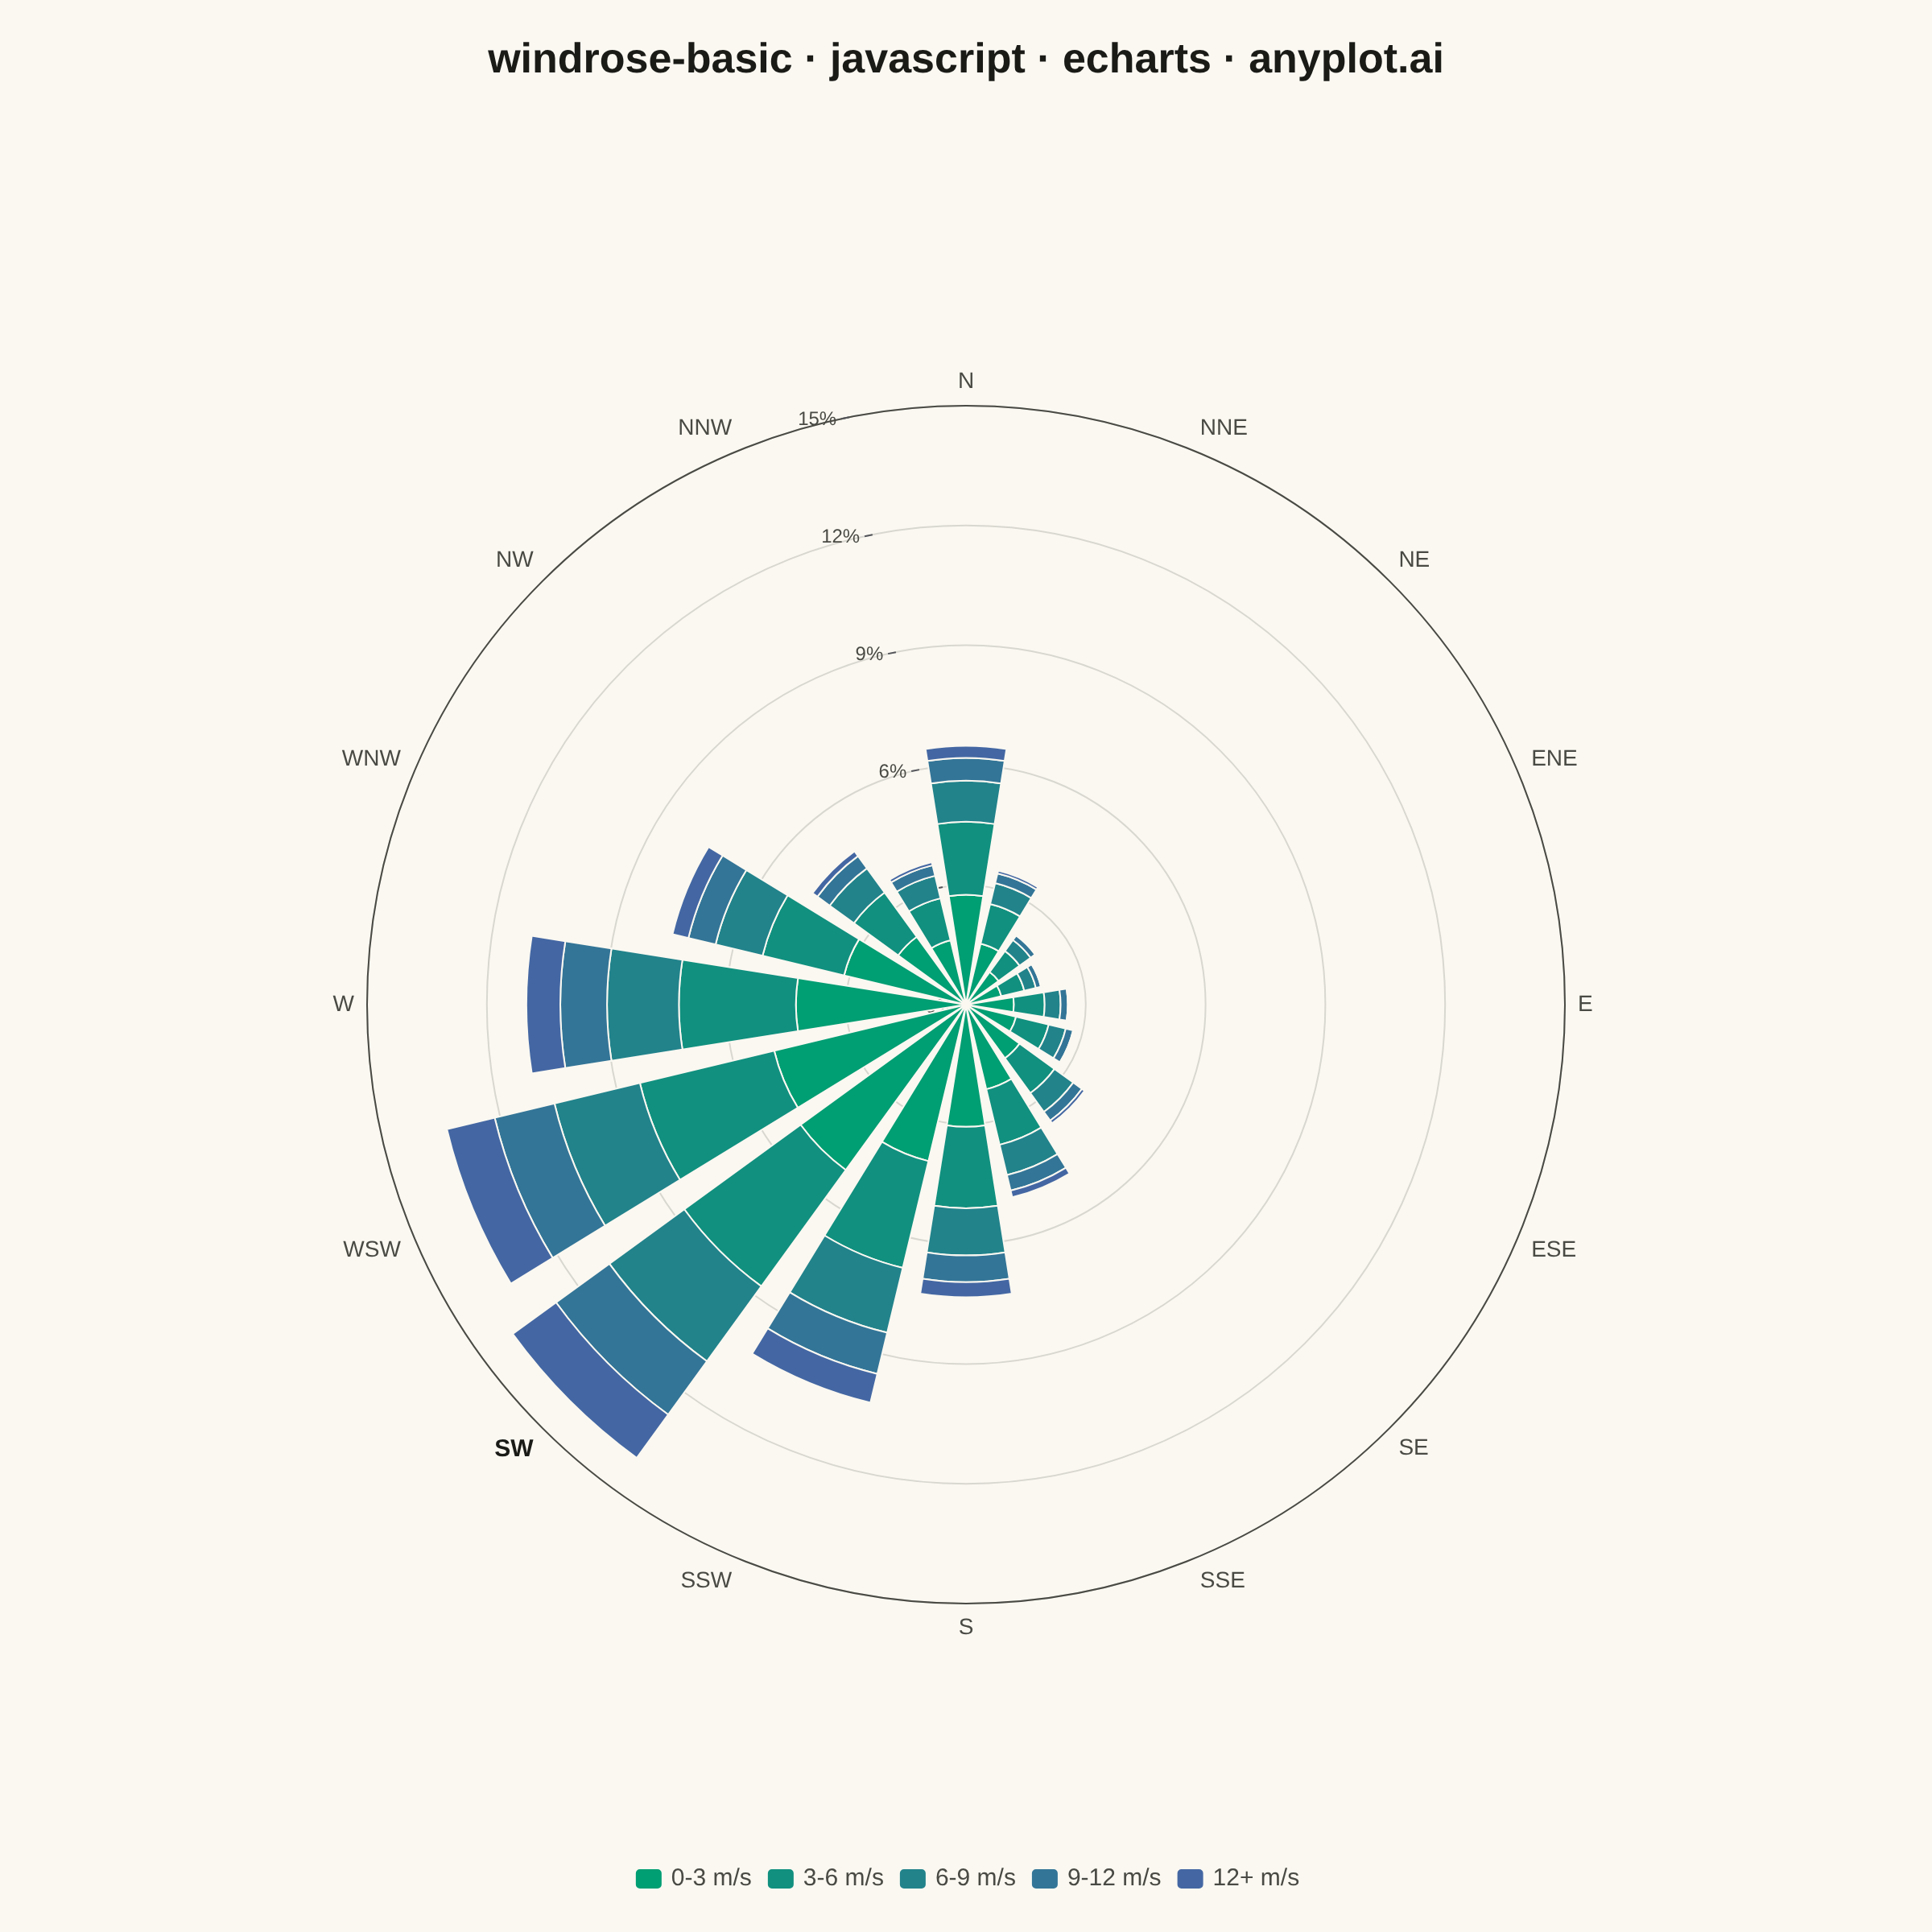
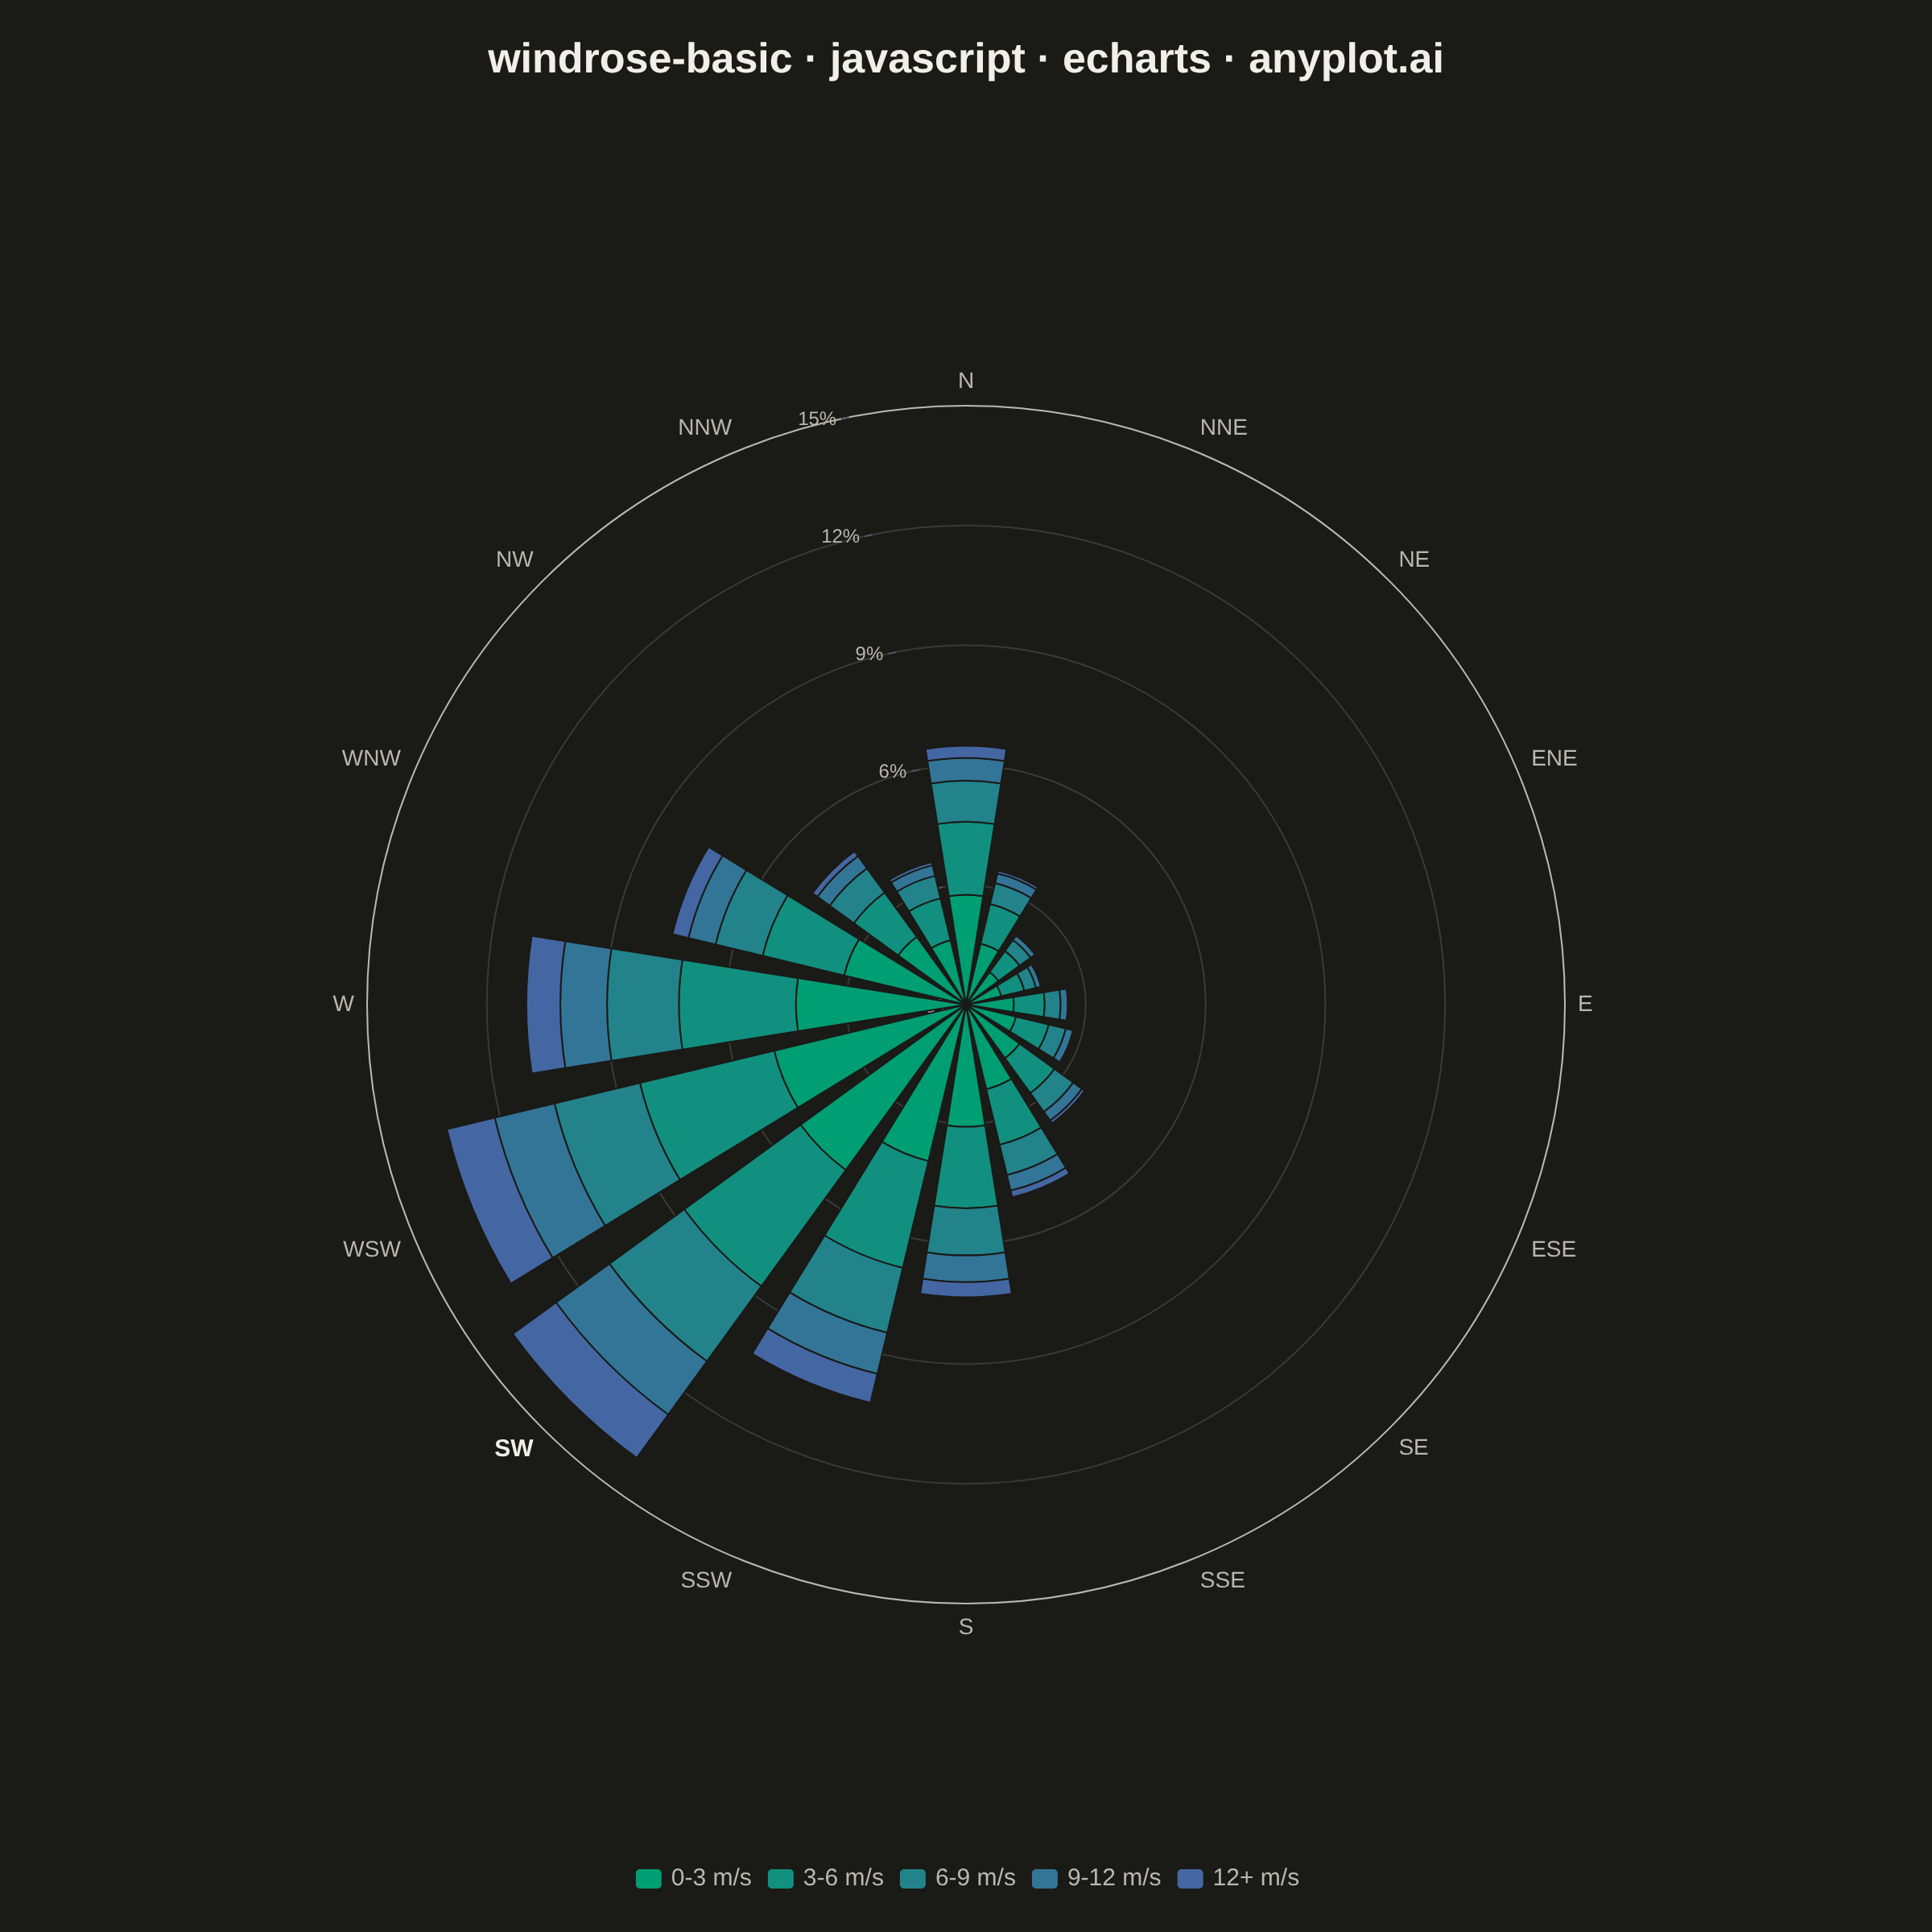
A wind rose displays wind speed and direction data as a polar stacked histogram showing the frequency distribution of wind across compass directions. Each spoke represents a direction sector (typically 8-16 bins), with stacked colored segments indicating different wind speed ranges. This specialized meteorological visualization reveals dominant wind patterns, prevailing directions, and speed distributions simultaneously, making it essential for site assessment and environmental analysis.
// anyplot.ai
// windrose-basic: Wind Rose Chart
// Library: echarts 6.1.0 | JavaScript 22.23.1
// Quality: 94/100 | Created: 2026-08-05

//# anyplot-orientation: square
const t = window.ANYPLOT_TOKENS;

// --- Data (in-memory, deterministic) ----------------------------------------
// One year of hourly wind observations from a coastal weather station,
// binned into 16 compass sectors and 5 speed classes (m/s).
const directions = [
  "N", "NNE", "NE", "ENE", "E", "ESE", "SE", "SSE",
  "S", "SSW", "SW", "WSW", "W", "WNW", "NW", "NNW",
];
const speedBins = ["0-3", "3-6", "6-9", "9-12", "12+"];

// Relative direction frequency - prevailing wind out of the SW quadrant,
// with a calmer secondary lobe out of the N.
const directionWeight = [
  6.0, 3.2, 2.0, 1.8, 2.4, 2.6, 3.4, 4.6,
  6.8, 9.5, 13.0, 12.4, 10.2, 7.0, 4.4, 3.4,
];
const totalWeight = directionWeight.reduce((a, b) => a + b, 0);
const directionPct = directionWeight.map((w) => (w / totalWeight) * 100);

// Speed-bin shape shifts toward the higher bins as prevailing strength
// grows - calmer secondary directions stay skewed toward the lowest bin.
const maxWeight = Math.max(...directionWeight);
const dominantDirection = directions[directionWeight.indexOf(maxWeight)];
const table = directionPct.map((pct, i) => {
  const strength = directionWeight[i] / maxWeight;
  const raw = [0.42, 0.28, 0.16, 0.09, 0.05].map(
    (base, k) => base + (strength - 0.5) * k * 0.03
  );
  const sum = raw.reduce((a, b) => a + b, 0);
  return raw.map((v) => (pct * v) / sum);
});

// --- Colors: sample the Imprint sequential ramp across the speed bins ------
const [seqLo, seqHi] = [t.seq[0], t.seq[1]].map((hex) =>
  [1, 3, 5].map((i) => parseInt(hex.slice(i, i + 2), 16))
);
const speedColors = speedBins.map((_, i) => {
  const f = i / (speedBins.length - 1);
  const rgb = seqLo.map((v, k) => Math.round(v + (seqHi[k] - v) * f));
  return "#" + rgb.map((v) => v.toString(16).padStart(2, "0")).join("");
});

// --- Init ---------------------------------------------------------------
const chart = echarts.init(document.getElementById("container"));

// --- Option ---------------------------------------------------------------
chart.setOption({
  animation: false,
  backgroundColor: "transparent",
  title: {
    text: "windrose-basic · javascript · echarts · anyplot.ai",
    left: "center",
    top: 20,
    textStyle: { color: t.ink, fontSize: 26, fontWeight: "bold" },
  },
  legend: {
    bottom: 20,
    left: "center",
    data: speedBins.map((label) => `${label} m/s`),
    textStyle: { color: t.inkSoft, fontSize: 15 },
    itemWidth: 18,
    itemHeight: 14,
  },
  polar: { center: ["50%", "52%"], radius: "62%" },
  angleAxis: {
    type: "category",
    data: directions,
    // boundaryGap centers each category within its sector, so the start
    // angle is offset by half a sector width to land N exactly at top.
    startAngle: 90 + 180 / directions.length,
    clockwise: true,
    axisLabel: {
      color: t.inkSoft,
      fontSize: 14,
      formatter: (value) => (value === dominantDirection ? `{bold|${value}}` : value),
      rich: { bold: { color: t.ink, fontWeight: "bold", fontSize: 15 } },
    },
    axisLine: { lineStyle: { color: t.inkSoft } },
    axisTick: { show: false },
    splitLine: { lineStyle: { color: t.grid } },
  },
  radiusAxis: {
    type: "value",
    splitNumber: 4,
    axisLabel: { color: t.inkSoft, fontSize: 12, formatter: "{value}%" },
    axisLine: { show: false },
    splitLine: { lineStyle: { color: t.grid } },
  },
  series: speedBins.map((label, j) => ({
    name: `${label} m/s`,
    type: "bar",
    coordinateSystem: "polar",
    stack: "speed",
    barCategoryGap: "20%",
    data: table.map((row) => Number(row[j].toFixed(2))),
    itemStyle: { color: speedColors[j], borderColor: t.pageBg, borderWidth: 1 },
  })),
});
Runnable source as JSON, for any HTTP client: https://api.anyplot.ai/specs/windrose-basic/echarts/code. Any spec id and library id listed in llms-full.txt fit the same URL shape; every URL below is complete and callable.
{
  "spec_id": "windrose-basic",
  "language": "javascript",
  "library": "echarts",
  "page": "https://anyplot.ai/windrose-basic/javascript/echarts",
  "hub": "https://anyplot.ai/windrose-basic",
  "code_json": "https://api.anyplot.ai/specs/windrose-basic/echarts/code",
  "spec_json": "https://api.anyplot.ai/specs/windrose-basic",
  "render_light_png": "https://storage.googleapis.com/anyplot-images/plots/windrose-basic/javascript/echarts/plot-light.png",
  "render_dark_png": "https://storage.googleapis.com/anyplot-images/plots/windrose-basic/javascript/echarts/plot-dark.png",
  "interactive_light_html": "https://storage.googleapis.com/anyplot-images/plots/windrose-basic/javascript/echarts/plot-light.html",
  "interactive_dark_html": "https://storage.googleapis.com/anyplot-images/plots/windrose-basic/javascript/echarts/plot-dark.html",
  "quality_score": 94.0,
  "license": "MIT",
  "guide": "https://anyplot.ai/llms.txt"
}
Part of Wind Rose Chart on anyplot.ai.