The same plot in 14 other libraries — JavaScript: Chart.js, D3.js, Apache ECharts, MUI X Charts; Python: Altair, Bokeh, lets-plot, Matplotlib, Plotly, plotnine, Pygal, Seaborn; R: ggplot2; Julia: Makie.jl. Compare all 15 side by side: Wind Rose Chart in Python, R, Julia and JavaScript.
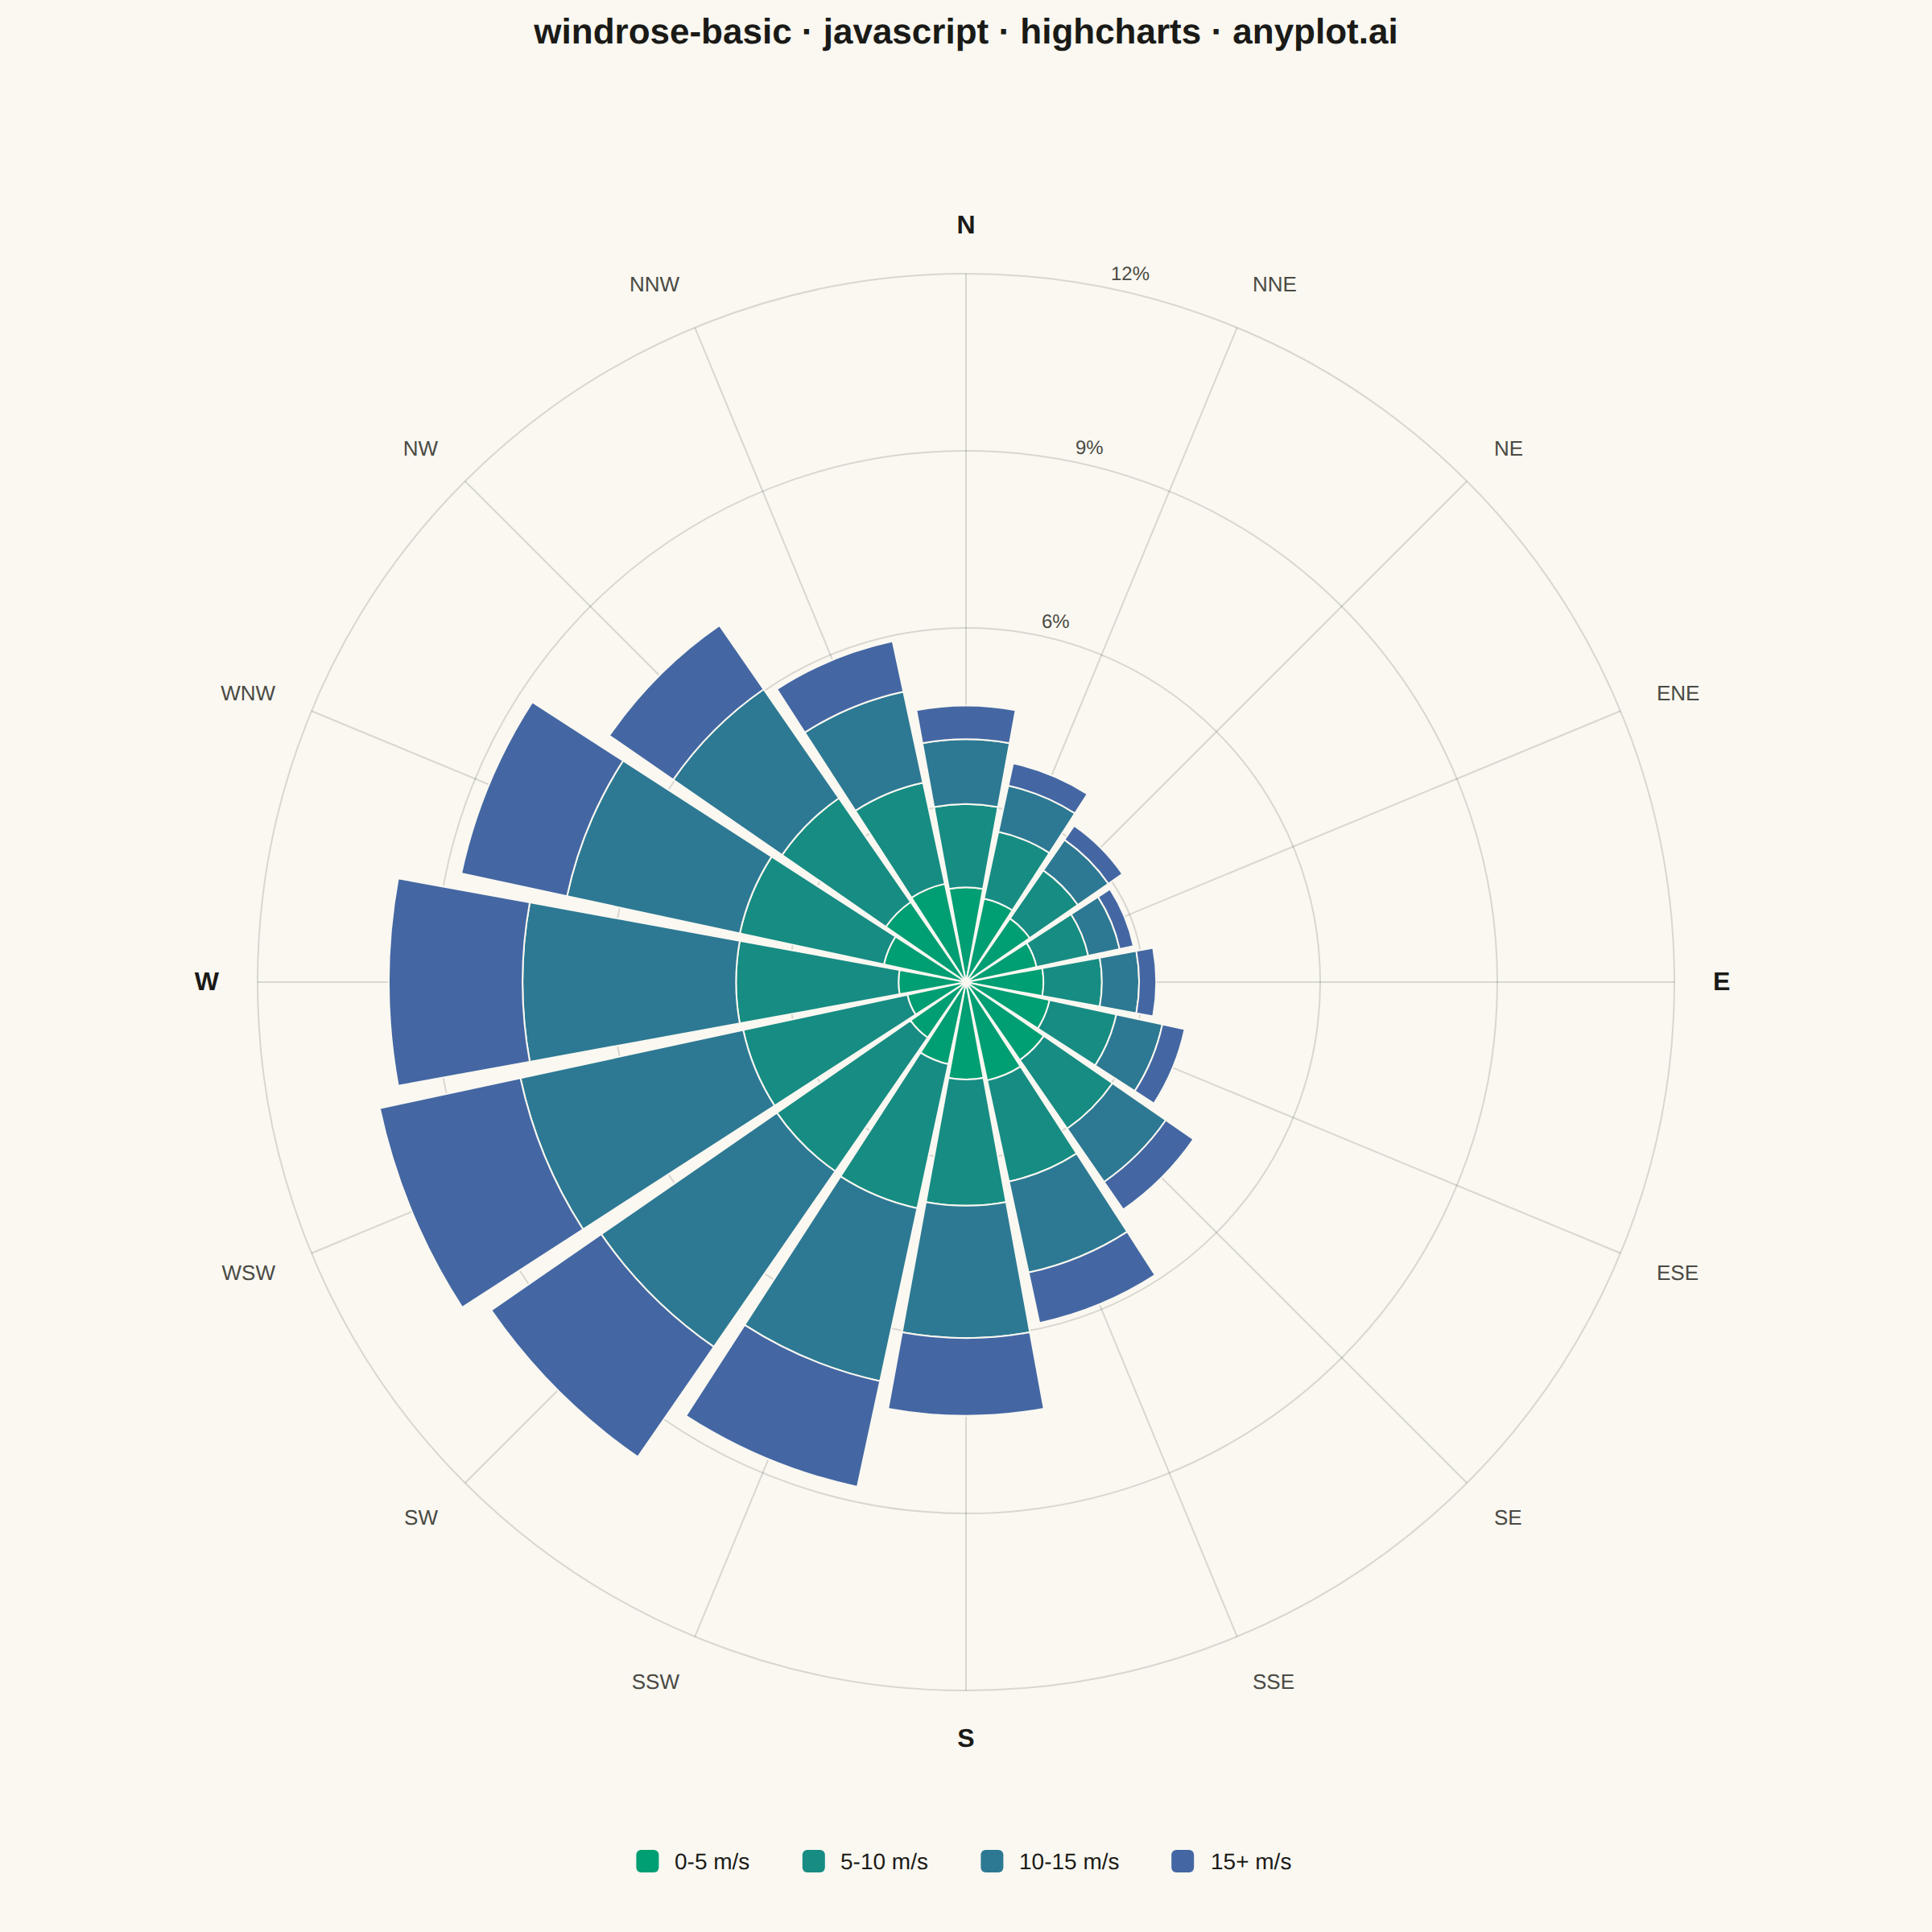
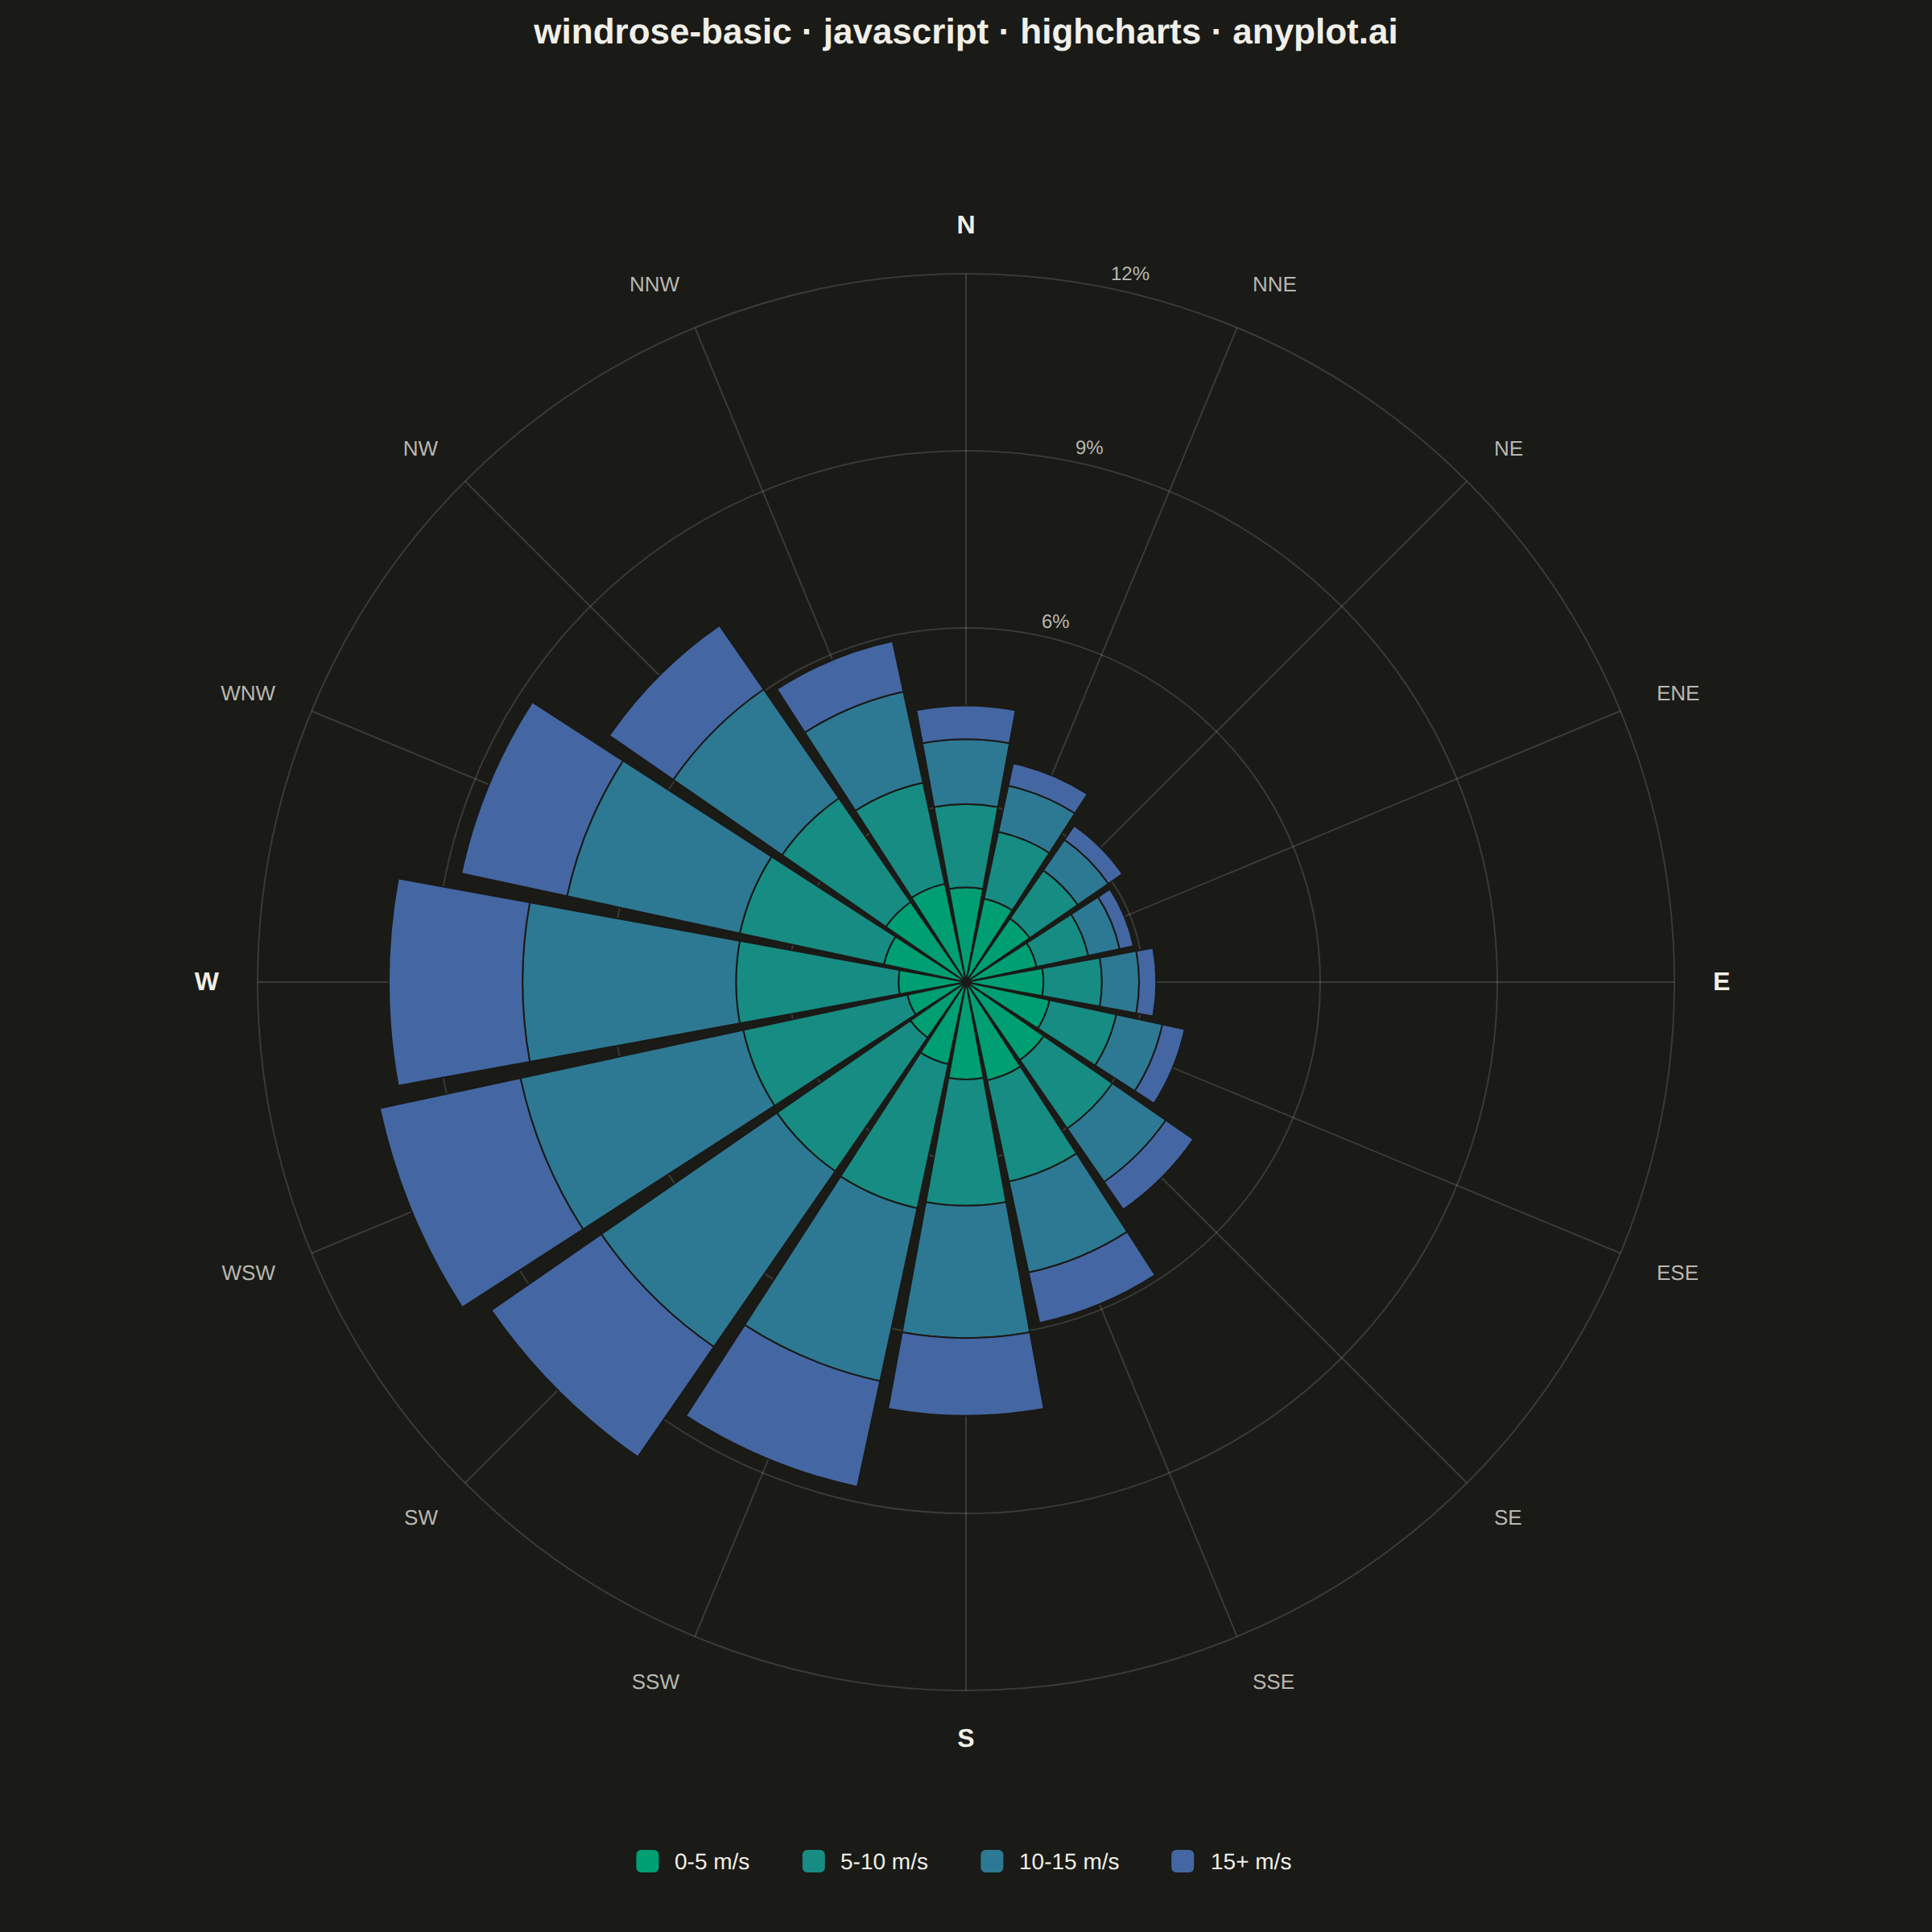
A wind rose displays wind speed and direction data as a polar stacked histogram showing the frequency distribution of wind across compass directions. Each spoke represents a direction sector (typically 8-16 bins), with stacked colored segments indicating different wind speed ranges. This specialized meteorological visualization reveals dominant wind patterns, prevailing directions, and speed distributions simultaneously, making it essential for site assessment and environmental analysis.
// anyplot.ai
// windrose-basic: Wind Rose Chart
// Library: highcharts 12.6.0 | JavaScript 22.23.1
// Quality: 88/100 | Created: 2026-08-05

//# anyplot-orientation: square

// Only the core `highcharts` bundle is loaded (no highcharts-more), so the
// native polar chart type isn't available. We build the wind rose's stacked
// polar wedges with the core SVG renderer's built-in `arc` primitive (the
// same donut-slice geometry pie charts use internally) instead — the same
// renderer-overlay technique the radar-basic implementation uses.
const t = window.ANYPLOT_TOKENS;

// --- Data (hourly wind observations at a coastal station, one year) --------
const DIRECTIONS = [
  "N", "NNE", "NE", "ENE", "E", "ESE", "SE", "SSE",
  "S", "SSW", "SW", "WSW", "W", "WNW", "NW", "NNW",
];
const SPEED_BINS = ["0-5 m/s", "5-10 m/s", "10-15 m/s", "15+ m/s"];
const n = DIRECTIONS.length;

// Prevailing wind out of the WSW, tapering off with angular distance — the
// 16 direction totals sum to 100% of observations.
const PREVAILING_INDEX = 11; // WSW
const SIGMA = 3.1;
const rawWeights = DIRECTIONS.map((_, i) => {
  const dist = Math.min(Math.abs(i - PREVAILING_INDEX), n - Math.abs(i - PREVAILING_INDEX));
  return 0.35 + Math.exp(-(dist * dist) / (2 * SIGMA * SIGMA));
});
const weightSum = rawWeights.reduce((sum, w) => sum + w, 0);
const directionTotals = rawWeights.map((w) => (w / weightSum) * 100);
const maxTotal = Math.max(...directionTotals);

// Speed-bin mix shifts toward the higher bins where the wind blows hardest.
const CALM_MIX = [0.55, 0.32, 0.11, 0.02];
const STRONG_MIX = [0.1, 0.28, 0.38, 0.24];
const freq = directionTotals.map((total) => {
  const strength = total / maxTotal;
  return CALM_MIX.map((c, k) => (c + (STRONG_MIX[k] - c) * strength) * total);
});

// Imprint sequential ramp (calm -> strong) for the 4 stacked speed bins —
// position 1 (`t.seq[0]`) is `#009E73`, so the calm bin stays brand green.
const lerpHex = (hexA, hexB, frac) => {
  const a = [1, 3, 5].map((p) => parseInt(hexA.slice(p, p + 2), 16));
  const b = [1, 3, 5].map((p) => parseInt(hexB.slice(p, p + 2), 16));
  return `#${a.map((v, i) => Math.round(v + (b[i] - v) * frac).toString(16).padStart(2, "0")).join("")}`;
};
const speedColors = SPEED_BINS.map((_, k) => lerpHex(t.seq[0], t.seq[1], k / (SPEED_BINS.length - 1)));

const TITLE = "windrose-basic · javascript · highcharts · anyplot.ai";
const titleFs = Math.max(15, Math.round(22 * Math.min(1, 67 / TITLE.length))) + "px";

// --- Chart (empty core chart used as a canvas for the renderer overlay) ----
const chart = Highcharts.chart("container", {
  chart: {
    backgroundColor: "transparent",
    animation: false,
    style: { fontFamily: "inherit" },
    margin: [110, 70, 90, 70],
  },
  credits: { enabled: false },
  title: { text: TITLE, style: { color: t.ink, fontSize: titleFs, fontWeight: "600" } },
  xAxis: { visible: false, gridLineWidth: 0, lineWidth: 0, tickLength: 0 },
  yAxis: { visible: false, gridLineWidth: 0, lineWidth: 0, tickLength: 0 },
  legend: { enabled: false },
  tooltip: {
    enabled: true,
    backgroundColor: t.elevatedBg,
    borderColor: t.grid,
    style: { color: t.ink },
    formatter() {
      const p = this.point.custom;
      return `<b>${p.direction}</b><br/>${p.speedBin}: ${p.value.toFixed(1)}% of observations`;
    },
  },
  plotOptions: { series: { animation: false } },
  series: [],
});

// Fix the (visible: false) axes to a known pixel-space extent so a real
// scatter series can be data-bound at the same polar-projected coordinates
// the renderer overlay uses below — the PNG stays untouched while the
// interactive HTML gets genuine hoverable Highcharts points.
chart.xAxis[0].setExtremes(0, chart.plotWidth, false);
chart.yAxis[0].setExtremes(0, chart.plotHeight, false);

// --- Geometry ----------------------------------------------------------------
const cx = chart.plotLeft + chart.plotWidth / 2;
const cy = chart.plotTop + chart.plotHeight / 2;
const outerR = Math.min(chart.plotWidth, chart.plotHeight) / 2 - 60;

const RING_STEP = 3; // percentage points per grid ring
const maxRing = Math.ceil((maxTotal * 1.15) / RING_STEP) * RING_STEP;
const radiusFor = (value) => (value / maxRing) * outerR;

// Angle 0 (North) points straight up; sectors proceed clockwise like a
// compass. `renderer.arc` uses 0 = right, -PI/2 = up, increasing clockwise.
const sectorWidth = (2 * Math.PI) / n;
const wedgeGap = sectorWidth * 0.08;
const angleOf = (i) => -Math.PI / 2 + i * sectorWidth;

// --- Radial grid rings + scale labels -----------------------------------------
const ringLabelAngle = angleOf(0) + sectorWidth / 2; // between N and NNE, clear of cardinal labels
for (let level = RING_STEP; level <= maxRing; level += RING_STEP) {
  const r = radiusFor(level);
  chart.renderer.circle(cx, cy, r).attr({ stroke: t.grid, "stroke-width": 1, fill: "none", zIndex: 1 }).add();
  chart.renderer
    .text(`${level}%`, cx + r * Math.cos(ringLabelAngle) + 4, cy + r * Math.sin(ringLabelAngle) - 4)
    .attr({ zIndex: 1 })
    .css({ fontSize: "12px", color: t.inkSoft, fontFamily: "inherit" })
    .add();
}

// --- Direction spokes + compass labels ----------------------------------------
const CARDINALS = new Set([0, 4, 8, 12]); // N, E, S, W
DIRECTIONS.forEach((label, i) => {
  const angle = angleOf(i);
  const cos = Math.cos(angle);
  const sin = Math.sin(angle);
  chart.renderer
    .path(["M", cx, cy, "L", cx + outerR * cos, cy + outerR * sin])
    .attr({ stroke: t.grid, "stroke-width": 1, zIndex: 0 })
    .add();

  const isCardinal = CARDINALS.has(i);
  const [lx, ly] = [cx + (outerR + 24) * cos, cy + (outerR + 24) * sin];
  const align = cos > 0.3 ? "left" : cos < -0.3 ? "right" : "center";
  chart.renderer
    .text(label, lx, ly + sin * 6 + 5)
    .attr({ align, zIndex: 5 })
    .css({
      fontSize: isCardinal ? "16px" : "13px",
      fontWeight: isCardinal ? "700" : "400",
      color: isCardinal ? t.ink : t.inkSoft,
      fontFamily: "inherit",
    })
    .add();
});

// --- Stacked wedge segments + invisible tooltip anchors -----------------------
const points = [];
DIRECTIONS.forEach((direction, i) => {
  const start = angleOf(i) - sectorWidth / 2 + wedgeGap / 2;
  const end = angleOf(i) + sectorWidth / 2 - wedgeGap / 2;
  const midAngle = (start + end) / 2;
  let cumulative = 0;

  freq[i].forEach((value, k) => {
    const rInner = radiusFor(cumulative);
    const rOuter = radiusFor(cumulative + value);
    chart.renderer
      .arc(cx, cy, rOuter, rInner, start, end)
      .attr({ fill: speedColors[k], stroke: t.pageBg, "stroke-width": 1, zIndex: 2 })
      .add();

    const midR = (rInner + rOuter) / 2;
    const px = cx + midR * Math.cos(midAngle);
    const py = cy + midR * Math.sin(midAngle);
    points.push({
      x: px - chart.plotLeft,
      y: chart.plotTop + chart.plotHeight - py,
      color: speedColors[k],
      custom: { direction, speedBin: SPEED_BINS[k], value },
    });
    cumulative += value;
  });
});

chart.addSeries(
  {
    type: "scatter",
    name: "Frequency",
    enableMouseTracking: true,
    stickyTracking: false,
    animation: false,
    marker: {
      enabled: false,
      radius: 10,
      states: { hover: { enabled: true, radius: 10, lineWidth: 0 } },
    },
    data: points,
  },
  false
);
chart.redraw();

// --- Legend (speed-bin ramp) --------------------------------------------------
const chipSize = 14;
const chipGap = 26;
const legendFs = 14;
const chipTextWidths = SPEED_BINS.map((label) => label.length * 7.6);
const legendWidth = SPEED_BINS.reduce(
  (sum, _label, i) => sum + chipSize + 10 + chipTextWidths[i] + (i < SPEED_BINS.length - 1 ? chipGap : 0),
  0
);
let legendX = cx - legendWidth / 2;
const legendY = chart.plotTop + chart.plotHeight + 46;

SPEED_BINS.forEach((label, i) => {
  chart.renderer.rect(legendX, legendY - chipSize / 2, chipSize, chipSize, 3).attr({ fill: speedColors[i], zIndex: 5 }).add();
  chart.renderer
    .text(label, legendX + chipSize + 10, legendY + chipSize / 2 - 2)
    .attr({ align: "left", zIndex: 5 })
    .css({ fontSize: `${legendFs}px`, color: t.ink, fontFamily: "inherit" })
    .add();
  legendX += chipSize + 10 + chipTextWidths[i] + chipGap;
});
Runnable source as JSON, for any HTTP client: https://api.anyplot.ai/specs/windrose-basic/highcharts/code. Any spec id and library id listed in llms-full.txt fit the same URL shape; every URL below is complete and callable.
{
  "spec_id": "windrose-basic",
  "language": "javascript",
  "library": "highcharts",
  "page": "https://anyplot.ai/windrose-basic/javascript/highcharts",
  "hub": "https://anyplot.ai/windrose-basic",
  "code_json": "https://api.anyplot.ai/specs/windrose-basic/highcharts/code",
  "spec_json": "https://api.anyplot.ai/specs/windrose-basic",
  "render_light_png": "https://storage.googleapis.com/anyplot-images/plots/windrose-basic/javascript/highcharts/plot-light.png",
  "render_dark_png": "https://storage.googleapis.com/anyplot-images/plots/windrose-basic/javascript/highcharts/plot-dark.png",
  "interactive_light_html": "https://storage.googleapis.com/anyplot-images/plots/windrose-basic/javascript/highcharts/plot-light.html",
  "interactive_dark_html": "https://storage.googleapis.com/anyplot-images/plots/windrose-basic/javascript/highcharts/plot-dark.html",
  "quality_score": 88.0,
  "license": "MIT",
  "guide": "https://anyplot.ai/llms.txt"
}
Part of Wind Rose Chart on anyplot.ai.