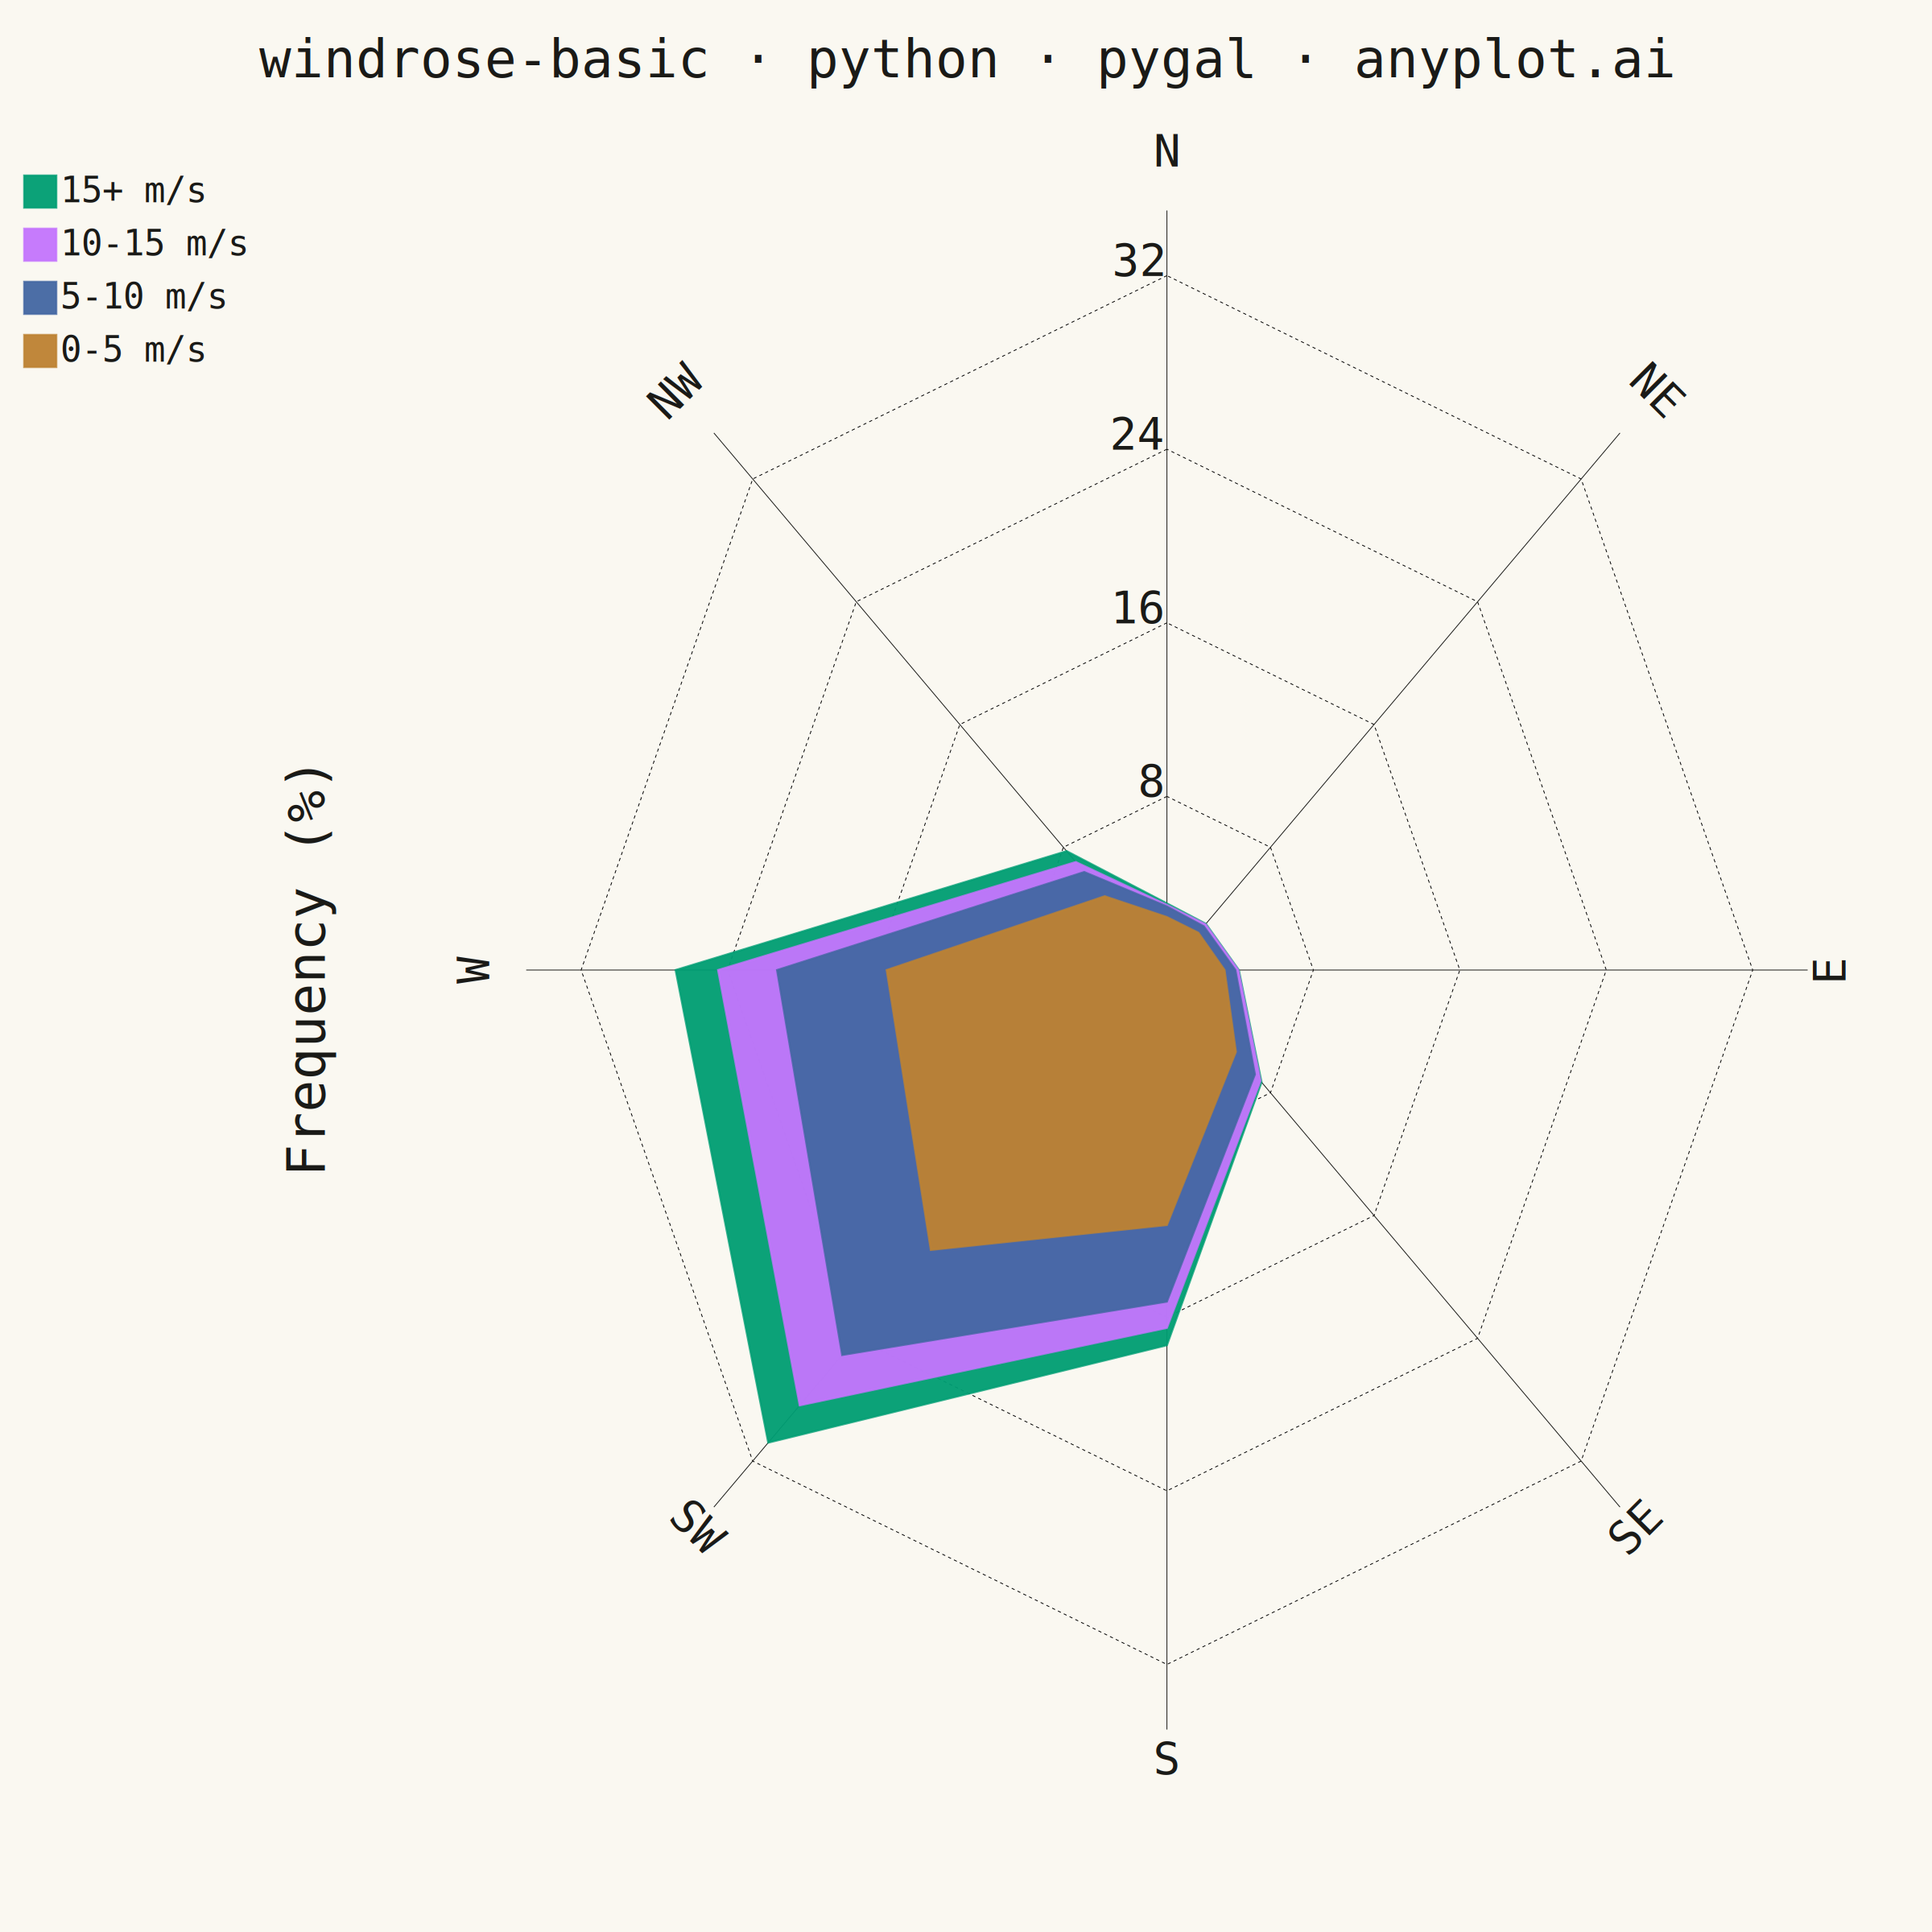
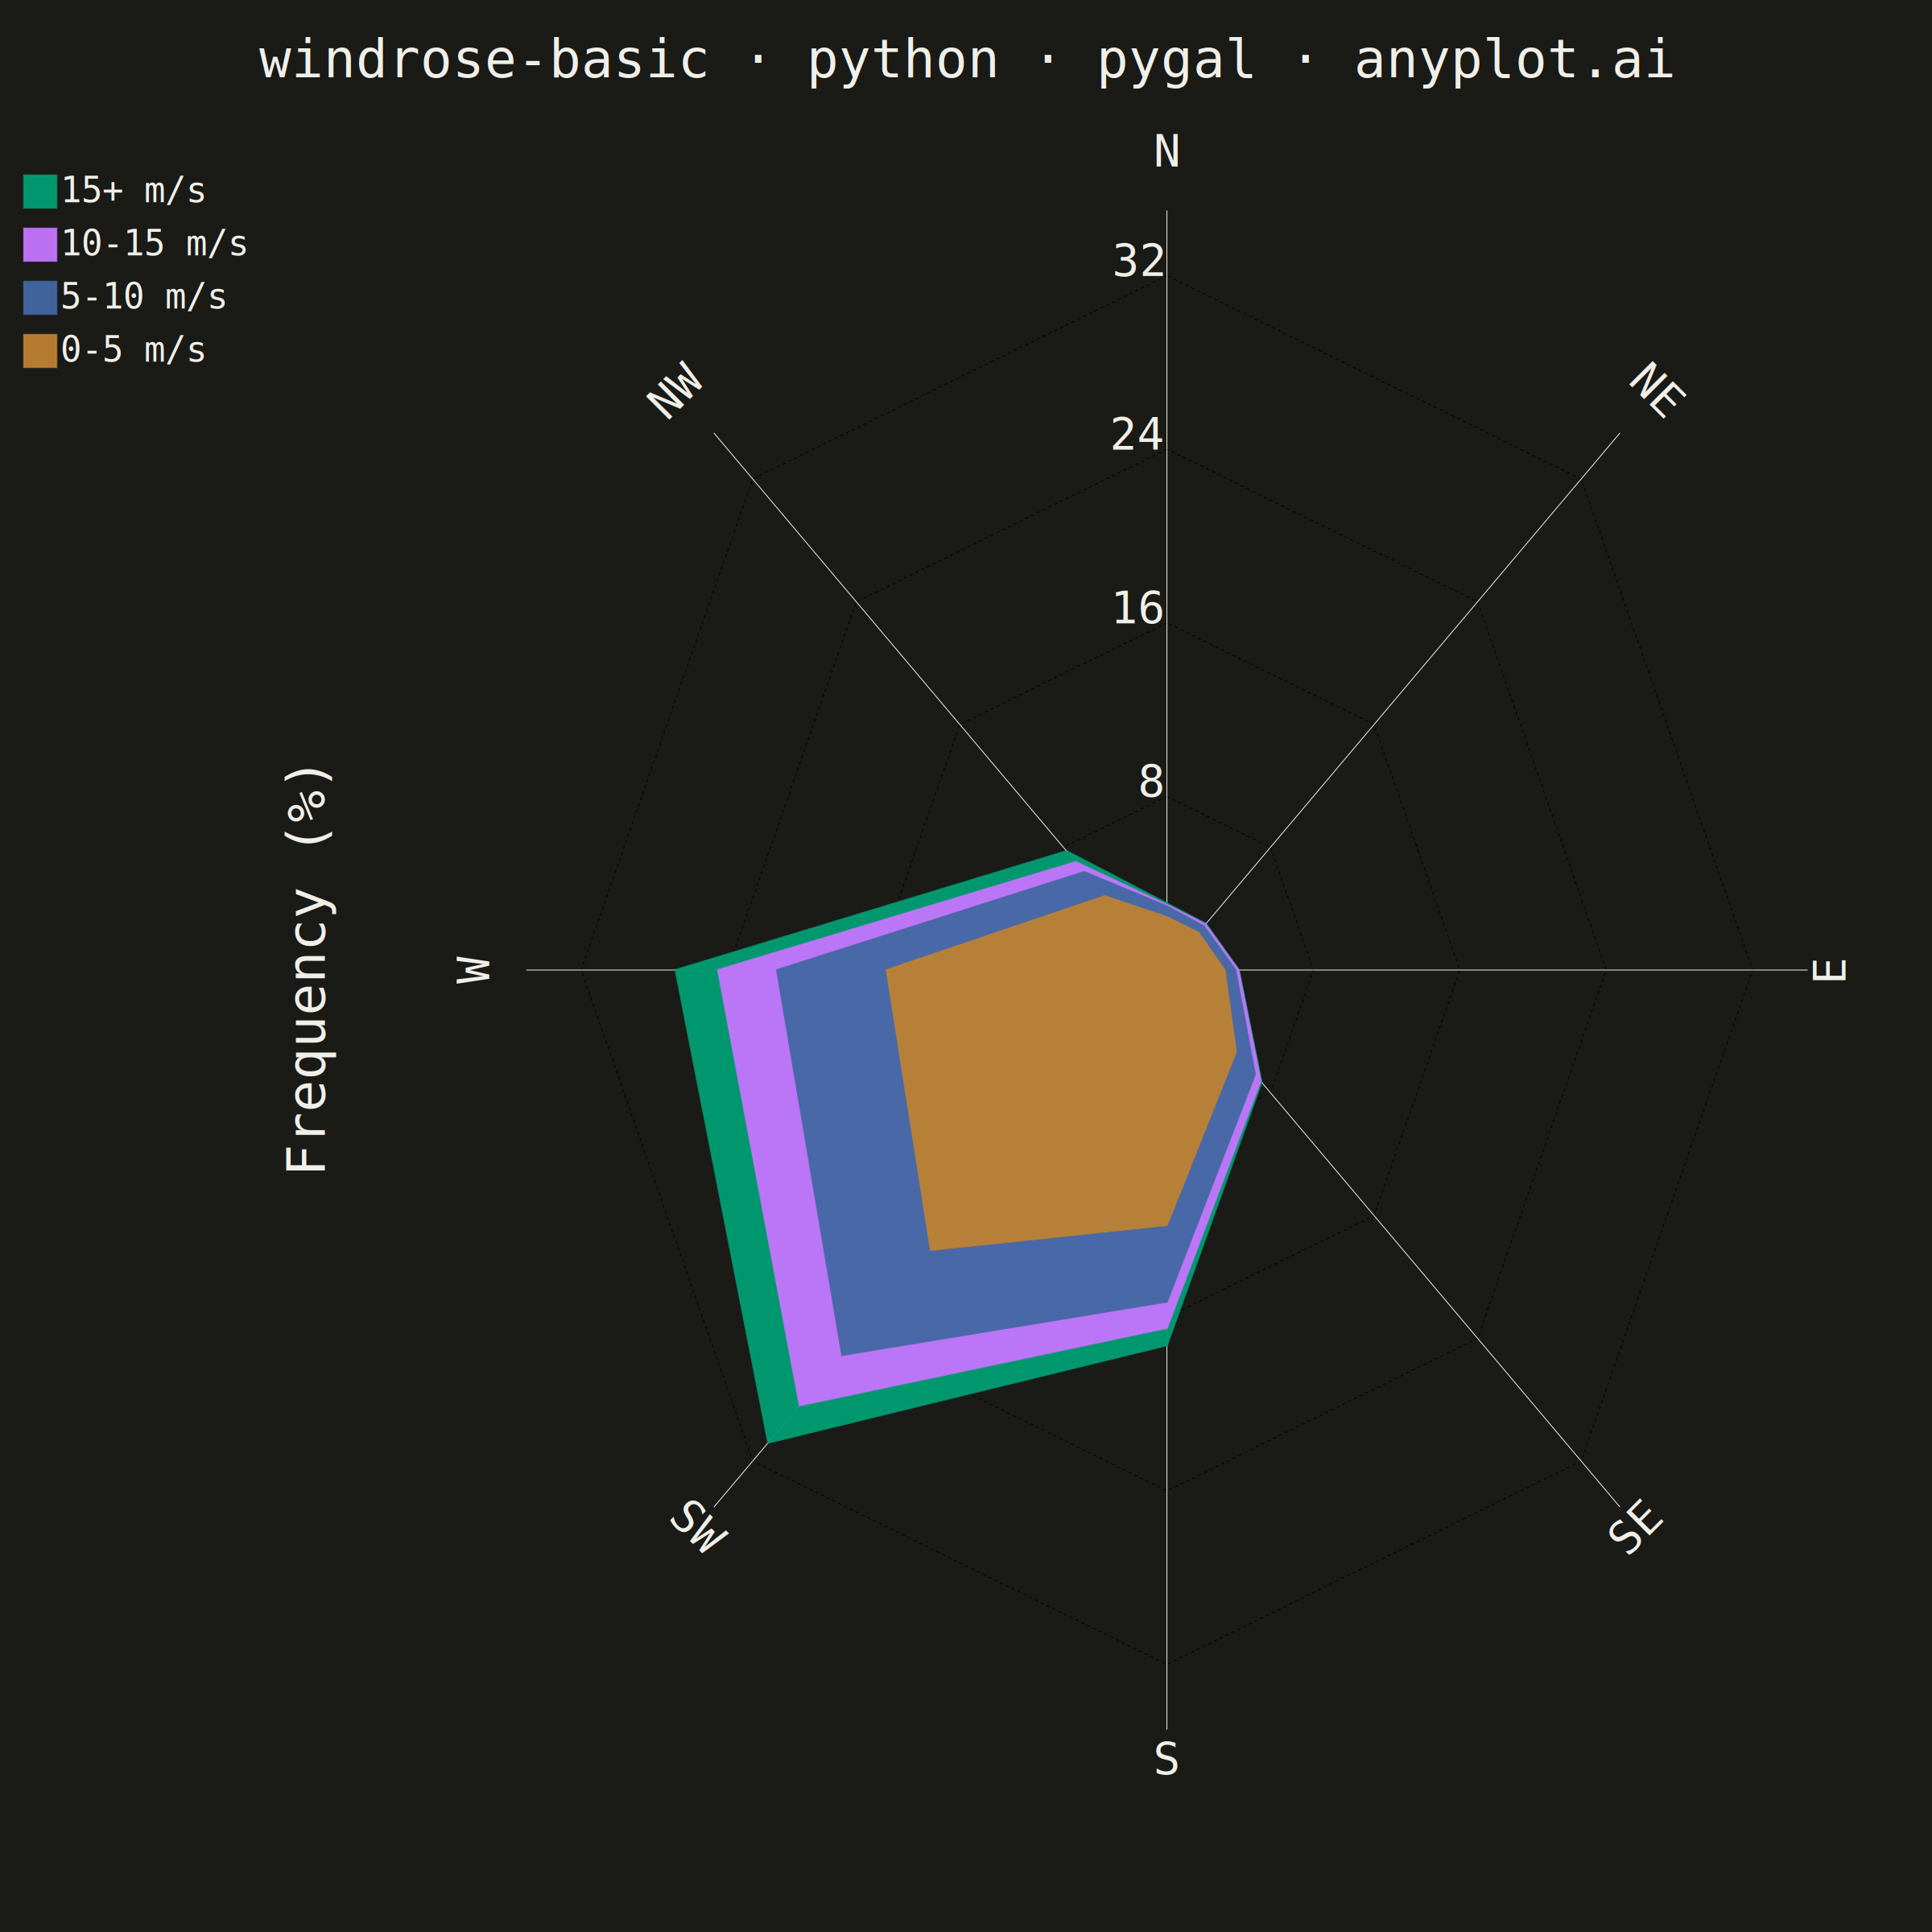
A wind rose displays wind speed and direction data as a polar stacked histogram showing the frequency distribution of wind across compass directions. Each spoke represents a direction sector (typically 8-16 bins), with stacked colored segments indicating different wind speed ranges. This specialized meteorological visualization reveals dominant wind patterns, prevailing directions, and speed distributions simultaneously, making it essential for site assessment and environmental analysis.
""" anyplot.ai
windrose-basic: Wind Rose Chart
Library: pygal 3.1.3 | Python 3.13.14
Quality: 87/100 | Updated: 2026-08-05
"""

import math
import os
import sys

import numpy as np


# Avoid import shadowing: remove script directory and cwd from path
_script_dir = os.path.dirname(os.path.abspath(__file__))
_cwd = os.getcwd()
sys.path = [p for p in sys.path if os.path.abspath(p) not in (_script_dir, _cwd, "")]

import pygal
from pygal.style import Style


# Restore path for later operations
sys.path.insert(0, _cwd)

# Theme tokens
THEME = os.getenv("ANYPLOT_THEME", "light")
PAGE_BG = "#FAF8F1" if THEME == "light" else "#1A1A17"
INK = "#1A1A17" if THEME == "light" else "#F0EFE8"
INK_MUTED = "#6B6A63" if THEME == "light" else "#A8A79F"

# Imprint palette (canonical order)
IMPRINT_PALETTE = ("#009E73", "#C475FD", "#4467A3", "#BD8233", "#AE3030", "#2ABCCD", "#954477", "#99B314")

# Data generation
np.random.seed(42)
n_observations = 8760  # ~1 year of hourly measurements

# Simulate prevailing winds from SW (225°) and W (270°) with variation
directions = np.concatenate(
    [
        np.random.normal(225, 30, int(n_observations * 0.35)),  # SW dominant
        np.random.normal(270, 25, int(n_observations * 0.25)),  # W secondary
        np.random.normal(180, 40, int(n_observations * 0.15)),  # S occasional
        np.random.uniform(0, 360, int(n_observations * 0.25)),  # Random variation
    ]
)
directions = directions % 360  # Normalize to 0-360

# Wind speeds drawn from an exponential distribution per direction cluster
# (calm sectors decay faster, gustier sectors carry a longer tail)
speeds = np.concatenate(
    [
        np.random.exponential(6.0, int(n_observations * 0.35)),  # SW: moderate-strong
        np.random.exponential(7.0, int(n_observations * 0.25)),  # W: stronger, longer tail
        np.random.exponential(4.0, int(n_observations * 0.15)),  # S: lighter
        np.random.exponential(3.0, int(n_observations * 0.25)),  # Others: light
    ]
)

# Define 8 direction sectors. pygal's Radar places category index 0 at the
# top and lays out subsequent categories COUNTER-clockwise, so the labels
# must be listed counter-clockwise-in-degrees (N, then 315, 270, ...) for the
# rendered spokes to match true (clockwise) compass bearing.
direction_labels = ["N", "NW", "W", "SW", "S", "SE", "E", "NE"]

# Define wind speed ranges (m/s)
speed_bins = [0, 5, 10, 15, np.inf]
speed_labels = ["0-5 m/s", "5-10 m/s", "10-15 m/s", "15+ m/s"]

# Calculate frequencies for each direction and speed bin
frequencies = {label: [] for label in speed_labels}

for dir_center in [0, 315, 270, 225, 180, 135, 90, 45]:
    if dir_center == 0:
        # North spans 337.5-360 and 0-22.5
        mask = (directions >= 337.5) | (directions < 22.5)
    else:
        low = dir_center - 22.5
        high = dir_center + 22.5
        mask = (directions >= low) & (directions < high)

    dir_speeds = speeds[mask]

    # Count frequencies in each speed bin
    for j, (low_speed, high_speed) in enumerate(zip(speed_bins[:-1], speed_bins[1:], strict=True)):
        count = np.sum((dir_speeds >= low_speed) & (dir_speeds < high_speed))
        freq_pct = (count / len(directions)) * 100
        frequencies[speed_labels[j]].append(round(freq_pct, 2))

# Build cumulative values for proper stacked rendering
cumulative = {}
for i, label in enumerate(speed_labels):
    cumulative[label] = [sum(frequencies[speed_labels[k]][j] for k in range(i + 1)) for j in range(8)]

# Round the radial max up to a clean multiple of 5 for a tidier axis
radial_max = max(cumulative[speed_labels[-1]])
radial_max = math.ceil(radial_max / 5) * 5

# Custom style — sizing tuned for the 2400x2400 square canvas (see
# prompts/library/pygal.md "Sizing + Theme for 3200x1800 px"; same pixel
# area as the square format, so the same unitless values apply)
custom_style = Style(
    background=PAGE_BG,
    plot_background=PAGE_BG,
    foreground=INK,
    foreground_strong=INK,
    foreground_subtle=INK_MUTED,
    colors=IMPRINT_PALETTE,
    title_font_size=66,
    label_font_size=56,
    major_label_font_size=44,
    legend_font_size=44,
    value_font_size=36,
    stroke_width=2.5,
    opacity=0.95,
    guide_stroke_width=1,
)

# Create radar chart (wind rose)
chart = pygal.Radar(
    width=2400,
    height=2400,
    style=custom_style,
    title="windrose-basic · python · pygal · anyplot.ai",
    y_title="Frequency (%)",
    show_legend=True,
    legend_at_bottom=False,
    legend_box_size=40,
    fill=True,
    stroke=True,
    show_dots=False,
    inner_radius=0.05,
    truncate_legend=-1,
    margin=90,
    spacing=30,
    show_y_guides=True,
    show_x_guides=False,
    range=(0, radial_max),
)

# Set direction labels
chart.x_labels = direction_labels

# Add series from strongest to calmest (drawing order)
# This creates proper visual stacking with each layer visible
reversed_labels = list(reversed(speed_labels))  # ["15+ m/s", "10-15 m/s", ...]
for label in reversed_labels:
    chart.add(label, cumulative[label])

# Save outputs
chart.render_to_file(f"plot-{THEME}.html")
chart.render_to_png(f"plot-{THEME}.png")
Runnable source as JSON, for any HTTP client: https://api.anyplot.ai/specs/windrose-basic/pygal/code. Any spec id and library id listed in llms-full.txt fit the same URL shape; every URL below is complete and callable.
{
  "spec_id": "windrose-basic",
  "language": "python",
  "library": "pygal",
  "page": "https://anyplot.ai/windrose-basic/python/pygal",
  "hub": "https://anyplot.ai/windrose-basic",
  "code_json": "https://api.anyplot.ai/specs/windrose-basic/pygal/code",
  "spec_json": "https://api.anyplot.ai/specs/windrose-basic",
  "render_light_png": "https://storage.googleapis.com/anyplot-images/plots/windrose-basic/python/pygal/plot-light.png",
  "render_dark_png": "https://storage.googleapis.com/anyplot-images/plots/windrose-basic/python/pygal/plot-dark.png",
  "interactive_light_html": "https://storage.googleapis.com/anyplot-images/plots/windrose-basic/python/pygal/plot-light.html",
  "interactive_dark_html": "https://storage.googleapis.com/anyplot-images/plots/windrose-basic/python/pygal/plot-dark.html",
  "quality_score": 87.0,
  "license": "MIT",
  "guide": "https://anyplot.ai/llms.txt"
}
Part of Wind Rose Chart on anyplot.ai.